1 minute read
SIMULATION ANALYSIS

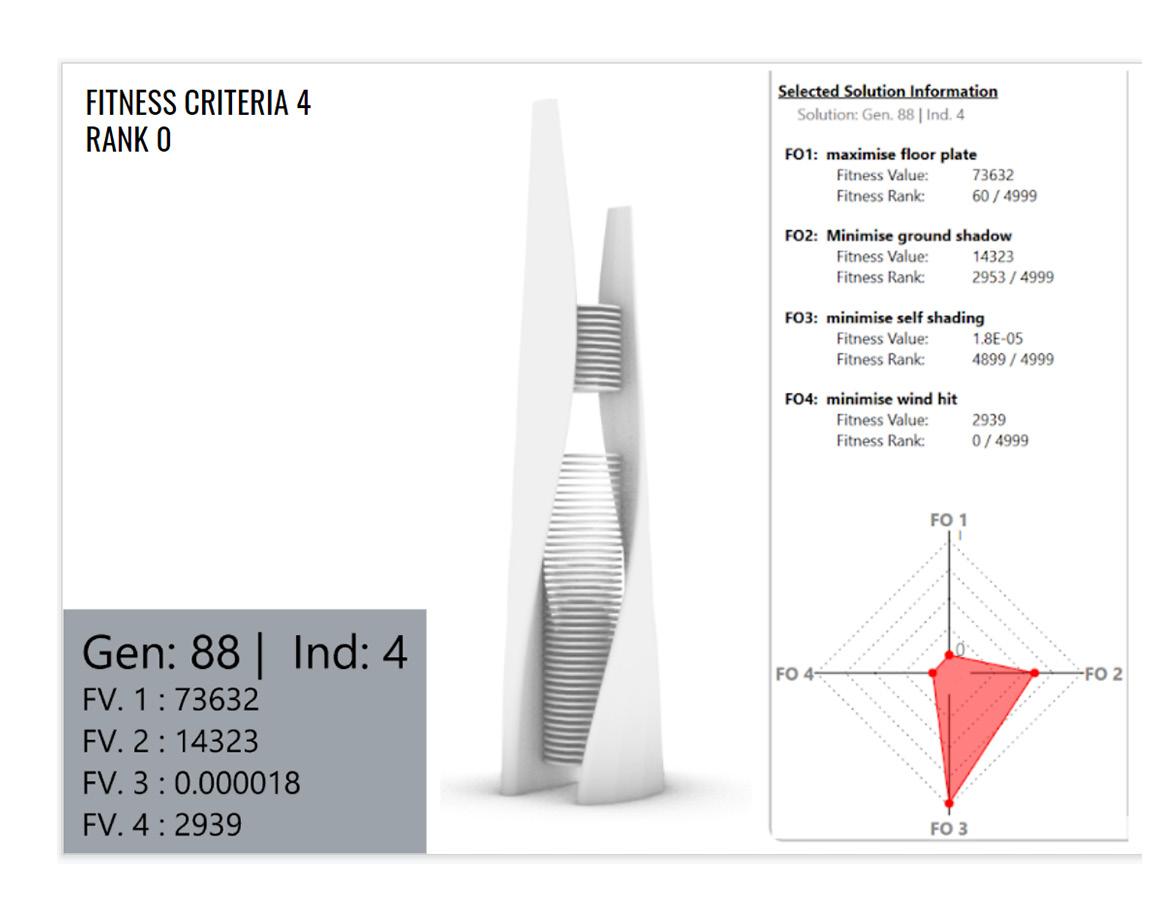
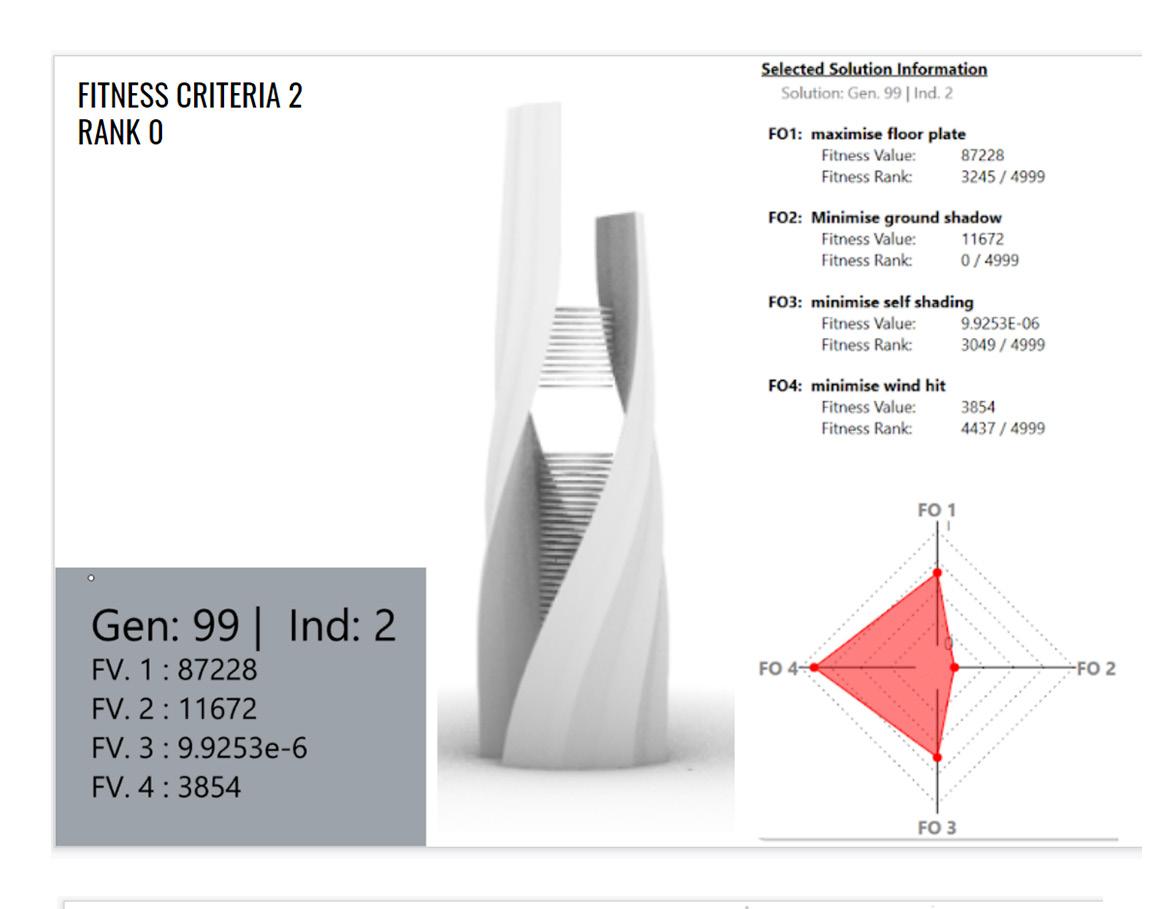
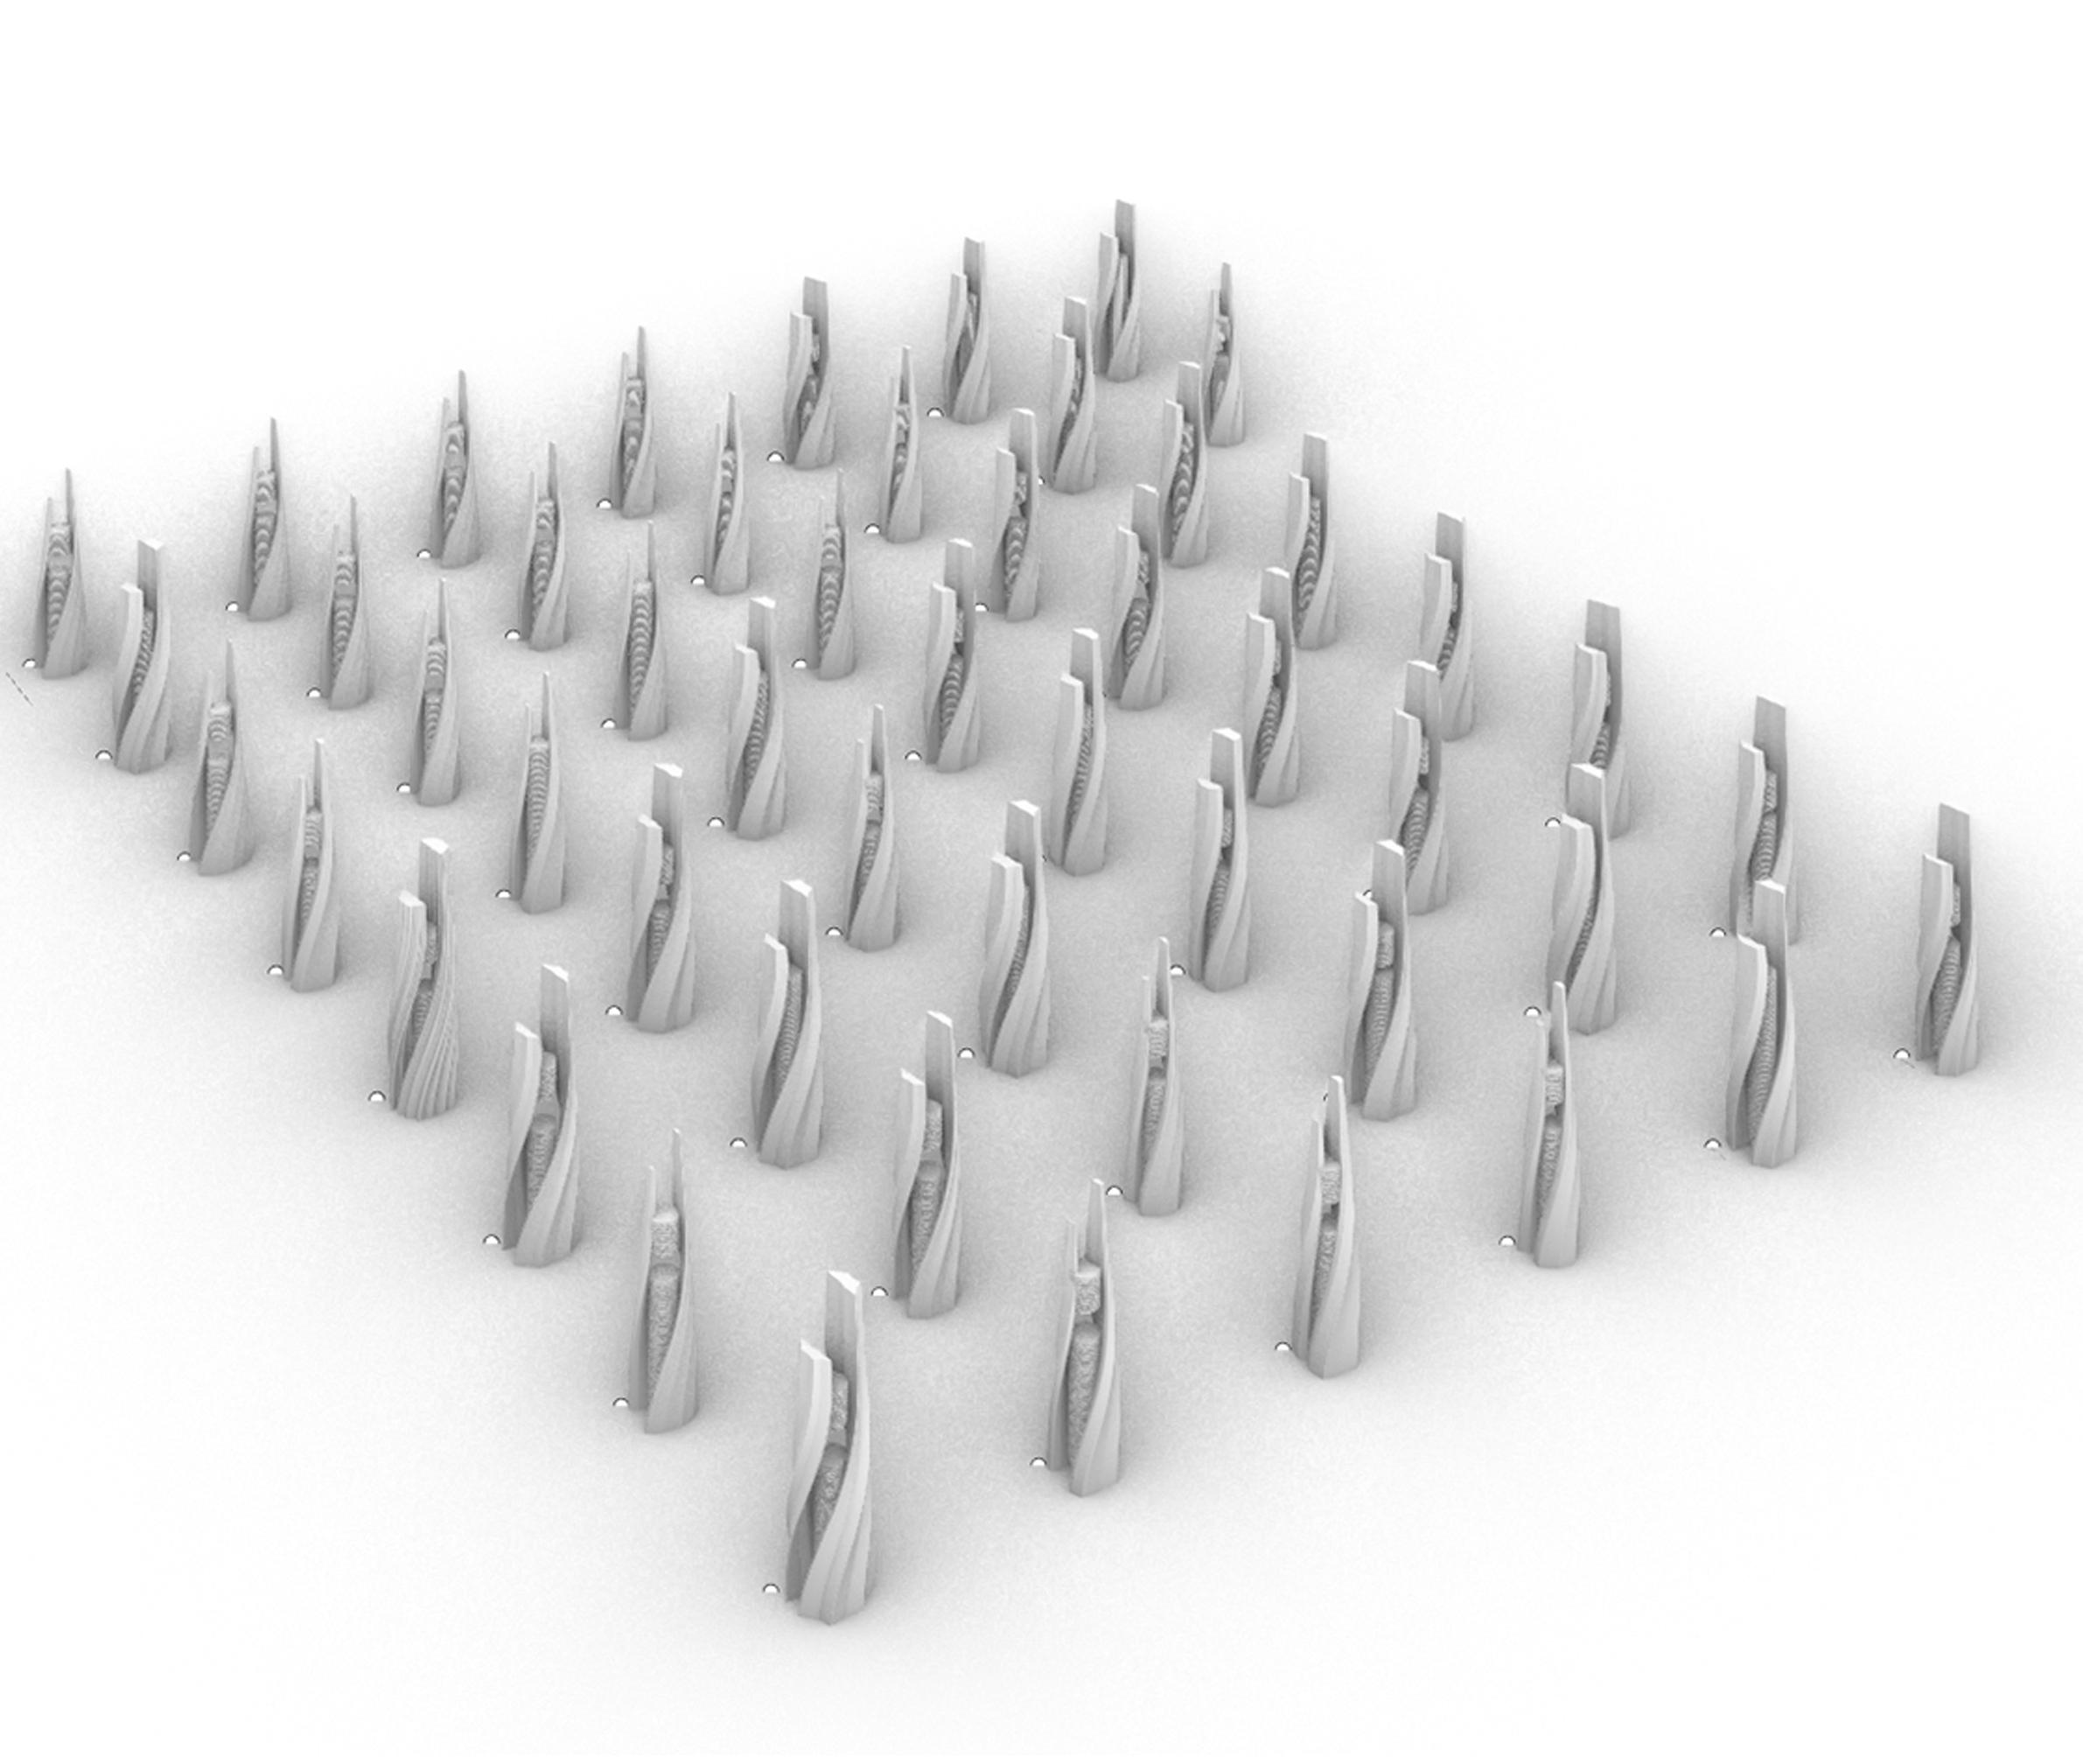
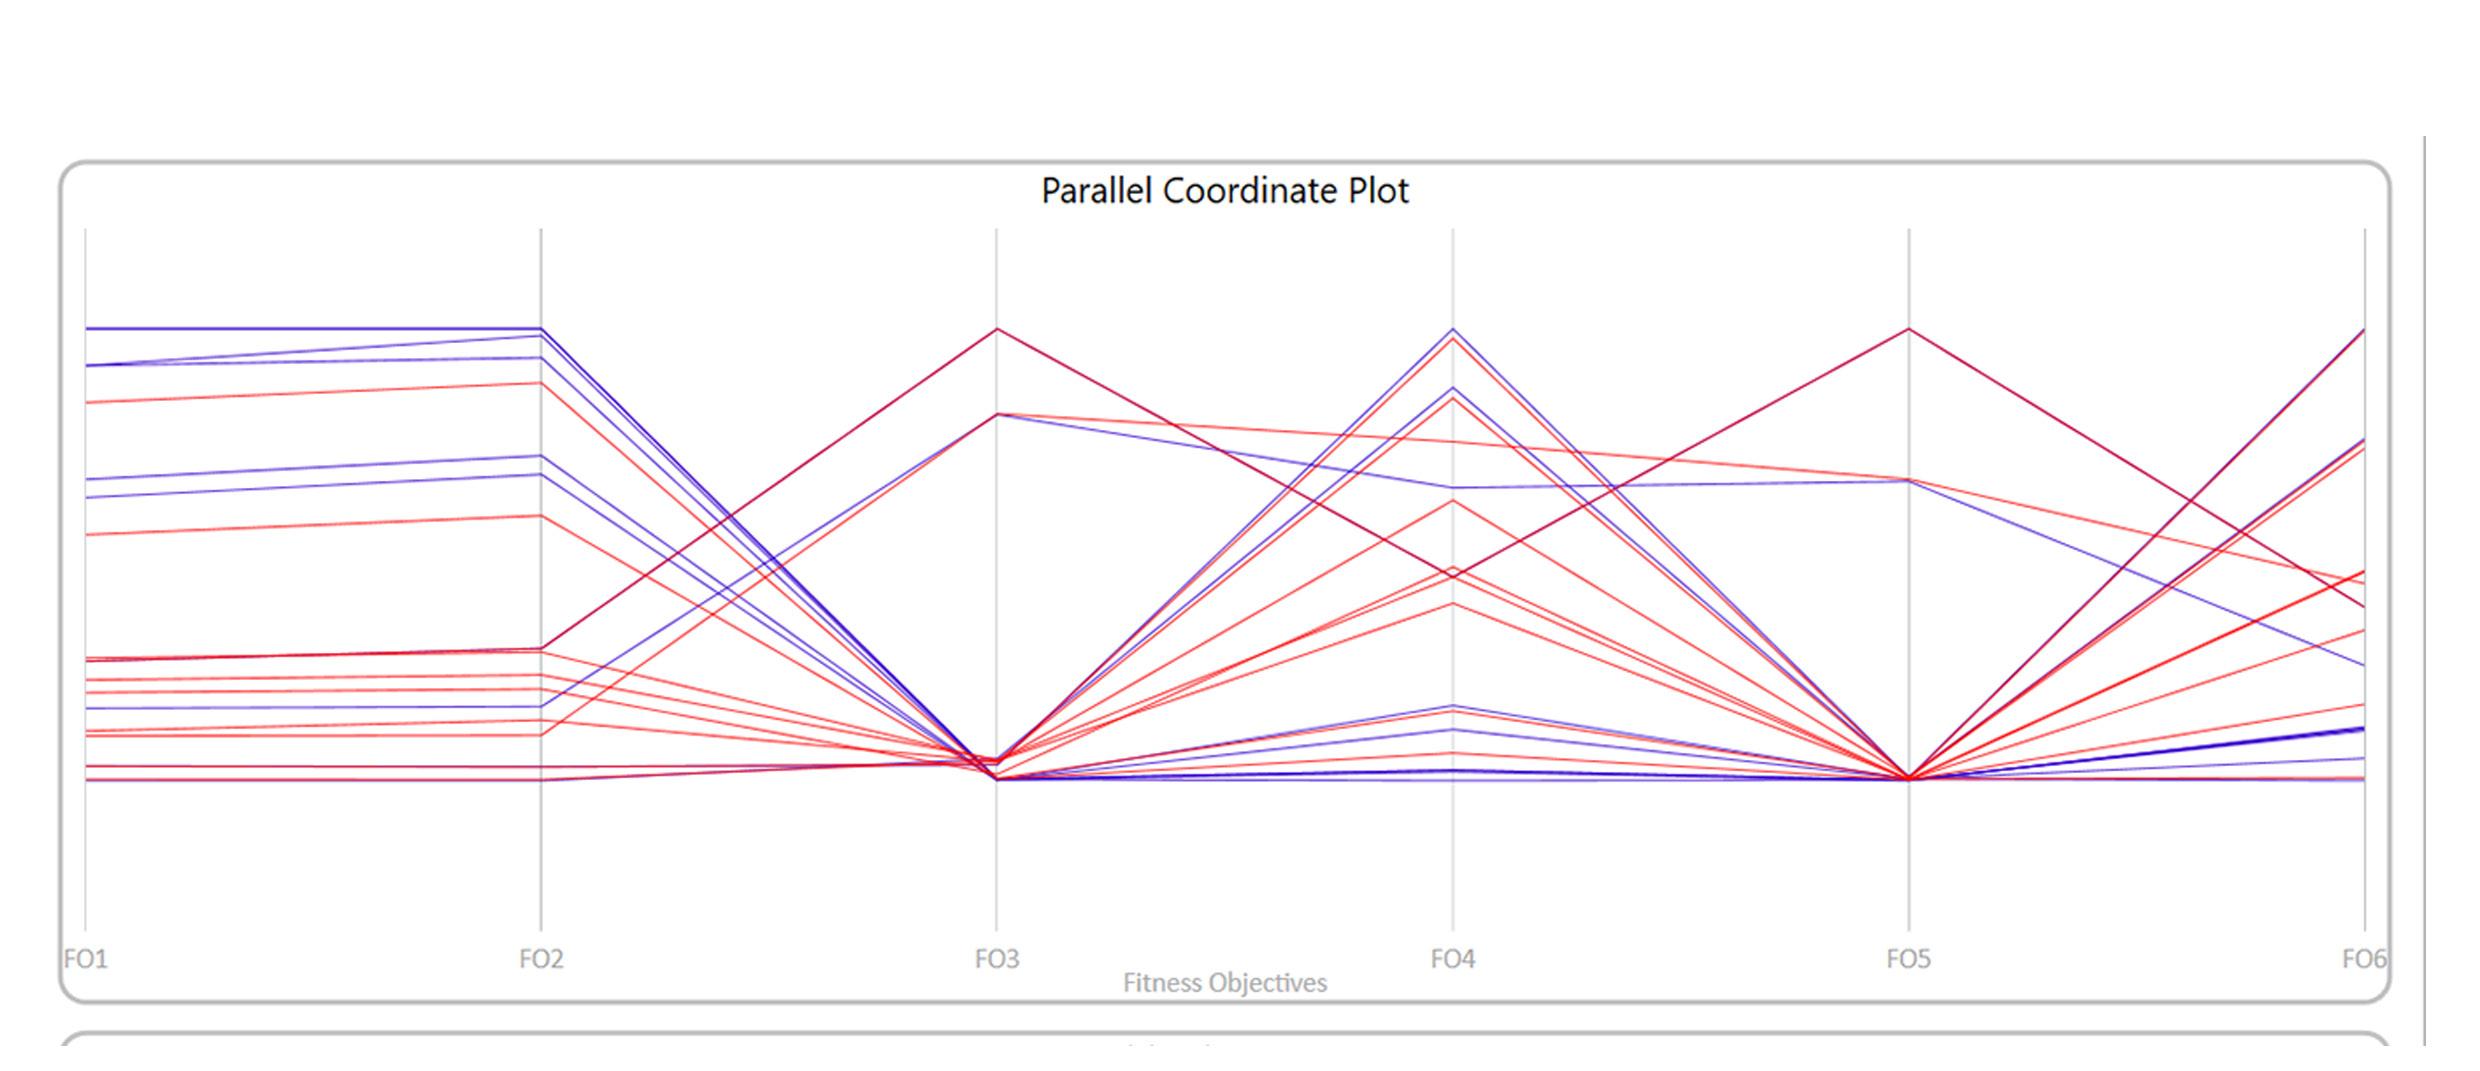
The parallel coordinate plot (figure 22) individual indicates that fitness criterias were contradicting each other in order to generate a more optimised simulation. The floor plates were maximised in the later generations as indicated by blue colour in the PCP. It can be verified that maximisation of floor plates is contradictory to minimising the shaded region on the ground. However there is variation in the genealogy of the pareto front individuals. As some individuals were optimised based on the increase in the floor plate area and corrugation. Whereas others were majorly optimised due to deletion of chromosomes that induced corrugation, as it resulted in minimisation of self shading and the wind vector hits. Fitness criterias 1,2 and 4 optimised efficiently as compared to fitness criteria 3. Although the entire generation 99 was on the pareto front (figure 23) with major allometric traits being - optimised tapering, optimised floor plate area, optimised minimisation of shadow casted on ground. The individuals belonging to the pareto front, displayed similar traits as to the individual 2 from generation 99. figure24,25,26).
Advertisement