


Transforming Your Business with a Culture of Operational Excellence The Ultimate Guide to Continuous Experience Optimization

This guide will help transform your business operations by fully leveraging the Alluvio™ by Riverbed portal, including:
How-to use key portal features. For more in-depth instructions, visit: help-uji.aternity.com/hc
Strategies to improve your business and tech stack to promote a culture of continuous experience optimization.
Best practices and expert tips to help achieve operational excellence.


Using both Real User Monitoring and Synthetic Monitoring, you can better understand the performance and business impact of your web pages. The following section of this guide will offer instructions on how you can employ robust monitoring strategies to stay on top of your business operations.

Below are four methods of page naming in the Alluvio portal, which is an important component for real user and synthetic data collection.
• Page naming is our full-page load naming. This is best done by grabbing a variable from the data layer, however if no data layer exists, then we can dynamically identify pages by using its URL. This approach has limitations. For further information on this, visit: help-uji.aternity.com/hc.
• Single Page Application (SPA) page naming enhances our capabilities to determine when a virtual turn occurs. This allows us to see the pages and opportunities when there is a partial page load, such as when the browser does not fully load a new page and only the content and elements on the page change.
• With Mutation Observer Page naming we can set specific interactions on the pages as unique insights. This allows us to understand more about the user journey and performance opportunities.
• Custom Timers can also be utilized to measure any specific interaction, feature, or call that is unique to your use case.
Through the combined implementation of these four methods, you can capture the complete experience of your customers, such as page navigation, knowing if they zoomed in on an image, clicked on a new feature on your site, opened the menu icon, and more. With these insights, you can understand the opportunity associated with improving the page or even a specific feature’s performance.


Native App data collection includes page naming and transactions via SDK timers. More information can be found here: https://help-uji.aternity.com/hc/enus/articles/16353349161747-Blue-Triangle-Analytics-SDK-for-iOS.
While standard web metrics are not available in Native App, you will have the ability to set custom timers and understand the revenue implications as those custom timers fluctuate for customers.

Once you have set the timers on each transaction in the Native App, Alluvio will help you understand app crashes, the source of customer friction, and more to optimize the user experience.

During setup, it's best practice to build out error identification. This will let you know how 4xx and 5xx errors impact the user journey, revenue, KPIs, and business goals.
The same options for page naming apply to error pages. Once named, they can be added to the Broken Links Report and Broken Links Revenue Opportunity.
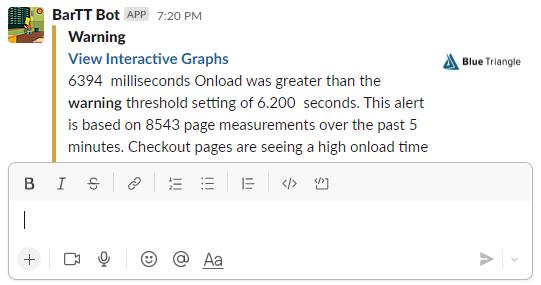
Pro Tip: You can track huge increases in errors via a page view alert.


While deciding which error identifications to capture, Alluvio can 4xx and 5xx generally or specifically for each type. This will let you understand the customer impact differences of a 404 versus a 503 or even more specific HTTP codes that are less common. This will allow you to see the impact of any individual page error.


By tracking out-of-stock pages, you can begin to understand how inventory impacts the customer journey. While a customer cannot convert on an out-of-stock page, you can see how their journey continues from there, such as if they abandon or remain on your site.
The same options for page naming apply to out-of-stock pages. Once named, they can be added to the Out-of-Stock Report and Out-of-Stock Revenue Opportunity.

Two of the most powerful fields to capture in Alluvio portal are AB Variables and Custom Categories.
AB Variables are captured and stored at a session level, while custom categories are at the page level. AB variables allow you to understand the conversion implication of performance.

While there are several possibilities, below are few examples of fields to capture that our most successful, performance-driven clients utilize:
• Site deployment version
• Authenticated Users
• Rewards Members
• Customer Type
• Subpage Type
• Localized Store
• Target/Monetate/Optimizely tests

• Geographical Information
• On your internal Wi-Fi
• Browser permission status
• Platform type and more
Note: To be able to compare any of these fields on a conversion curve and customer journey, you will need to have them configured as an AB variable. It is best practice to set up your deployment version as an AB variable.

Automated event markers empower your change management team with significantly faster identification of changes that could correlate to a site event. These can be added via our API or manually.
Leverage the API: With our API, you can automate the entry with the event marker API to visualize deployments on charts, graphs, and dashboards. Once live, this will help to correlate performance, revenue, or customer frustration gaps introduced by the deployment. This should be done for tag deployments as well. For more information, read: https://help-uji.aternity.com/hc/en-us/articles/15843070069139Event-Markers-Endpoint
Manual Entry: While less ideal, if your business restricts the use of the API, we also allow you to be able to add them manually. This can be built into the deployment process steps to help achieve similar value.


Web Content Detail (WCD) Data allows you to understand object-level data of real users. With this considerable amount of data, you can improve tag governance and your understanding of object performance.

With additional, robust WCD data, you can make more precise decisions.
The ideal percentage depends on "data significance," but we recommend 10% as a general standard. As your page volume scales up, this number can be lower, and you can still maintain data confidence.


Alluvio's Issue Tracker is a unique way to merge the task lists comprised of portal insights, observations from Alluvio's Customer Success Team, and requests from your team for Alluvio. Using the issue tracker will help to ensure that each observation becomes an action.

Consult with your dedicated Alluvio Customer Success Team to adapt use of the Issue Tracker for your specific needs.


There are several test types you can leverage, and organizations driven by operational excellence will employ a diverse range of tests across all critical web pages. Single Page Tests are the core browser emulation of a single page.

Use customer journey and page volume to identify your most critical pages. Your top pages should be hit with a high frequency of synthetic measurements. We advise at least 15-minute intervals (ideally 5-minutes) and include all regions your target customers exist.
For example, on the left, we have the top 20 pages of a demo website, where at minimum the top 10 are being measured every 5-15 minutes across all targeted regions.

The Alluvio auto-scheduler feature provides continuous insights into the dynamic top pages.


Leveraging auto-scheduler ensures manual configuration does not reduce visibility. Auto-scheduler will automatically schedule tests for the top 20 pages (based on RUM volume) even as the top 20 pages change daily.

Configuration for volume on auto-scheduler is customizable. We recommend adding filmstrip and screenshots to auto-scheduled tests and a frequency of 30 minutes or higher.

You can filter synthetic data using content groups and understand the auto-scheduled tests.

Multi-Step Tests allow you to understand the customer journey from a clean room environment. These tests should be created based on the top journeys of the top landing pages.

Use customer journey analytics to identify the top three landing pages or more for mobile device and desktop experiences. From here, determine each landing pages’ top 5 converting and non-converting paths. Next, generate a selenium script based on each path. For a how-to on selenium scripting, visit: https://helpuji.aternity.com/hc/en-us/articles/16078119964307-How-to-Write-Synthetic-Scripts.


Follow all steps along each customer journey path to create a robust synthetic understanding of your customers. These scripts should run at a 30-minute frequency or faster across regions where your customers are located.
Additionally, repeat the configuration to include mobile devices as an independent multi-step test.


API Checks allow you to understand both base performance and availability. These are low-cost measurements that can be extremely valuable at high volumes.

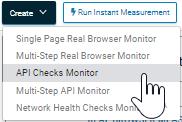
API Checks should be applied to all significant pages, and each at a frequency of 1 minute with all relevant nodes for your customers.

Additionally, API Check should be applied to all APIs to better understand availability and performance, such as inventory checks, scheduling, and recommendations.
API Checks also serve as a unique way to understand Native App performance. Multi-step API Checks are also available for the user journey of Native App.

Network Health Checks allow you to ensure the network is working as expected. Using these will enable you to isolate or exclude network issues during triage.


Network Health Checks should hit all major internal systems your website depends on. This will allow you to understand the impact that the network is having on any specific resource. With proper monitors in place, you can understand the stability of the network supporting your customers, as well as the overall performance and health of your website. Historical trace routes are also available to diagnose any problems as they arise.


For non-prod testing, mimic your prod single-page test strategy. This will provide a pre-production understanding of what's to come while balancing expectations of what is observed in production week over week.

Using the API scheduler, the best practice to approach non-prod deployments is to link synthetics to specific pre-prod deployments. This will enable a historical track of how deployments are impacting site performance.

Inside your CI/CD pipeline, your development team should implement automated scheduled tests that link to specific releases. This will allow your operation to see historical pre-prod performance as deployments are pushed throughout environments. For more information, visit: https://help-uji.aternity.com/hc/enus/articles/15843312957971-Synthetic-Monitor-Endpoint.

Definition:
that the onload event is triggered, including content, images, JavaScript, CSS, and other external files.

Why it's good: Onload is a universal marker on pages supported by all browsers. This allows us to benchmark and understand the differences between browsers and their impact on page performance.
What to consider: Due to the critical content in the early parts of the page, we often find a very high correlation between onload and revenue. As a result, we recommend using onload as a core benchmark for understanding performance and customer journey friction.

It is possible for the dev team to artificially fire the onload event early to trigger conditionals but not have a completed page. In this case, we often see unhealthy conversion rate curves.
Definition: One of the three core web vitals, Largest Contentful Paint seeks to provide an even playing field on how fast the page loads and, more importantly, the moment when customers feel they should be able to interact.
Why it's good: LCP helps to explain the visual expectation of when the page is ready for customers. This gives us a great idea of how quickly the page renders the most important content for the customers and the point at which customers will start to interact with the page.


What to consider: LCP is only available in an official capacity on Chromium browsers such as Chrome, Edge, etc. While the concepts of improving customer experience will still help non-chromium such as Safari and Firefox, there is no official support in those browsers.
Additionally, the object expected to be the LCP and the actual LCP object is occasionally different. Ensure to understand what the LCP object is during analysis.
Definition: One of the three core web vitals, First Input Delay, seeks to answer the page's interactivity. As a non-page load metric, we understand how quickly the site responds to customer interactions.
Why it's good: FID lets us understand how quickly the site responds to users. Slow FID indicates user experience degradation.

What to consider: An often-ignored concept isn't to understand what the FID time is but more when the customers tend to provide the first input. With that, you will be able to understand the page dependencies that are created for customers to start interacting. Using our aggregate waterfalls, we can understand that moment.
Definition: One of the three core web vitals, Cumulative Layout Shift, seeks to quantify the stability of the page. As a non-page load metric, we understand how much the core of the page shifts as the page loads and as the customer interacts.
Why it's good: CLS answers a few questions. First, customers won't be frustrated that the site is moving as they try to interact. But the less considered is that continued movement of the page appears to customers as perceived slowness.
What to consider: CLS is not a standard metric about performance but more a user experience metric to understand the stability of the page for our customers. For some pages, the more interaction, the higher the CLS. We expect an inverse relationship where a high CLS means higher conversion in these cases. This is not because a high CLS converts better. This is because a highly engaged customer will tend to have a higher CLS but still convert better than a low-engagement customer. Now imagine what happens when you improve CLS for highly engaged customers!

Definition: Time to Interactive (TTI) looks to quantify the page's interactivity by ensuring that long tasks have stopped. This gives us the guaranteed understanding that the page is fully interactive.
Why it's good: TTI is a good measure to understand that long-running functions are not causing issues for your customers. By reducing the long-running functions on the page, we can improve interactivity.
What to consider: According to the design of Time to Interactive from Google, there must be a five-second quiet window where a long task does not occur. As a result, only customers that have waited on a page for that window will have a reported TTI. Any quick-clicking customers will not have a TTI. Additionally, TTI will not be reported for customers with extremely long functions that get frustrated and leave because the functions never stop before the customer has left. TTI leaves these two blind spots.


Definition: Total Blocking Time is the additive of all blocking tasks. It is, in effect, a simplified version of time to interactive that does not sit on the timeline for page load.
Why it's good: TBT allows us to understand how much of our code blocking the page rendering process. This will also let us see where user interactivity issues happen even after the page has been completed.
What to consider: Like with TTI, there must be a five-second quiet window where a long task does not occur. As a result, only customers that have waited on a page for that window will have a reported TBT. Any quick-clicking customers will not have a TBT. Additionally, TBT will not be reported for customers with extremely long functions that get frustrated and leave because the functions never stop before the customer has left. TBT leaves these two blind spots.
Definition: Time to first byte is the time from the request of the page to the server responding with the first byte.

Why it's good: TTFB allows us to understand the impact backend processing and networking had on our page load. When First Byte is slow, all metrics are linearly just as slow. Such as, in the image above, a first-byte issue created an LCP issue.
What to consider: Troubleshooting a TTFB issue is generally done on the backend or through an APM partner such as Alluvio.

Similar to DEO, our dashboards empower real-time understanding of your business. Several of our built-in dashboards provide granular information about your digital ecosystem.
Using our dashboarding, you can:

1. Select the live lookback.
2. Activate auto-refresh.


3. Select several dashboards for the carousel to cycle through various time intervals.
4. Create a custom dashboard and add custom widgets


The Alluvio portal contains several out of the box dashboards. The preconfigured Site Overview dashboard allows users to analyze business and technical operations in a single view. This will help you quickly identify a correlation to revenue-related technical events. Watching this throughout the day will help to identify important events more efficiently.


With the Synthetic Site Health dashboard, you can ensure that all your measurements are accounted for within a single view. This lets you see availability, errors, and site previews for scripts, tests, and base page SSL. Use this to monitor your synthetics and any issues that require action.


Your Marketing Team has set goals for traffic source and medium. Alluvio’s preconfigured dashboard for Traffic Source and Medium allows real-time insight into the source of your traffic and the success criteria of that traffic.
With this dashboard, you can identify hotspots of traffic and any areas to focus attention on the marketing factors that can influence your business outcomes.


You can also create custom dashboards from an extensive selection of preconfigured and custom widgets. There are countless options to build the perfect dashboard for your specific needs.


With custom widgets, you can harness the power of Alluvio’s data science and turn it into a live dashboard widget.
Any saved analysis from data science can become a widget and imported. You can also create your own directly in the dashboard.


As your operation zeroes in on the optimal custom dashboards for you, best practice is to have a single dashboard administrator that designs and builds custom dashboards. They would then manage and control that dashboard and can share it across the organization. This prevents other users from changing the dashboard and maintains a "source of truth" for that dashboard. Alternatively, anyone may clone a dashboard which will put a copy into another user's dashboards, allowing that user to make changes. Changing the original dashboard will not change cloned dashboards.
• Share – Share your dashboard to everyone but maintain control
• Clone – Copy your dashboard to other users allowing the new user to make it uniquely their own.


Daily – With the Digital Experience Overview (DEO) page, your operation can understand your website’s strengths and weaknesses in a few moments.
DEO is our standard landing page for all accounts. This is only changed if the user chooses to. If you do not land on the DEO, you can update your user preferences or navigate to it via the Alluvio logo or the menu.
At the top of DEO are five index scores customizable to your business. Red Boxes indicate an active alert in that area.


It's best practice to select a benchmark. We recommend 80. Once your baseline is established, you will understand just how successful your site is immediately and at any moment. For example, you'll know that if you score 79 in Business and a 92 in Marketing, a campaign was launched and made a meaningful impact but may not have resulted in the desired business outcome. Select “Show Details” to see a breakdown of each score.

Daily – Continuing with DEO, several widgets are available. Customize your page to your liking. A particularly helpful widget is our Anomaly detection. This will show automatic anomalies that our system detected.


Note: Alerting is covered in another section of this guide.
Below are a few other widgets, as well as many not shown, included in DEO:


• Function Timing
• 3rd Party Activity
• Bottom of the Funnel
• Campaigns
• Perf by Geography
• Conversion Rate by Device

• CSP Violations
• Traffic Medium
• Domain Approval
• Performance Breakdown


Daily – Ensure your performance budgets are in line. Best practice is to create an independent performance budget for each primary page type and one global.
Set your targets for each page and grouping.

cards per alignment with metrics, including assets. The "good" threshold should be updated each quarter as your team improves.
success daily. An example is provided below.

Daily – You should seek to complete your own customers' journey on your live site.
Feel their pain; feel their joy.
At Alluvio, we only allow the portal for our customer-facing associates. This allows our customer success team to understand exactly what it is like to use the portal, how to improve what is in the portal, and what we need to add. You have access to the same resources that we have access to.
Apply a similar concept to your business. No matter what business you are in, complete the journeys that your customers need to complete. Base this off the top journeys in Customer Journey Analysis. Interact with features and functionality as your customers would.
Here's an example of a top journey to follow on your live site:

o Check DEO for Scores. Investigate if any score is over 85 or under 75
o If needed, are scores over 85 or under 75 explainable? If yes, inform leadership. If no, escalate to further understand the issue and inform leadership once understood.
o No current DEO Anomalies
o Synthetic Error state tracking all tests green
o Check Performance Budgets for everything green. Are all non-greens expected with a plan to improve?
o Check your favorite dashboards. Leave dashboards on your screen throughout the day for passive monitoring.
o Complete your customer's journey on your live site. Create tickets for any repeatable paint points.

Weekly – An organization driven by operational excellence will have a complete understanding of tech stack and its impact on new business opportunities. Focusing on the top revenue opportunity generating pages will ensure that your team prioritizes the most significant parts of your website.
With slow page revenue opportunity, you achieve two goals:
1. Showing where your customers are demanding faster pages.

2. Identifying the most opportune areas to improve.
With the slow page revenue opportunity, you can identify the most critical pages to focus on and prioritize those pages before you start your performance initiatives. In the example above, we have a significant opportunity for checkout, category, search, PDP, and my bag. Those are the pages we need to focus on.
Note: For non-revenue focused websites, you can turn this feature into an outcomebased journey. For example, if the goal of a non-profit organization is to drive more users to sign up for a newsletter, you can set a conversion event on the newsletter sign-up. The opportunity page would reflect areas of the website that you could improve for greater newsletter sign-up conversions.

Weekly – In order to continuously optimize the customer experience, every week you should isolate the broken links causing the most significant loss in revenue. Then, leverage that information to repair those links, update the resulting URLs, or build redirects to allow customers to continue a frictionless journey.
With broken link revenue opportunity, you achieve two goals.

1. Showing where your customers are demanding functional page destinations.
2. Identifying the most critical pages and referrers to repair.
By setting "serious shopper" criteria, don't impact the revenue loss prediction. Here, serious shoppers convert at less than half the rate when they hit a broken link.

Now that we have identified the opportunity, we can determine which links are the most common to cause the revenue loss. Once we have identified that page and the referrer, we can target the remediation appropriately.
For high volume broken links that:

• Have an internal referrer: Identify the link's location on the referring pagerepair it.
• Have an external or no referrer: Add a redirect to a similar destination page

• Do not appear as broken on direct nav: Look to understand page naming rules of a 404 and how it can be served. Misidentifying the 404 or CDN error handling will likely impact proper page naming/URL capture.
Note: Broken links can be caused by the user, which can result in lower conversion. In this case, we are at the mercy that the user uses their browser as intended. Low volume broken links can be ignored and impact the revenue model slightly.


Weekly – An organization obsessed with continuously improving the customer experience will isolate the impact out-of-stocks have on its business each week. The Out-of-Stock Revenue Opportunity Page quantifies its impact.


This gives your team the necessary data to understand the value of improving inventory, additional strategies to keep consumers shopping on your website when faced with out-of-stocks, and the information needed to remove outdated product listings from being searched on your website.
Similar to broken links, we apply serious shopper rules to the model to allow you know how out-of-stock is affecting your most vital customers.


The Executive KPI Report can be utilized for a quick, week-over-week snapshot of performance trends and to check that weekly deployments are causing an unintended impact.

Once you have your selected metrics (up to six), you will be able to understand the percentages of each metric and the experience your customers receive. You can also see trends, such as below, both in aggregate, for a defined performance path, or globally. This helps pinpoint the paths that could be causing performance degradation.

Weekly – There are several ways to approach reviewing monthly trends. The best, however, is decide on a defined monthly das hboard. This same dashboard will also be used for Quarterly Reviews.

An excellent approach is to use Site Overview dashboard. Set it to a 30 -day lookback to mitigate performance creep.


Performance Creep is the iterative degradation that feels trivial until it is added up deployment over deployment.
You can also build a custom dashboard with the 'Performance' widget, as well as 'Revenue over Time.' This will allow you to apply filters to the same widgets to assess your business model appropriately. Below, you may also open custom views, such as overlaying LCP and JS errors.

Weekly – It is important to understand all the deployments that have occurred weekover-week. It is recommended, with the Revenue Calculator, to compare the conversion curves and session distributions.
By doing this, you can isolate markets influence on your deployments. Here we see an example where demand increased, but volume decreased. This means our products are performing better than before, but marketing influence are driving less traffic. Performance is constant.


Quarterly –Like the weekly task of checking monthly charts, an excellent operation should use a yearly lookback for trends to understand performance. This can be the same dashboard you use for weekly reviews.
An excellent approach is to use the Site Overview dashboard and set it for a 30-day lookback. This will help mitigate performance creep.
Performance Creep - The iterative degradation that feels trivial until it is added up to deployment

This should be repeated for each team and the ownership of each page type.
For customized, build a custom dashboard with the 'Performance' widget. As well as 'Revenue over Time.' This will allow you to apply filters to the same widgets to hit your business model appropriately. Below, you may also open custom views, such as overlaying LCP and JS errors.


This section of the document will help to operationalize excellent alerting. For a general how-to on alert setup, please visit help.bluetriangle.com.
No matter what alerting tool you use, we will work to help turn that into the most effective in its class.
The most critical aspect of effective alerting is to have a consistent delivery of alerts and a coordinated response mechanism. If your entire team reacts to the same alert and duplicates work, your alerting has created significant churn in the workflow. Reducing churn is the key to success in operational alerting. Churn is defined as cycles of unneeded repetitive work and can appear in several ways during a disorganized alerting strategy, which will plague the operational effectiveness of alerting. Through automation and organization, we can reduce churn in alerting.

With Alluvio, there are many alerting options available to you depending on your needs, such as team structure, most critical pages, and more. You should configure alerts to align with your business and your dedicated Customer Success Team.


Once your organization has decided on metrics to target, best practice is to then take the synthetics created to ensure all pages have appropriate alerts for their baseline. This can also be based on performance budget thresholds.

For Real User alerting, you will want to ensure that you are capturing an alert all major customer journey steps for page views, performance, and targeted metrics. You will also want global alerts for revenue and conversion.
Additionally, you should create uptime alerts based on high-frequency API checks. This will alert your for major and minor outages immediately to begin triage.


Synthetic Alerts and Real User Alerts should be used as part of your robust alerting strategy. Synthetic provides technical-rich alerts, while Real User provides alerts impacting actual customers’ journey.

• Ensure to include targeted page names. This will provide a granular understanding of what is alerting.
• Lower synthetic volume will increase the frequency of outliers, increasing the synthetic test volume. The sample of the alert will help to address this without under-tuning the alert.
Real User Tips:
• Operational Variance on Real User is higher than Synthetic This is due to diversity of device, network conditions,

• the region, etc.
• Specified Value is often easier to manage than Percent Changed
• Include business metrics as a directional understanding of how technical factors alert the business.
• Include positive business alerts as well.
Alert burnout comes from having too many alerts, alerts that are frequently false positives due to targeting low-value areas. If you hear from your team or feel yourself rolling your eyes at alerts, you are experiencing alert burnout.

The cure is adjusting the alerts and the alert response mechanism. This can be done in many ways, such as PagerDuty, Slack, Teams, and VictorOps.


These mechanisms will also help to improve the common blunder of operations. Everyone sees the alert and assumes that someone else will pick it up, resulting in no one picking it up.

Defining different alert levels helps to ensure that alerts are responded to in a timely and complete way. Tools such as Pagerduty and VictorOps help make the escalation process smoother. However, setting the expectation is what makes the process effective.'
1. Build an Alerting Matrix for L1 to Reference

2. Build an Alert Response Log for historical understanding
Within your organization, you will want to appropriately set up the expectation of L1. This team is dedicated to answering the initial alerts and solving them based on an expected alert handling matrix. When they cannot, they escalate to L2, which will now handle the more unique issues and make a matrix entry to account for them. L3 reviews the alert response log with the intent to be able to improve the systems and reduce the alert frequency.


To set up an alert matrix, look at all configured alerts and create a page or shared spreadsheet. Once there, include the alert name and the action to take when that alert arrives.
For an alert log - create a similar page or document to the matrix. This should include the time alert fired, alert name, action taken if it was resolved, when the action was taken, and the time it was resolved.
Note: The reason to track "action taken" is because of the team's goal and the alert ty pe. For instance, if the alert action is to notify the product team that conversion dropp ed after the deployment, then the action taken time should be focused on the team re sponsible for the alert rather then the resolution of the conversion drop.


Every alert is actionable. As you are investigating an alert, if you find that the alert did not indicate a significant issue to resolve, the action is to tune the alert.
However, your team adjusting alerts to make them appear less frequently for the sake of doing so. This will reduce the value of the alerts.


Below is an example workflow of how a product operations team may integrate with IT Operations on-site alerts. This is not one size fits all, however is an excellent way to base your alert flow.

When it comes to alerting and triage, mitigation is the name of the game.
MTTR – Mean Time to Resolve
MTTD – Mean Time to Detect
Reducing MTTD will reduce MTTR: Through robust alerting, you can uncover issues the moment they occur, allowing your teams the insights needed for a timely resolution.
MTTR and MTTD serve as KPIs that will help you to identify where bottlenecks exist in your response and triage. These will also indicate areas of improvement for your workflow and highlight the need for training. Several alert handling tools like PagerDuty are built to report on this.
Furthermore, alert configurations allow you to see when an alert clears. This will enable you to see the MTTR of any specific alert. In the example below, we see a five-minute MTTR.


The most important success criteria for successful Tag Governance is diverse company representation with a vested interest. Identify a member from the following teams to attend a regular meeting to discuss tag implementation requests and changes.
• Engineering
• Product/eCommerce

• Marketing preferably Advertising
• Analytics/Tag Manager team – This May overlap with Engineering depending on your company structure.
The purpose of this committee is to have regular alignment on the approved tags and what is being implemented. This will also empower tag audits to ensure tags that are no longer being used are properly removed.

Within Tag Governance, there are several areas on which to focus.
• Service Profile
• Service Details
• Domain Details

• Domain Trends
• SLA Status
• SLA Thresholds
• Hierarchy
• Inventory Analysis
• Domain Baseline Analysis
• Missing Services
Using these modules, you can understand your website’s tag ecosystem. As you collaborate with your internal team, Alluvio will help provide oversight to ensure all third-parties remain in a healthy state without compromising the customer experience.


Through Service Profiles, you can more effectively monitor the third-parties on your site. This enables you to set up SLAs, approve and decline which third-parties should appear, and even implement a Content Security Policy (CSP) seamlessly. For further instruction, visit: help-uji.aternity.com/hc.
Organizations that excel at continuous experience optimization will approve all expected domains and decline any that should not be allowed on-site. This allows you to generate a CSP and even automate CSP deployments through the Alluvio API.


With Service Level Agreements (SLAs) in place, you will be alerted to violations. You will also be able to set up more aggressive targets (Service Level Objectives, or SLOs) through the same configuration. For further instruction, visit: helpuji.aternity.com/hc.
Setting up SLAs for all services will ensure that alerts are served for domainspecific events. This can and should be applied to first-party content as well.


Once Tag Governance has been fully configured, the service profiles and approved domain list become an easily generated CSP.


You can configure several CSPs for independent teams or parts of your site. Once generated, you can use Alluvio's API to update your CSP automatically. Updates to the CSP are also easily performed through Approving Domains and the CSP Manager.

With Cost of a Tag analysis, you will now be able to quantify the performance and revenue impact associated with any specific tag or groups of tags. You can execute a directional AB test by combining Real User and Synthetic Monitoring to understand how costly tags are (or aren't!).
Here we see the analysis for bluetriangle.com and the revenue associated with the tags and their slowdown.

