TOP POSTS OF 2020: Sales Outpacing Starts by an Historic Margin
W
BY ROBERT DIETZ
ith the end of 2020 approaching and a vaccine now
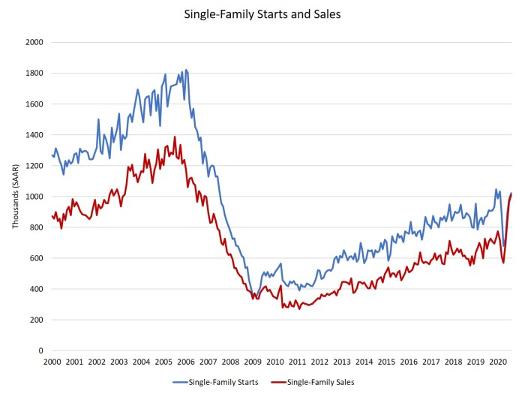
being deployed, NAHB’s Eye on Housing is reviewing the posts that attracted the most readers over the past, dramatic year — a year that saw housing emerge as a bright spot for an economy under stress. In October, the NAHB Economics team produced a new estimated data series for single-family for-sale housing starts, showing that the gap between sales and construction was the largest on record. This gap suggests a slowing of sales and ongoing construction growth to reduce backlog as we enter 2021. After a sharp decline in the spring, home building has staged a dramatic rebound. In fact, supported by low mortgage rates, an evolving geography of housing preferences, and favorable demographic tailwinds, housing demand has improved so quickly that the current difference between the pace of newly-built single-family home sales and for-sale single-family construction starts has reached a historic level. The fact that sales are outpacing construction starts to
The consequences of the virus-induced 2020 downturn (the Great
this degree indicates additional home building lies ahead.
Disruption?) are seen clearly at the end of the graph, particularly the
The following graph shows the benchmark Census measures of home
staged impressive rebounds, the sales measure has completely closed
V-shaped nature of the impact on housing. While both measures have
construction, the seasonally adjusted annual rates of single-family starts and single-family home sales. Starts account for the beginning of construction of homes, whether that construction is for a home already under a sales contract, being built for-sale, being built forrent, or undertaken for a construction contract (a custom build on an owner’s lot). New home sales are signed sales contracts for new builds, whether that home has started or completed construction (new home sales is thus a counterpart to the NAR pending sales index,
the gap between the two series. However, the actual effect is larger. For an apples-to-apples comparison of the rates of for-sale construction and new home sales, we need to filter the starts series to remove custom builds and builtfor-rent single-family construction. Using Census quarterly data of these construction types, I interpolated the quarterly data into monthly, seasonally adjusted data and then subtracted this new series from the
rather than existing home sales, which account for closed contracts).
existing Census data series. The new data series, single-family for-sale
The reason that starts outpace sales on the chart below is because,
the for-sale sector relative to sales, as graphed below.
starts, allows for a precise comparison of the pace of home building in
as noted above, starts represent all home builds. Thus, while the measure of new home sales represents only the more narrow forsale class, housing starts also include custom builds and built-for-rent construction.
page 60
www.ncbia.com
Dec-Jan 2021