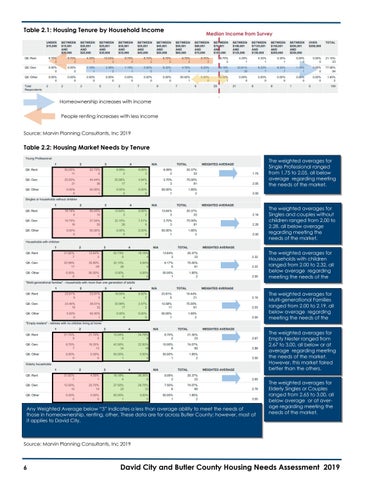
Table 2.1: Housing Tenure by Household Income
Median Income from Survey
Homeownership increases with income People renting increases with less income Source: Marvin Planning Consultants, Inc 2019
Table 2.2: Housing Market Needs by Tenure The weighted averages for Single Professional ranged from 1.75 to 2.05, all below average regarding meeting the needs of the market.
The weighted averages for Singles and couples without children ranged from 2.00 to 2.28, all below average regarding meeting the needs of the market. The weighted averages for Households with children ranged from 2.00 to 2.32, all below average regarding meeting the needs of the The weighted averages for Multi-generational Families ranged from 2.00 to 2.19, all below average regarding meeting the needs of the The weighted averages for Empty Nester ranged from 2.67 to 3.00, all below or at average regarding meeting the needs of the market. However, this market faired better than the others.
Any Weighted Average below “3” indicates a less than average ability to meet the needs of those in homeownership, renting, other. These data are for across Butler County; however, most of it applies to David City.
The weighted averages for Elderly Singles or Couples ranged from 2.65 to 3.00, all below average or at average regarding meeting the needs of the market.
Source: Marvin Planning Consultants, Inc 2019
6
David City and Butler County Housing Needs Assessment 2019


