1 minute read
David City/Butler County Recommendations


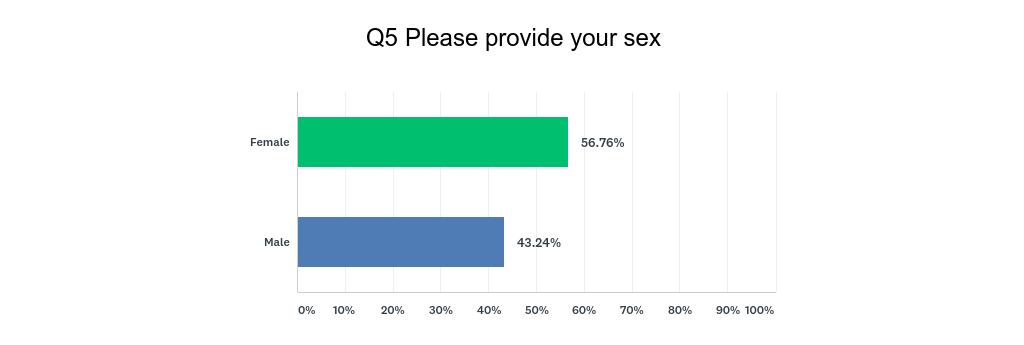
Figure 2.4 Sex Breakdown of Respondents
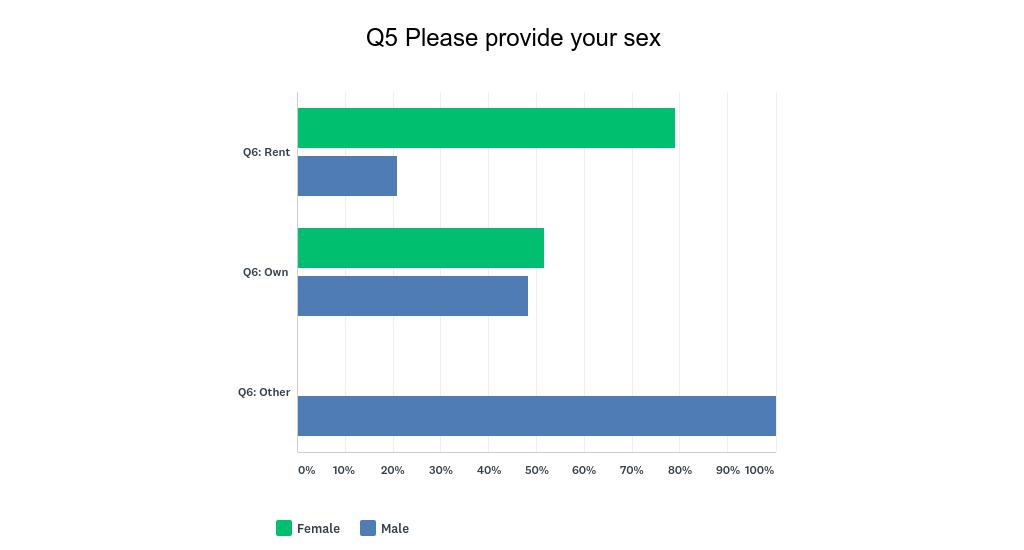
Figure 2.6 Ownership/Rental by Sex
Source: Marvin Planning Consultants, Inc 2019
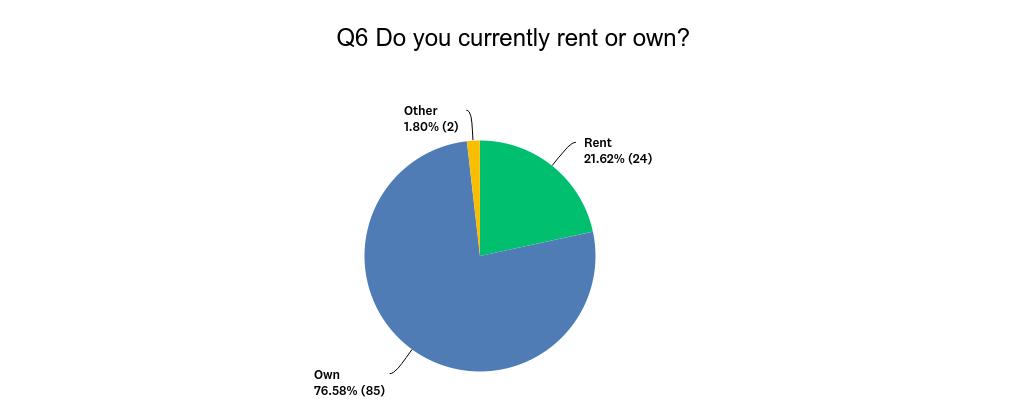
Rent versus Ownership
Respondents were asked to identify if they rented or owned their place of residence. In addition, if for some reason, neither of those applied “Other” and what “other” meant. Overall, 24 (21.62%) rented their residence and 85 (76.58%) owned their place of residence. However, 2 (1.80%) did identify other.
Figure 2.5 Ownership versus Rental
Source: Marvin Planning Consultants, Inc 2018, SurveyMonkey
Comparing rental properties to overall household income provides interesting results as well. Table 2.1 indicates 5 (21.75%) rented and have a total household income of under $25,000 per year; moreover, 10 (43.49%) have a household income of $35,000 or less.
Regarding home ownership, 1 (1.19%) indicating homeownership had a household income of less than $25,000. On the top end, 57 (67.85%) of those indicating homeownership had a household income greater than $75,000 annually.
Source: Marvin Planning Consultants, Inc 2019
Cross tabulating the data shows of the 24 respondents indicating they rented, 19 (79.17%) of those were female respondents. However, 44 (51.76%) of the home ownership identified was also by female respondents. Finally, 0 (0.00%) of those responding as “other” were also female respondents.


