
2 minute read
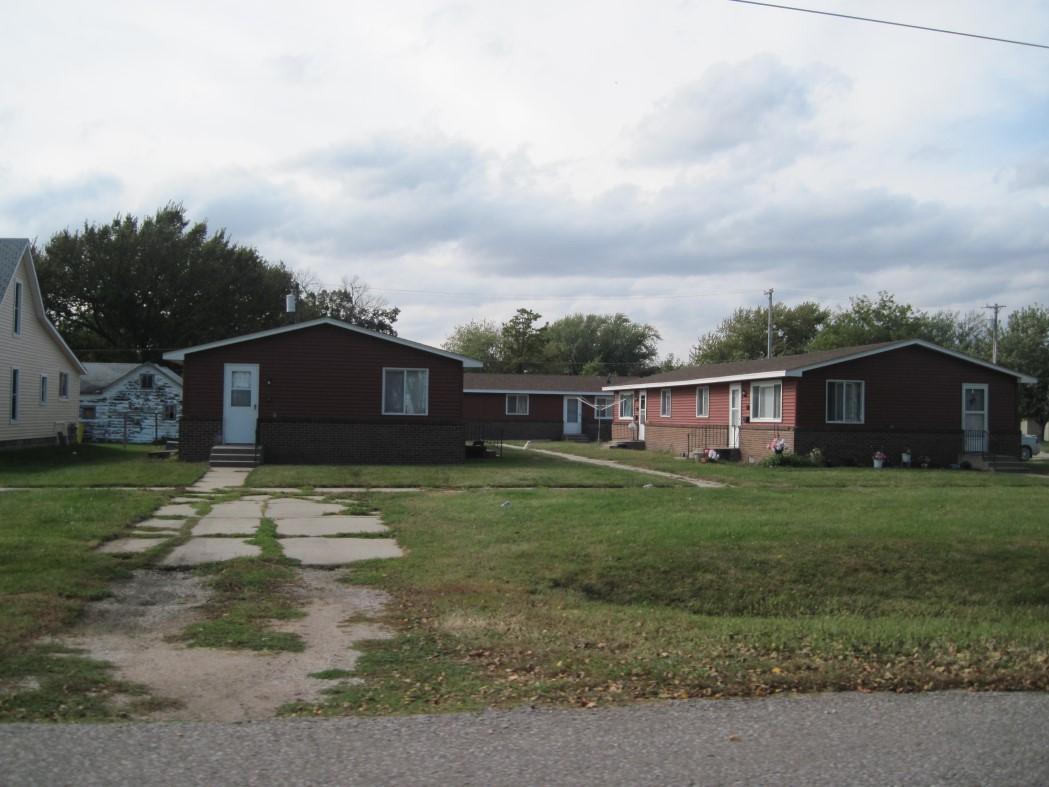
Village of Bellwood


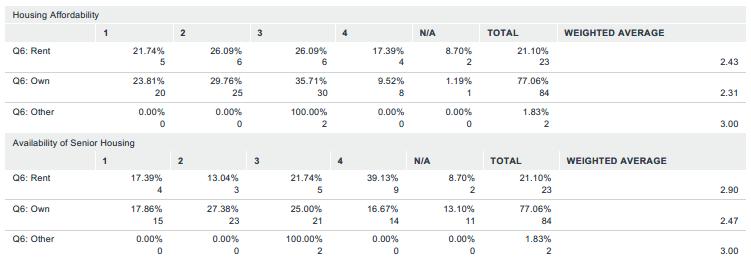


Any Weighted Average below “3” indicates a less than average ability to meet the needs of those in homeownership, renting, other. These data are for across Butler County; however, most of it applies to David City. Both renters and homeowners rate Housing Affordability as Low. Overall, 52.8% of the respondents rated affordability as low.
Renters are slightly more positive than homeowners regarding the availability of Senior Housing in Butler County.
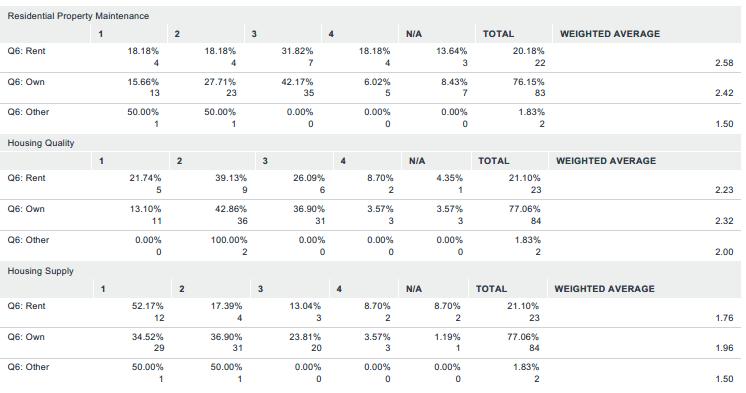
36.4% of renters rated Residential Property Maintenance as a 1 or 2 (Below Average); while, 47.4of homeowners felt it was an issue in Butler County
60.9% of renters felt housing quality was below average, the weighted average was 2.23. 56.0% of homeowners agreed with a weighted average of 2.32.
Nearly 70% of renters felt the housing supply was below average, the weighted average was 1.76. In addition, over 70% of homeowners felt the same way. The homeowner weighted average was 1.96.
Source: Marvin Planning Consultants, Inc 2019
Question 13 of the survey asked the respondents to rank the items in Table 2.2 from “1” to “4” with “1” being low and “4” being high. As they answered these questions, the survey generated a weighted average; therefore, anything below a “3” on the weighted average meant there was a need for that particular type of housing. None of the responses received a “3” or better on the weighted average. The best weighted average came from those owning their home and rating “Empty-nesters” which received a 2.88. Therefore, there is at least a perceived need or demand for each of the housing types listed in Table 2.2.
Question 14 and its responses are found in Table 2.3 above. The question asked takers to rate on a scale of “1” to “4” specific housing topics such as affordability, Availability of Senior Housing, etc. Again, “1” was low and “4” was high. Similar to Table 2.2, the results were calculated into a weighted average with anything below a “3” being in need. None of the topics received a weighted average of “3” or more. Housing supply had the worst weighted average with a 1.76 and 1.96 from renters and homeowners respectively; housing quality was also an issue with averages of 2.23 and 2.32 respectively.
Question 18 of the survey asked respondents “How satisfied are you with where you live?” The answers are in Table 2.3 which indicates over 56% of the renters answering this question were either Somewhat Satisfied or Not Satisfied. However, 75% of the homeowners answering were either Satisfied or Very Satisfied with their housing. This is a normal and expected response by the different groups.


