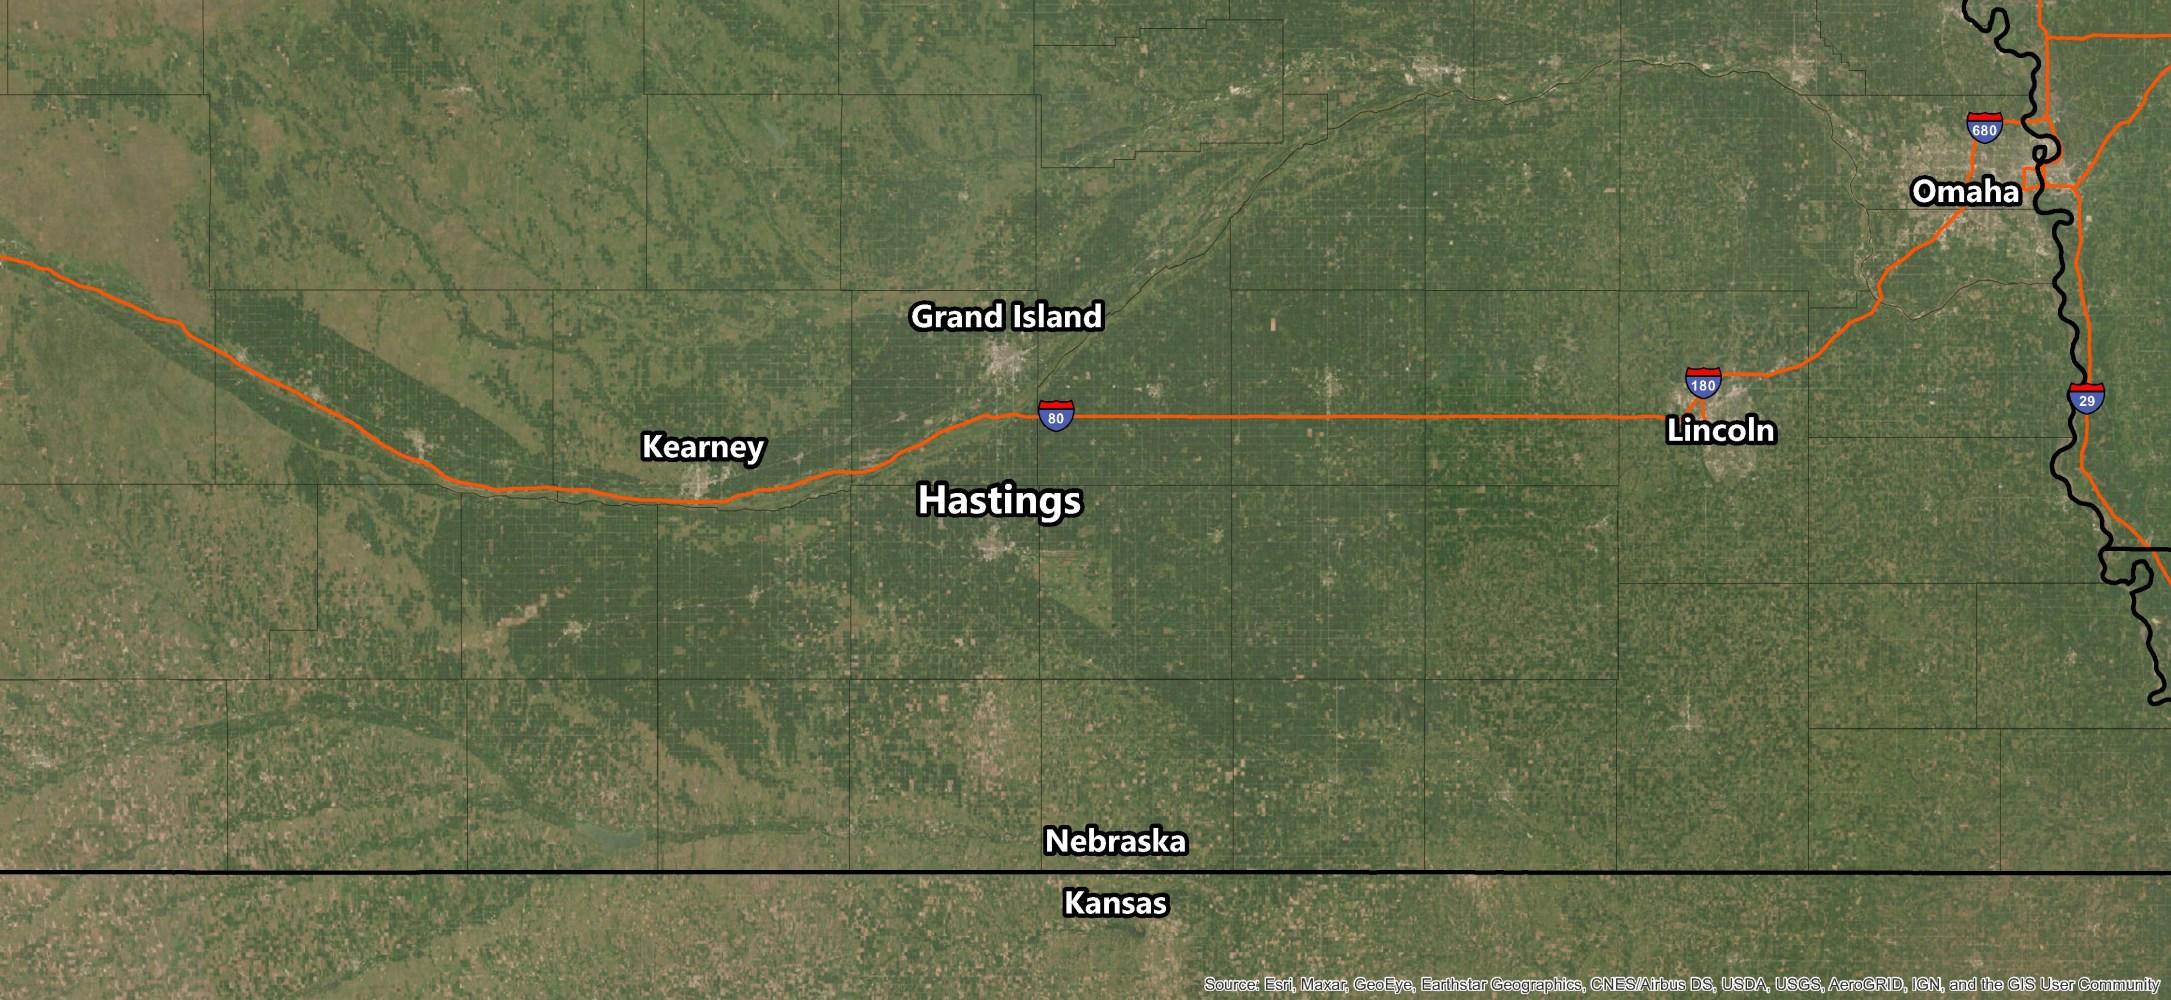
Hastings is located in south central Nebraska, 10 minutes south of Interstate 80. Highways 6,281,and 34 transverse the city. The latter two connect Hastings toInterstate80.Hastingsispartof the “Tri-Cities” area (Hastings, Kearney, and Grand Island) of Nebraska.
History
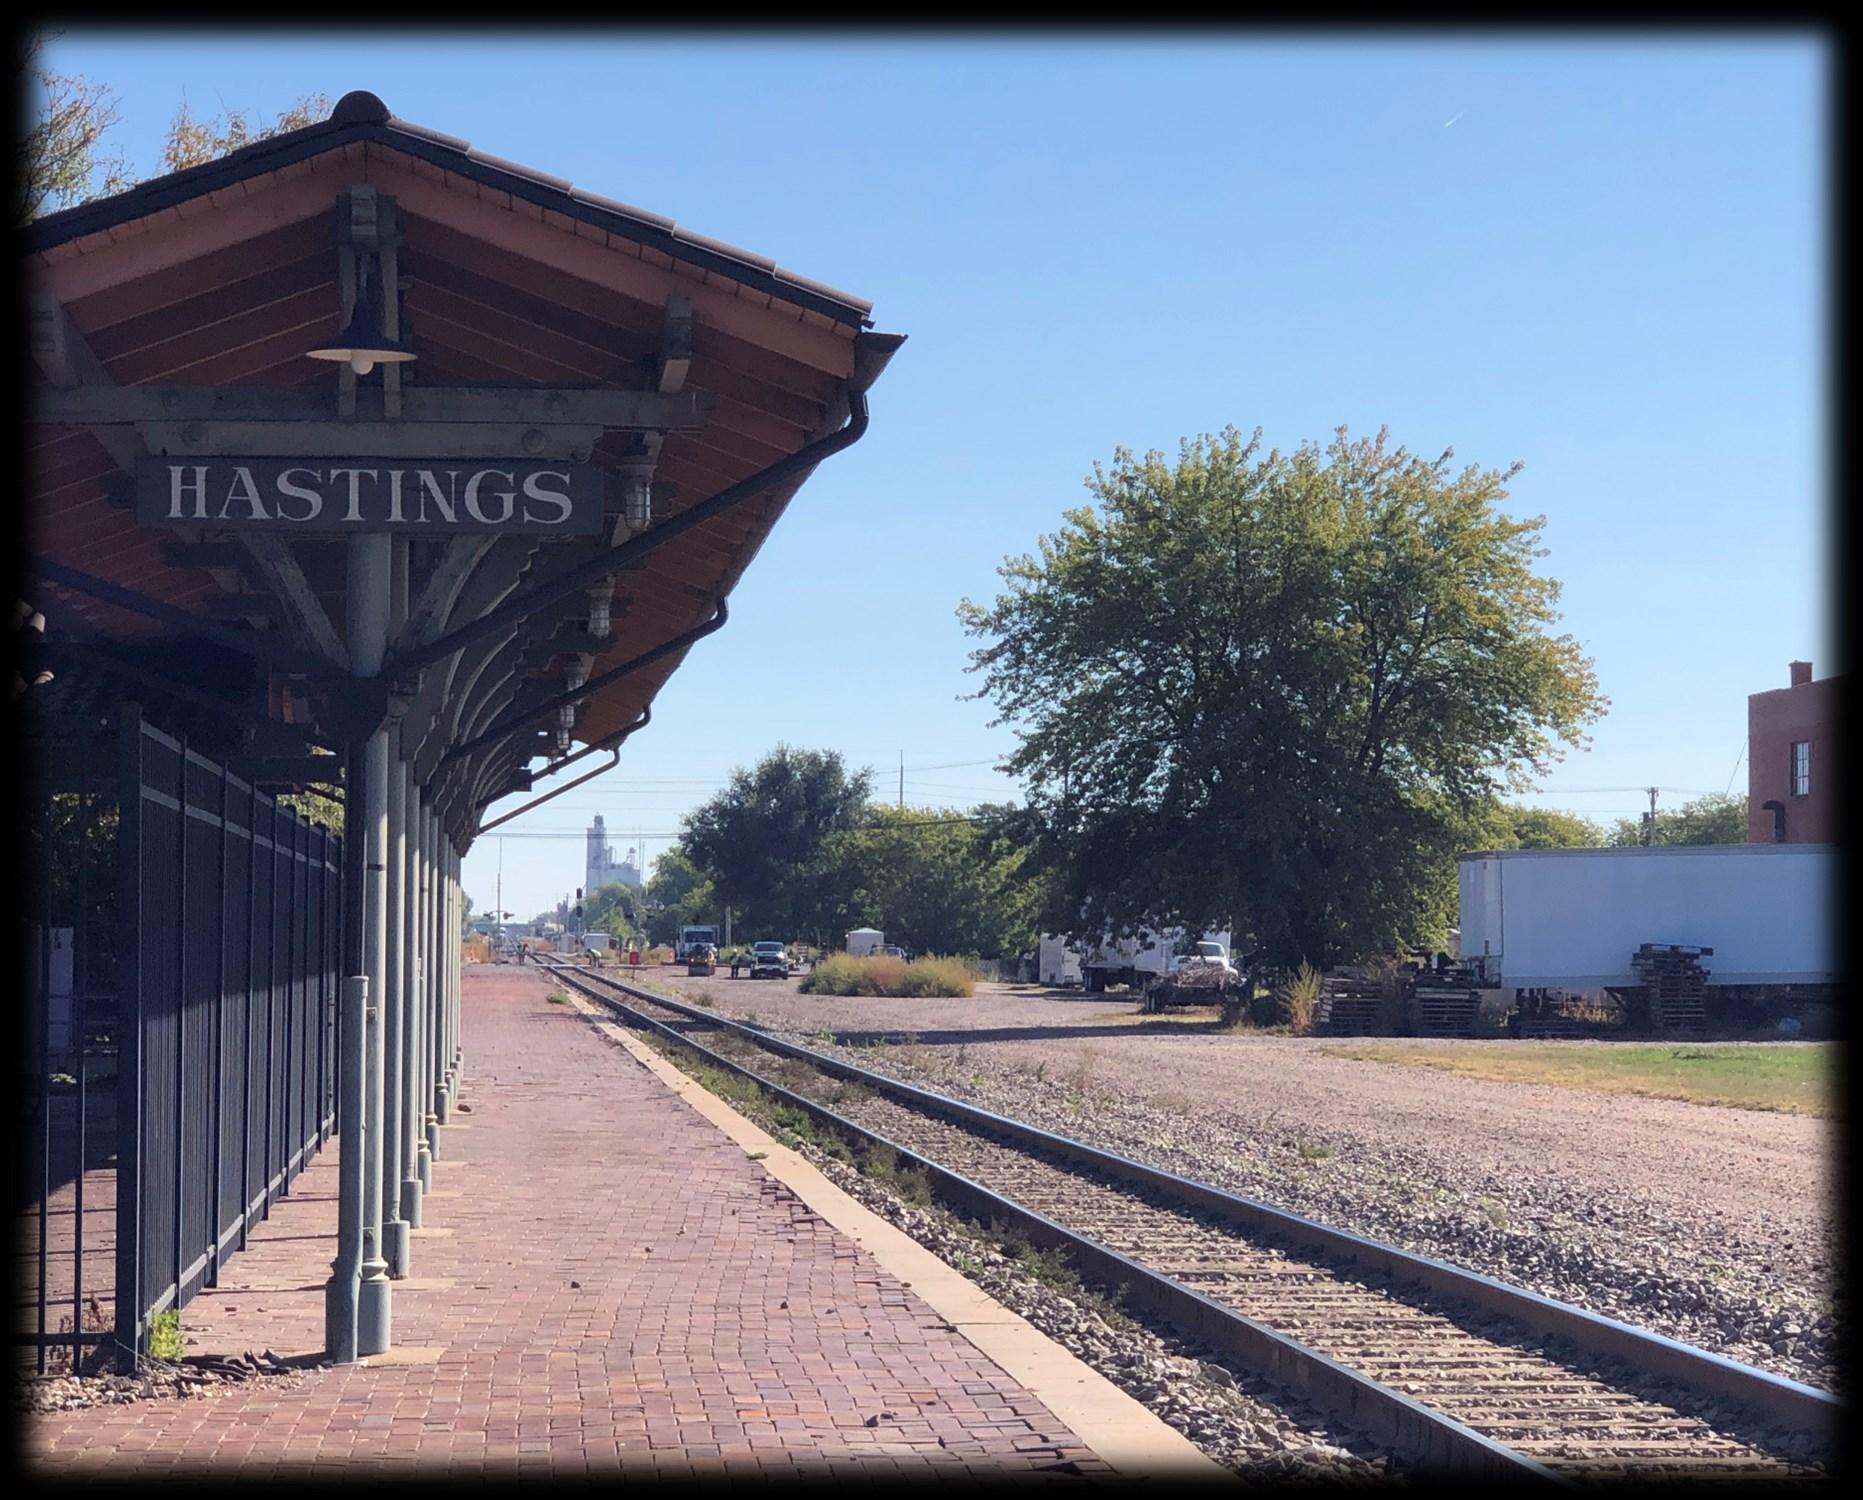
WiththepromiseoftheNebraska prairie in front of them, English settlers from Lincoln first settled in theareain1871.Thefirsthouse,a sod dugout, was built at the cornerofwhatisnowThirdStand Lincoln Ave. More houses and a general store soon followed, with the city being founded soon after in 1872. The same year, the St. Joseph and Denver City Railroad agreed to build a line south of the fledgling town, crossing the Burlington line. Hastings was named in honor of Thomas D. Hastings, construction engineer of the St. Joseph and DenverCityRailroad.
The City was incorporated in 1874. Juniata, west of Hastings, was the county seat of Adams County until 1878. For five years, the two towns fought for the county seat, with Hastings winning out because of its locationontherailroads.
The location on the two railroad lines made Hastings grow exponentially, especially after becoming the county seat. Within 10 years of its founding in 1872, Hastings had grown to 3,000 people, with a fledgling Hastings College beginning its first classes. Hastings had become the most important commercial point between LincolnandKearney.
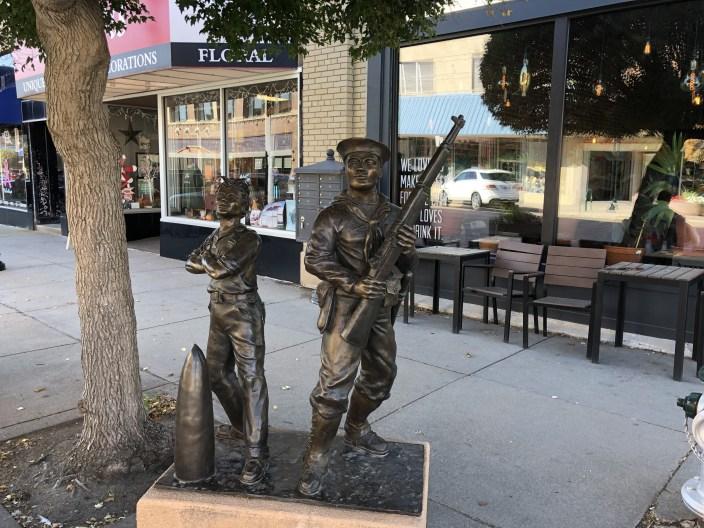
The early 20th century saw Hastings become not only the largest brick producer in the state but also the “cigar-making capital” of Nebraska. Edwin Perkins invented Kool-Aid, the famous colorful soft drink, in downtown Hastings in 1927. The drink is still celebrated annually
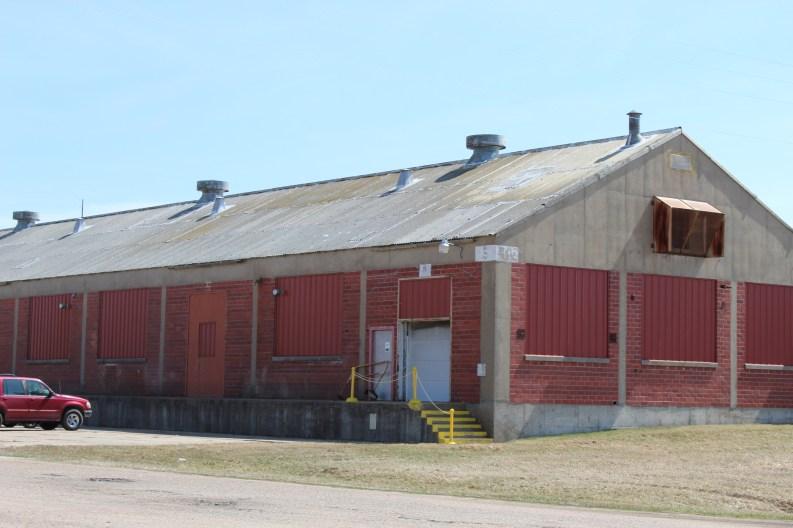
bythecityduringKool-AidDays. ByWorldWar II,thetwoindustries of brick and cigar making were replaced by the Naval Ammunition Depot, which brought in nearly 8,000 people. Built in 1942, the Depot was one offourmajordepotsintheUnited States. The Depot was decommissioned in 1958. Many buildings left behind by the military are now part of Central Community College’s campus andsurroundingindustrialareas.
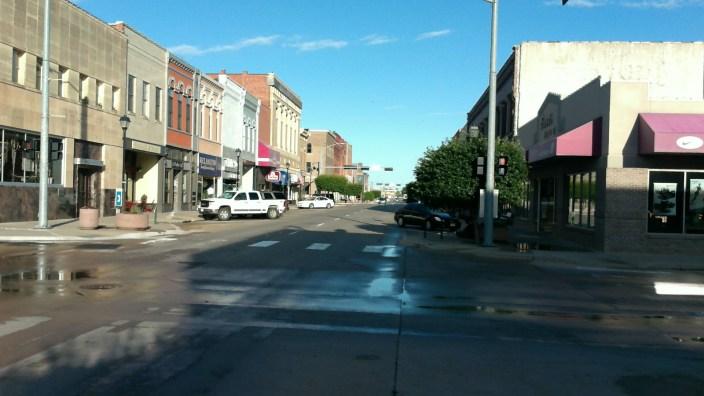
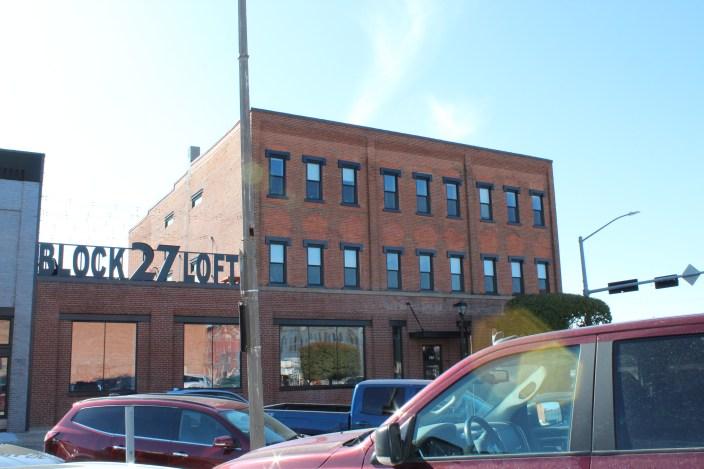
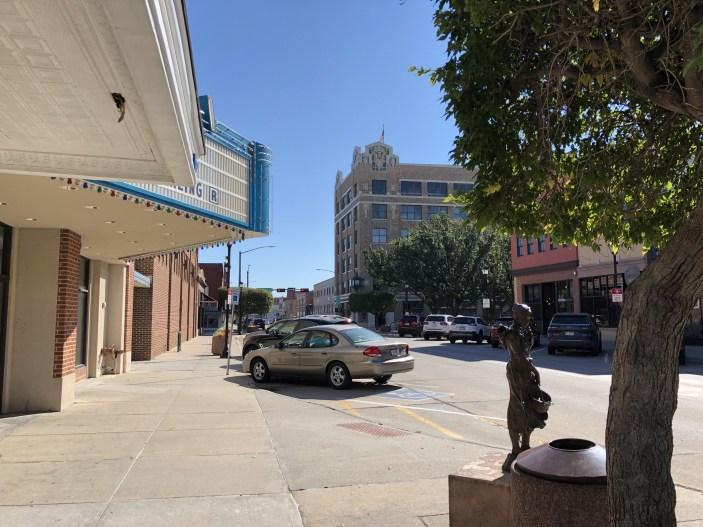
Hastings’rootsarestillseentoday due to historic preservation of its first neighborhoods and the downtown. Visitors to Hastings can enjoy the booming downtown, beautiful parks, and unique events such as Kool-Aid Days. No longer a brick or cigar hub, the city is now driven by its downtown, the local colleges, hospital,andagriculture.
Thisplan is not a static document; it should evolve as changes in the land use,population, or local economy occur during the planningperiod(2025to2045).
The Planning Process
The Comprehensive Plan begins with the development of general goals and actions, based upon current and future issues faced by the community and its residents. These are intended to be practical guidelines for addressing existing conditions andguidingfuturegrowth.
In conjunction with the development of general goals and actions, a data collection phase occurs. Data is collected toprovideasnapshotofthepast andpresentconditionswithinthe community. Analysis of data provides the basis for developing forecasts for future land use demands,aswellasfutureneeds regardinghousingandfacilities.
The Comprehensive Plan is a blueprint designed to identify, assess, and develop actions and policiesinthefollowingareas:
• Housing;
• EconomicDevelopment;
• CommunityFacilities;
• Parks, Recreation, and Attractions;
• PublicSafety;
• UtilitiesandEnergy;
• Hazards;
• LandUse;
• Annexation,and;
• Transportation
The Comprehensive Plan contains recommendations which when implemented will be of value to the community and its residents.Tools, programs, and methods necessary to carry out the recommendations will be identified through the process. Nevertheless,theimplementation of the development policies contained within the plan is dependent upon the adoption of the plan by the governing body and the leadership exercised by the present and future elected and appointed officialsofthecity.
Figure 1.1: Regional Location of Hastings
Source: Marvin Planning Consultants
Plan Preparation
ThePlanwaspreparedunderthe directionoftheHastingsPlanning Commission, with the assistance and participation of the Hastings City Council, City staff, the Plan Review Committee, citizens of Hastings, and those who live elsewherebutworkinorregularly visitthecity.
Thetimeperiodforachievingthe goals, programs, and future developments identified in the Hastings Comprehensive Plan is 20 years. However, the community should review the plan annually and update the document every five years (2030), or when major, unanticipated opportunity arises. Completing updates every five years or so will allow the community to incorporate ideas and developments not known at the time of the present planning process.
Plan Components
Nebraska State Statutes require the inclusion of certain elements in a Comprehensive Plan. A “Comprehensive Development Plan,” as defined in Neb. Rev. Stat. § 19-903 (Reissued 1997), shall include the following elements:
• Land-use;
• Existing and proposed transportationroutes;
• Existing and projected communityfacilities,and;
• Identification of sanitary improvement districts and standards for their annexation
The Comprehensive Plan is written so as to promote the general health, welfare, and safety of the city. Policies in the plan help to accomplish this by
consideringappropriatelanduse decisions, providing adequate services to all citizens, and promote safety from human madeandnaturaldisasters.
Data Analysis
Analyzing past and existing demographic, housing, economic, and social trends allows for the projection of potential conditions in the future. Projections and forecasts are useful tools in planning for the future; however, these tools are not always accurate and may change due to unforeseen factors. In addition, past trends maybe skewed or the data may be inaccurate, creating a distorted picture of past conditions.
Therefore, it is important for Hastings to closely monitor population, housing, and economic conditions impacting the city. Through periodic monitoring, the city can adapt and adjust to changes at the local level. Having the ability to adapt to socio-economic change allows the city to maintain an effective Comprehensive Plan for the future, to enhance the quality of life for its residents, and raise the standardoflivingforallresidents.
Data Variations
In some chapters, American Community Survey (“ACS”) data was used alongside U.S. Census Bureau decennial data during this planning project. ACS data is based upon statistical sampling from the U.S. Census Bureau’s data; therefore, there may be variations in the numbers presentedbasedonthesource.
The COVID-19 pandemic greatly
impacted data collection during the 2020 U.S. Census. As the ACS is based on the U.S. Census, not all data is completely representativeofthecity.
Governmental Organization
The Hastings City Council performs the governmental functions for the city. Pursuant to Neb. Rev. Stat., §16-901, the planning and zoning jurisdiction for the city includes the corporate area as well as the areagenerallywithintwomilesof theircorporatelimits.
Process for Adoption
When it is time to adopt this Comprehensive Development Plan, the City Council has the opportunitytochoosethemeans of adoption. State Statutes allow for the plan to be adopted as either a Resolution or an Ordinance. However, the means used to adopt the plan is the process to be used in the future toamendit.
Adoption of the Comprehensive Development Plan requires both the Planning Commission and CityCouncilholdseparatePublic Hearings. After the Planning Commission Public Hearing, the Planning Commission makes a recommendation to the City Council, who then holds their Public Hearing. Notice of both public hearings is required to be published in the newspaper of general circulation a minimum of 10dayspriortoeachhearing.
Page Intentionally Left Blank
Chapter 2 Community Engagement
Your Hastings Community engagement is vital to a successful planning effort. Public participation makes it possible to have a clearer understanding of how the residents feel regarding their communities. During every planning process, there are limited numbers of individuals concerned about the effort, either because things are going in a good direction or specific issues do not impact them. Regardless, this does not minimize the importance of community engagement. Knowing, recording, and then acknowledging what residents think of their communities makes the comprehensive plan truly a community’s.
Participation Methods
Transparent and frequent public participation was designed as a major component of this plan. The process included multiple approaches. It was structured
in a manner allowing for stakeholders to be involved in numerous ways throughout the process - if stakeholders missed a meeting, they were still able to provide their thoughts and input through other means. The key elements of participation included:
• Aprojectwebsite;
• Postcards;
• Planning team attendance atcommunityevents;
• Interviews with leaders in City government;
• Focusgroups;
• Townhallmeetings;
• An Open House at the conclusionoftheproject;
• Crowdsourcing photography andmapping;
• An online engagement platform;
• MindMixer,and;
• aCitywidesurvey
Project Website
A special project website, “onthehorizonhastings.com”, was
established at the onset of the planning process. The project website served as a means to notify residents about upcoming meetings, inform them on the importance and purpose of comprehensive planning, provide links to input methods, and provide updates on the status of the project. In addition, the Transportation and Parking Master Plan, completed in 2022 by Kimley-Horn, was linked to the website.
Postcards
In order to get the most public participation possible, the planning team developed informational postcards. The postcards led readers to the project website and to the project survey. The postcards were delivered to businesses downtown, convenience stores, senior housing, City Hall, Garage Sale City Wide, and the Public Library. Postcards were also left at every town hall meeting. Hastings Young Professionals, an active youth organization in
Hastings, helped distribute cards aswell.
Event Attendance
Both Kool-Aid Days and the Hastings 150th anniversary celebration bring the entire region together - Kool Aid Days andtheHolidayLightsFestivaldo so annually, while the 150th celebration was for one day only.Forthisreason,the planning team was in attendance at all events. At these events, the planning team had three goals: educate residents on the process, how they can get involved, and gather their input onwhattheythinkofHastings.
Kool-Aid Days
The planning team first attended the famousHastings event in late August of 2022. Event goers were directed to the project website, educated on the planning process, and in some instances interviewed by the planning team. This event was an unofficial beginning tothe public inputprocess.
The planning team then attended Kool-Aid Days in August of 2023 to present the draft of the Future Land Use element of the plan. Feedback was welcomed; the reception wasoverwhelminglypositive.
Holiday Light Festival
At this downtown Hastings celebration, the planning team interviewed eventgoers on what they like and what they dislike about Hastings. Postcards were alsopassedouttoeventgoers.
150th Anniversary Celebration
The planning team set up a booth, in conjunction with the City of Hastings, at this monumental celebration. The
event took place on September 18, 2022. Handouts, including postcards and crowdsourcing maps, were handed out to gather input. Event goers were also asked three simple questions: “What do you like in Hastings?”,“Whatdoyounotlike in Hastings”, and “What are things you want to see?”. The results of these questions were as follows:
Ilike:
• Downtown
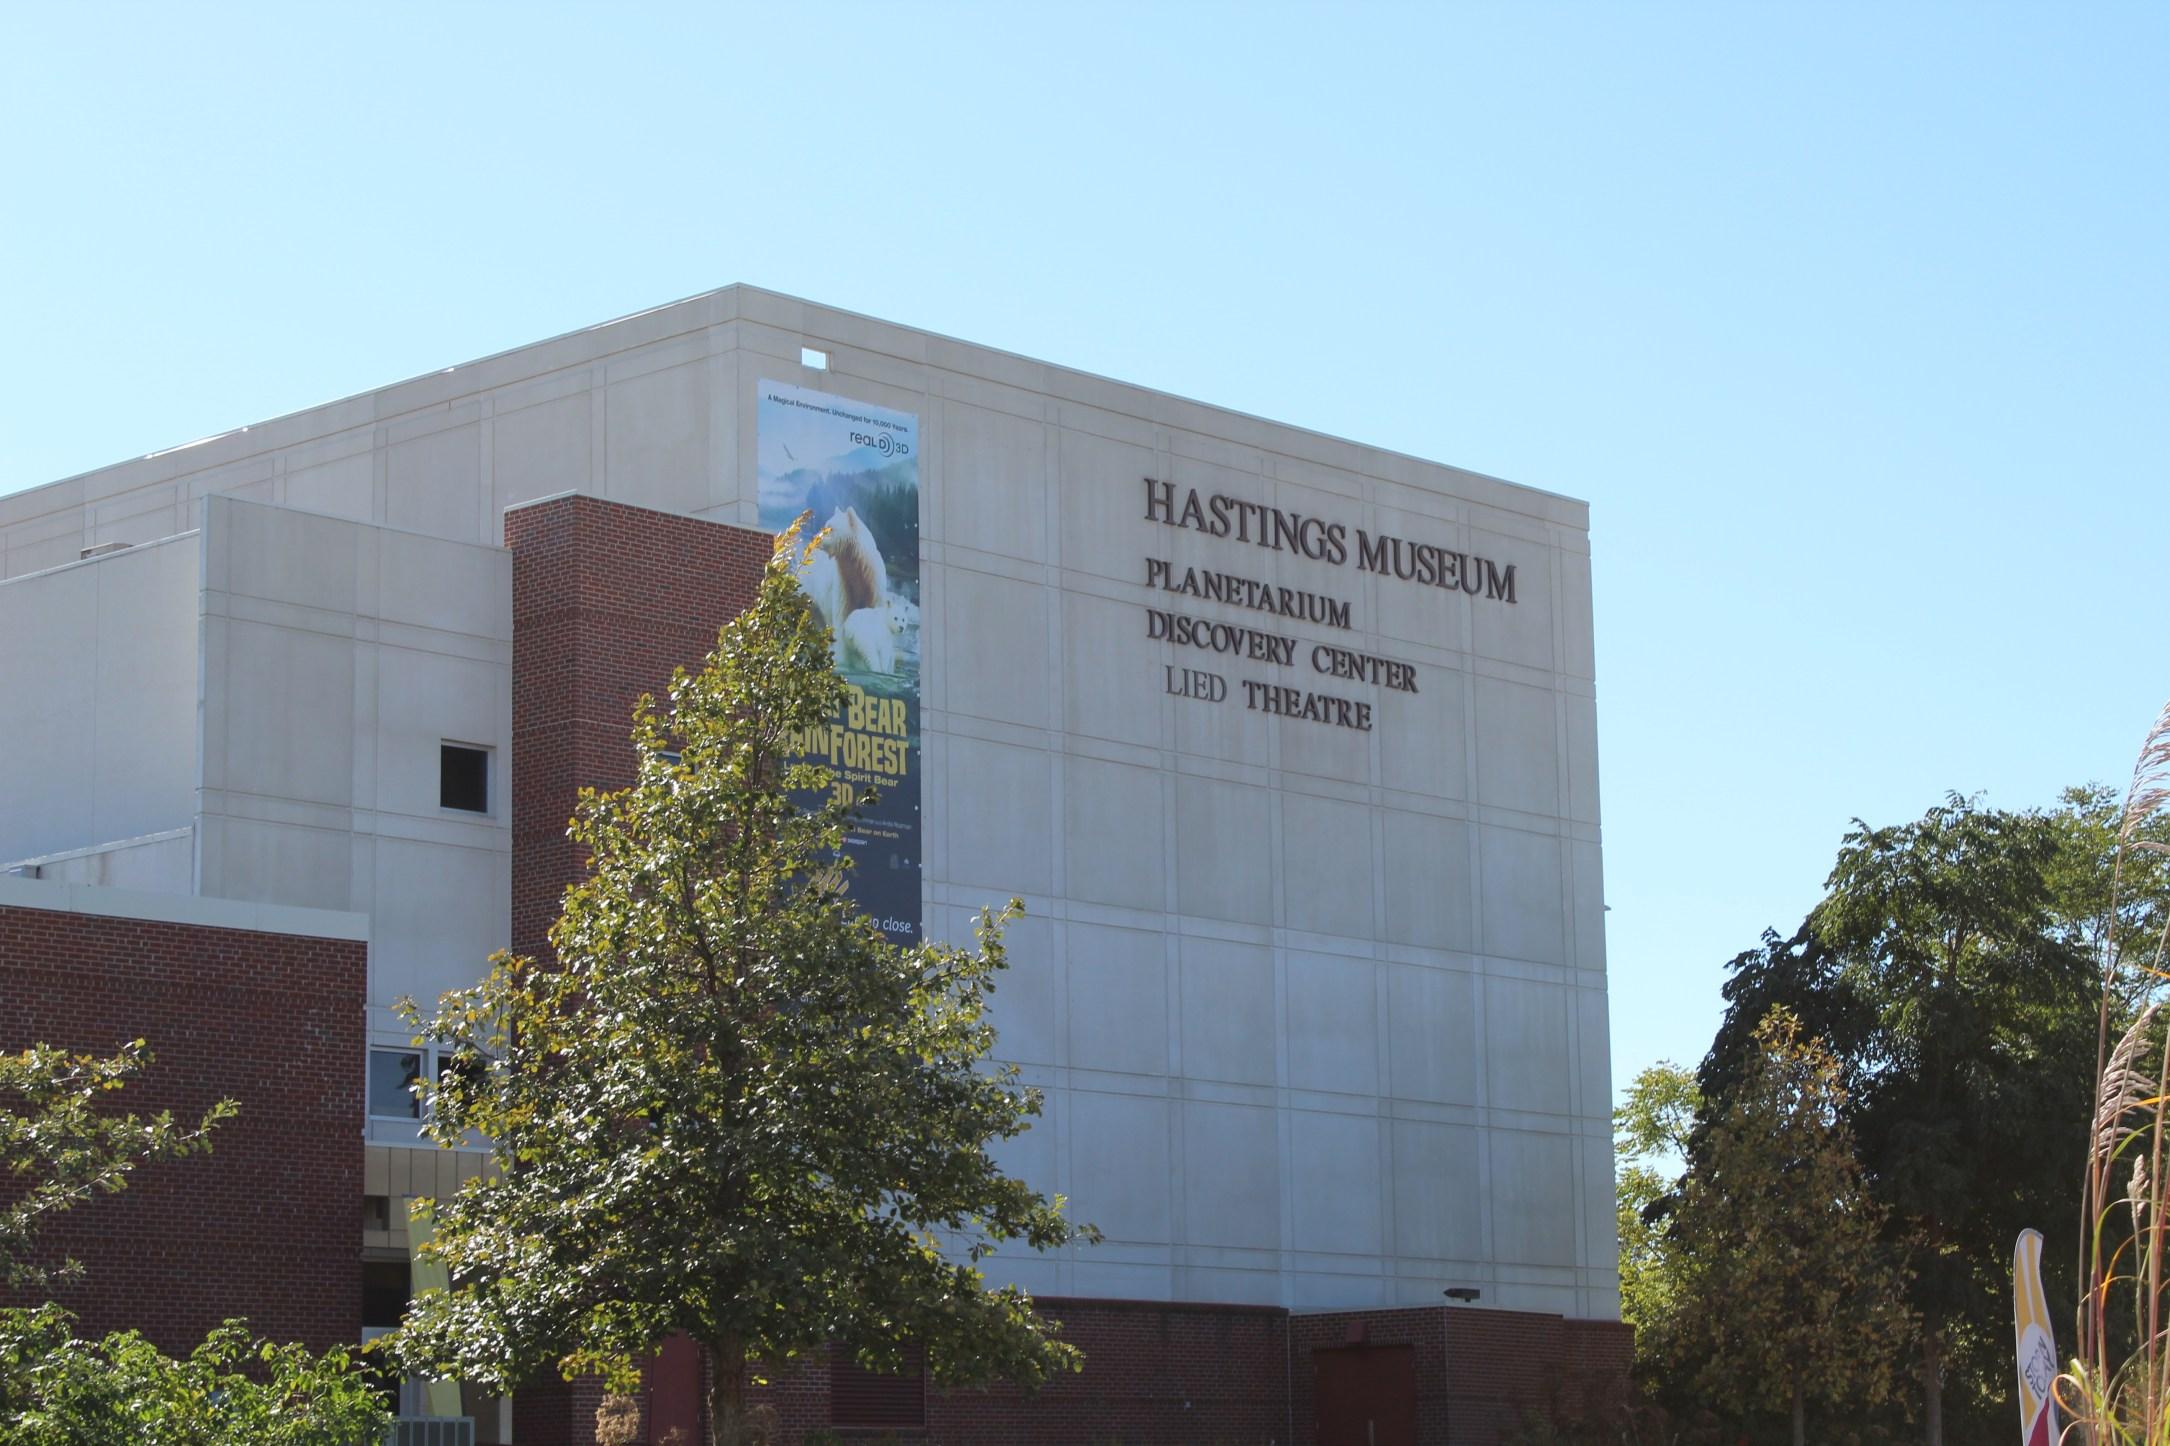
• TheMuseum
Iwanttosee:
• Outdooreventspace
• Moresit-downrestaurants
• Morehealthygroceryoptions
• Safe,affordablehousing
• Moreafterschoolprograms
• Indooreventspacelikethe BigAppleinKearney
• Morehigh-densityhousing
• Pedestrianonlystreets downtown
• Alocalpoliceacademy
• Moretransportationoptions
• Museumexpansion
• Trafficsafetyimprovements
Idon’tlike:
• There is no outdoor recreationinthewinter
• There are not enough things forfamiliestodo
• How unsafe the railroad crossingsare
• When businesses close early downtown
• There is not enough to do for datenight
• The lack of public transportationoptions
• Therentalstock
• The pedestrian crossings in southwestHastings
Interviews with City Leaders
City leadership was interviewed to share how important planning will be for Hastings’ future. Those interviewed included members of the Development Services Department, City Council members, Planning Commission members, the Economic Development Corporation, and the Mayor. Each person was asked “Why Planning is important?” and “What would you like to see in the community?”. These interviews were broadcasted to the public ontheprojectwebsite.
Focus Groups
The planning team interviewed key stakeholders in the community. These groups were chosen due to their involvement in the community now as well as the impact they will have on the future of Hastings. The following groupswereinterviewed:
• Hastings Community Foundation;
• Downtownbusinesses;
• ChamberofCommerce;
• Downtown Business ImprovementDistrict;
• YoungProfessionals;
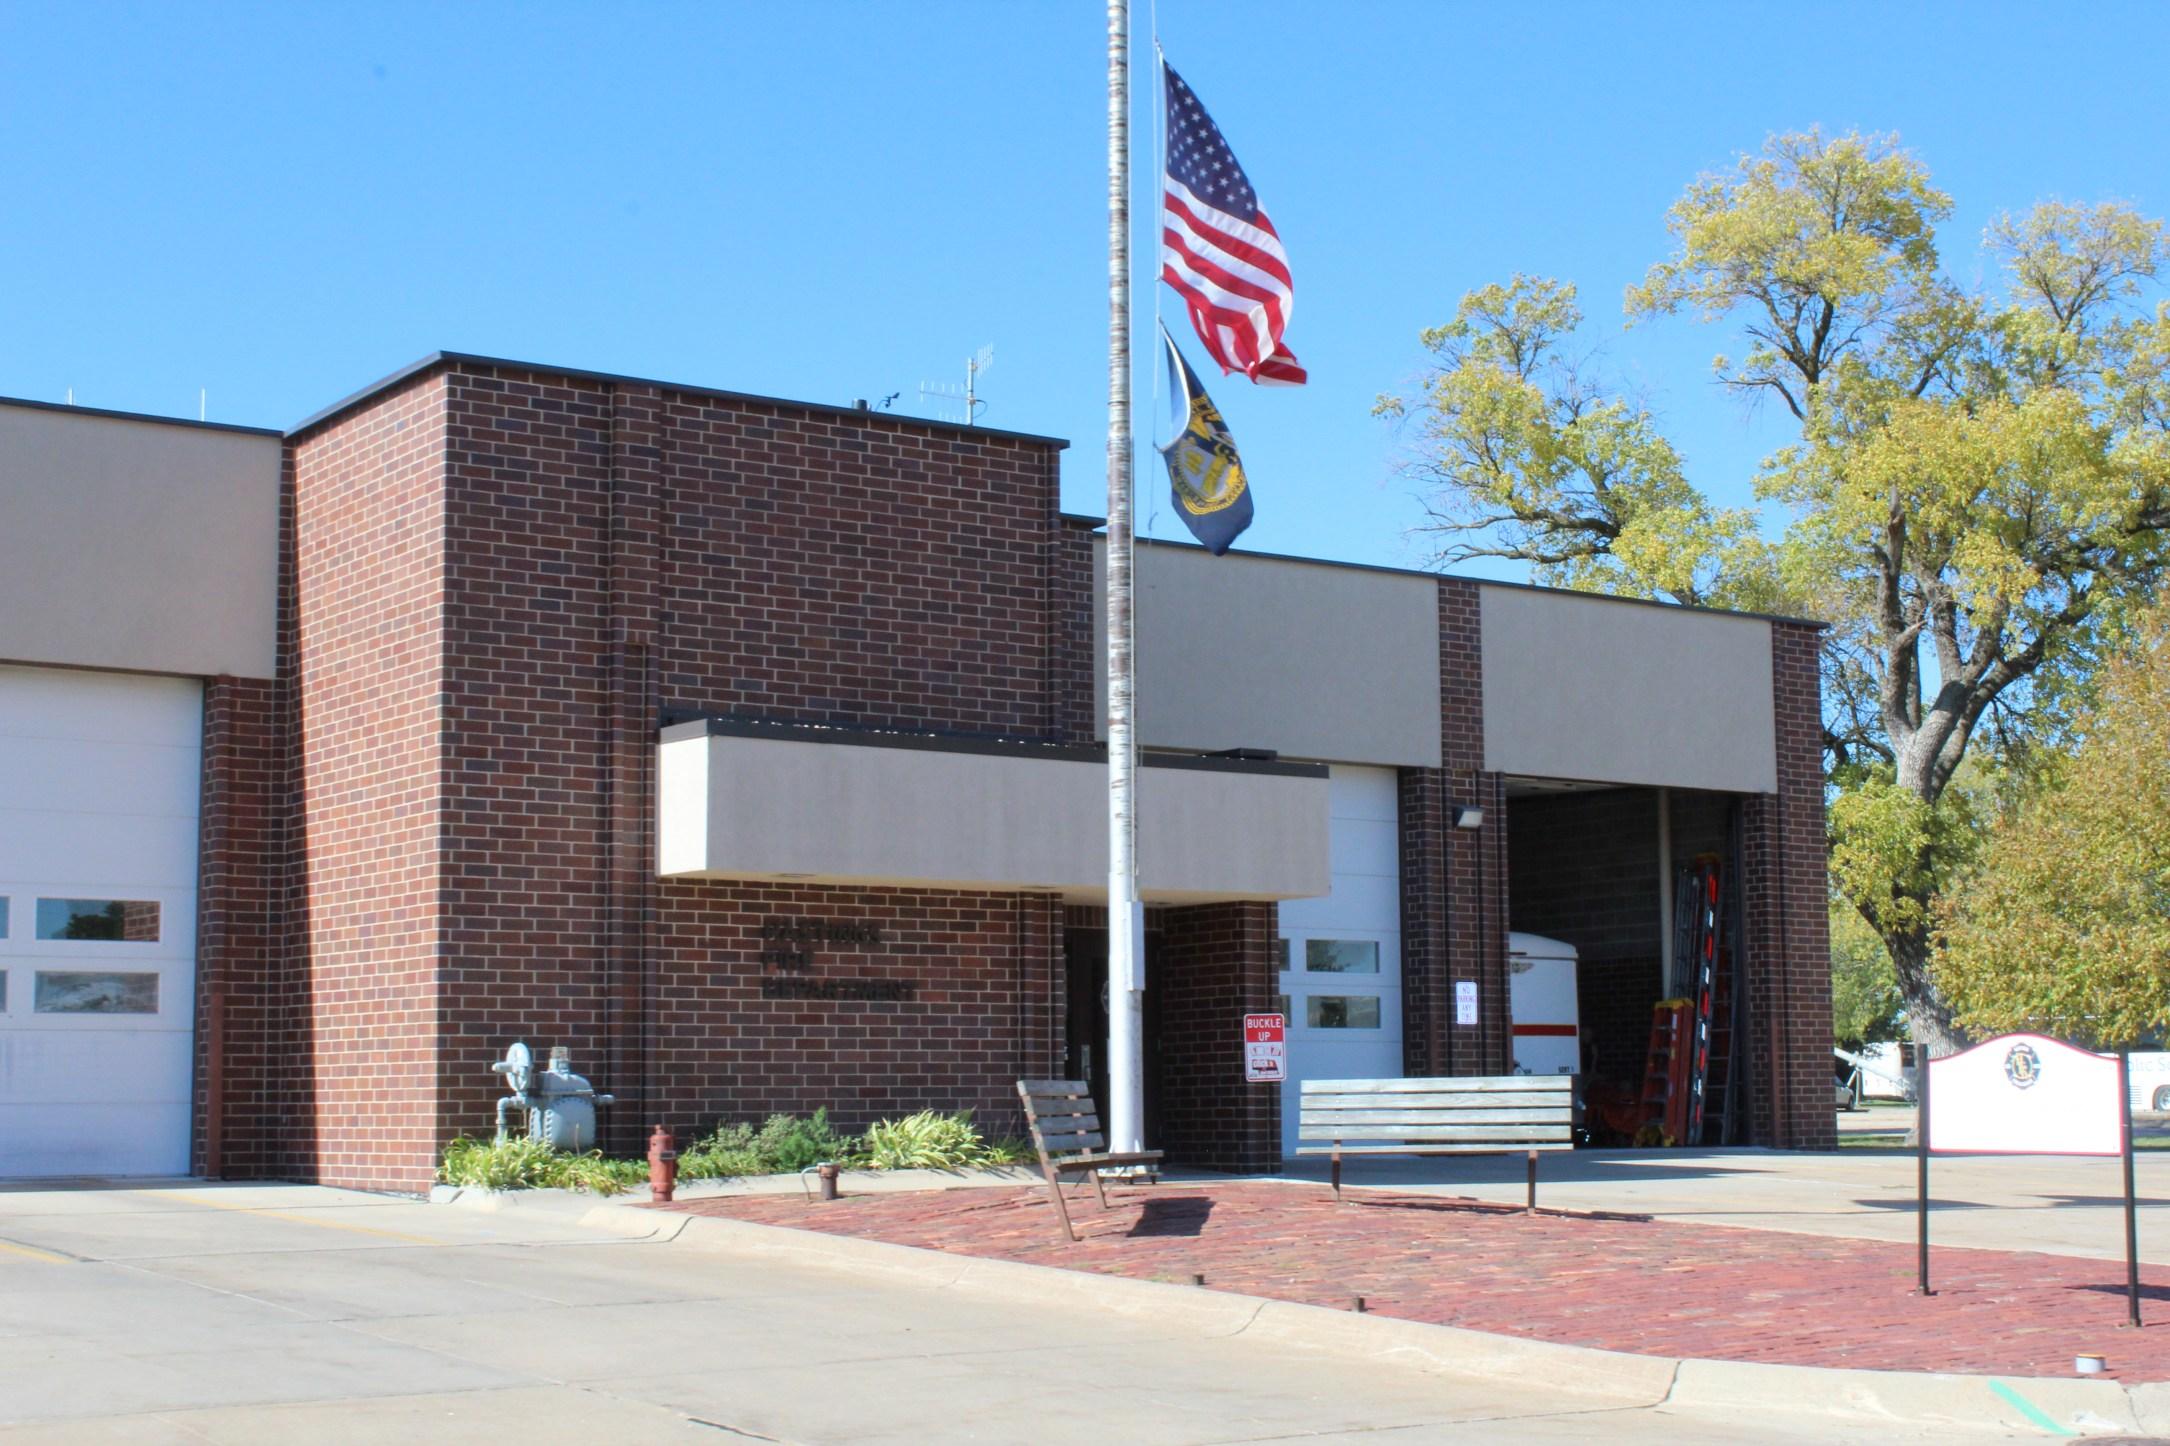
• Hastings Fire & Rescue Department;
• HastingsPoliceDepartment;
• Community Redevelopment Authority;
Community Engagement
• CentralCommunityCollege;
• HastingsCollege,and;
• Mary Lanning’s Facilities Department
Each group gave the planning team their thoughts on the strengths, opportunities, and challengesofliving,working,and playinginHastings.
Strengths:
• Educationalopportunities
• Localcolleges
• Qualityoflife
• Friendlypeople
• Everyoneknowseveryone
• Downtown
• Newmalldevelopment
• Employmentopportunities
• Parksandrecreation
• Small town feel while being closetothebigcity
• Localhealthcare
• Industry, location on two railroads
• EventslikeKool-AidDays
• Smallbusinesses
• Familyfriendly
Opportunities:
• Keeping pace with the other Tri-Cities
• Redevelopmentofthemall
• Growth of downtown; housing,restaurants
• Youngpeople
• Entrepreneur programs at colleges
• Housing,housing,housing
• Providing flexibility in regulations
• Protectingagriculture
• Capitalizing on softball crowds
• Building trust between city andresidents
• Setting common goals and priorities
• Forminganewidentity
• Attracting a new age of workforce, those who work fromhome
• Marketing what Hastings has tooffer
• Giving everyone a voice in thefutureofthecity
• Embrace benefits of being a smallcity
Challenges:
• Mistrust between city and residentsduetotransparency
• Housing,housing,housing
• Poverty disparity in southern halfofcity
• Lack of activities; people travel to Kearney or Grand Islandforentertainment
• Apathy
• Roadblocksforyoungpeople togetinvolved
• City being traditionally antigrowth
• Retaining students after graduating
• Easiertosay“no”than“yes”
• Developers face roadblocks whenapproachingcity
• Notenoughhighpayingjobs
• Lackofchildcare
• Publictransportation
• Costofstartingabusiness
• Blightedproperties
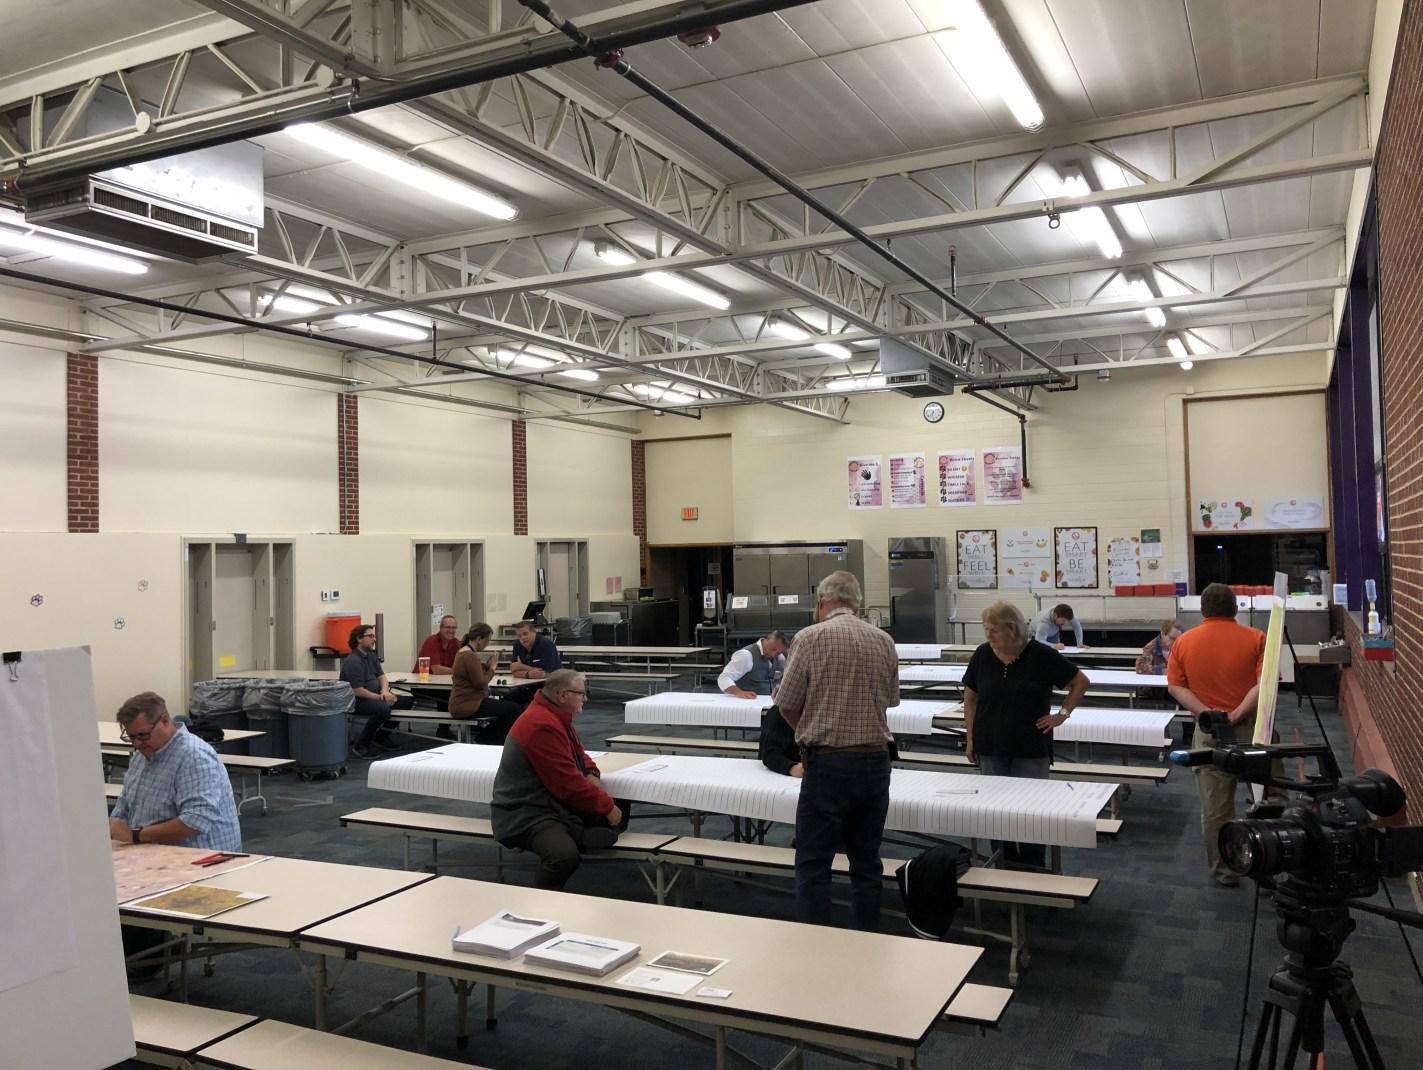
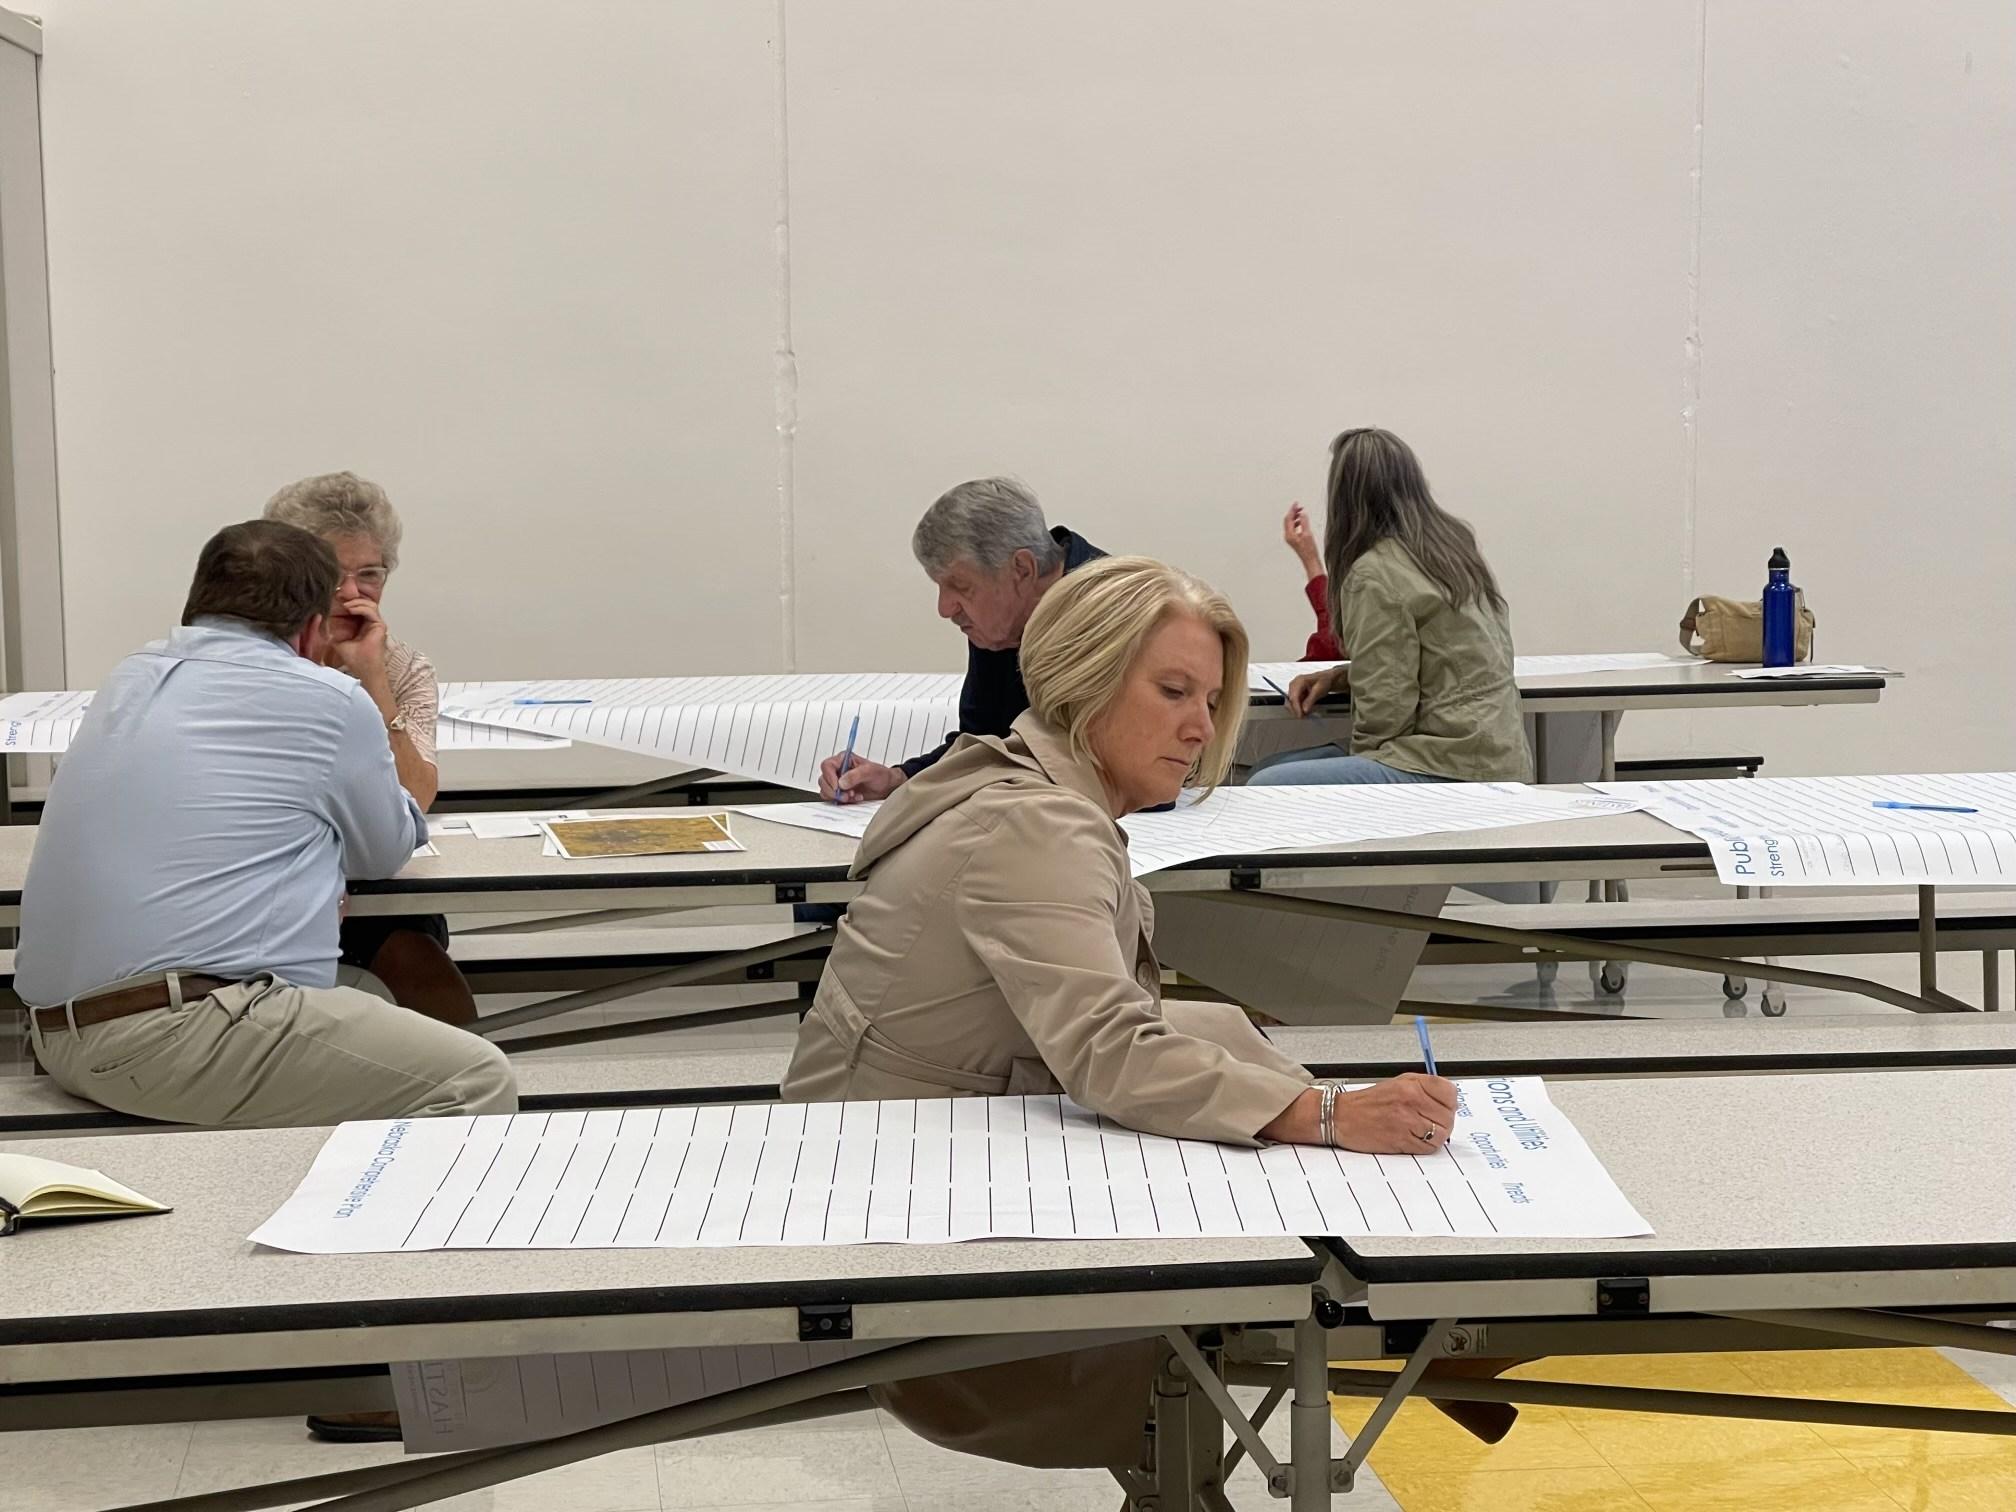
Town Hall Meetings
Town Hall meetings were an integral part of the planning process. These meetings were an open format, where attendees were free to come andgobetween6:00-8:00PM.
At these meetings, attendees were asked to rate the strengths, weaknesses, opportunities, and threats of thirteen topics that relate to Hastings as a whole. These thirteen topics were Communications and Utilities, Community Facilities, Economic Development, Education, Energy, Hazards, Housing, Land Use,NaturalResources,Parksand Recreation, Public Health, Public Safety, and Transportation. Also at these meetings, crowdsource mapping was encouraged, with large maps left on tables and small one left for attendees to take home. Postcards were left at each meeting as well for participants to take home. The public meetings were held in eachCityCouncilWard:
• Ward 3, Hastings High School, October3;
• Ward 4, Alcott Elementary, October4;
• Ward 1, Lincoln Elementary School,October5,and;
• Ward 2, Hawthorne Elementary School, October 6
A summary of the responses received at these meetings can be found in Appendix BCommunityEngagement.
Final Open House
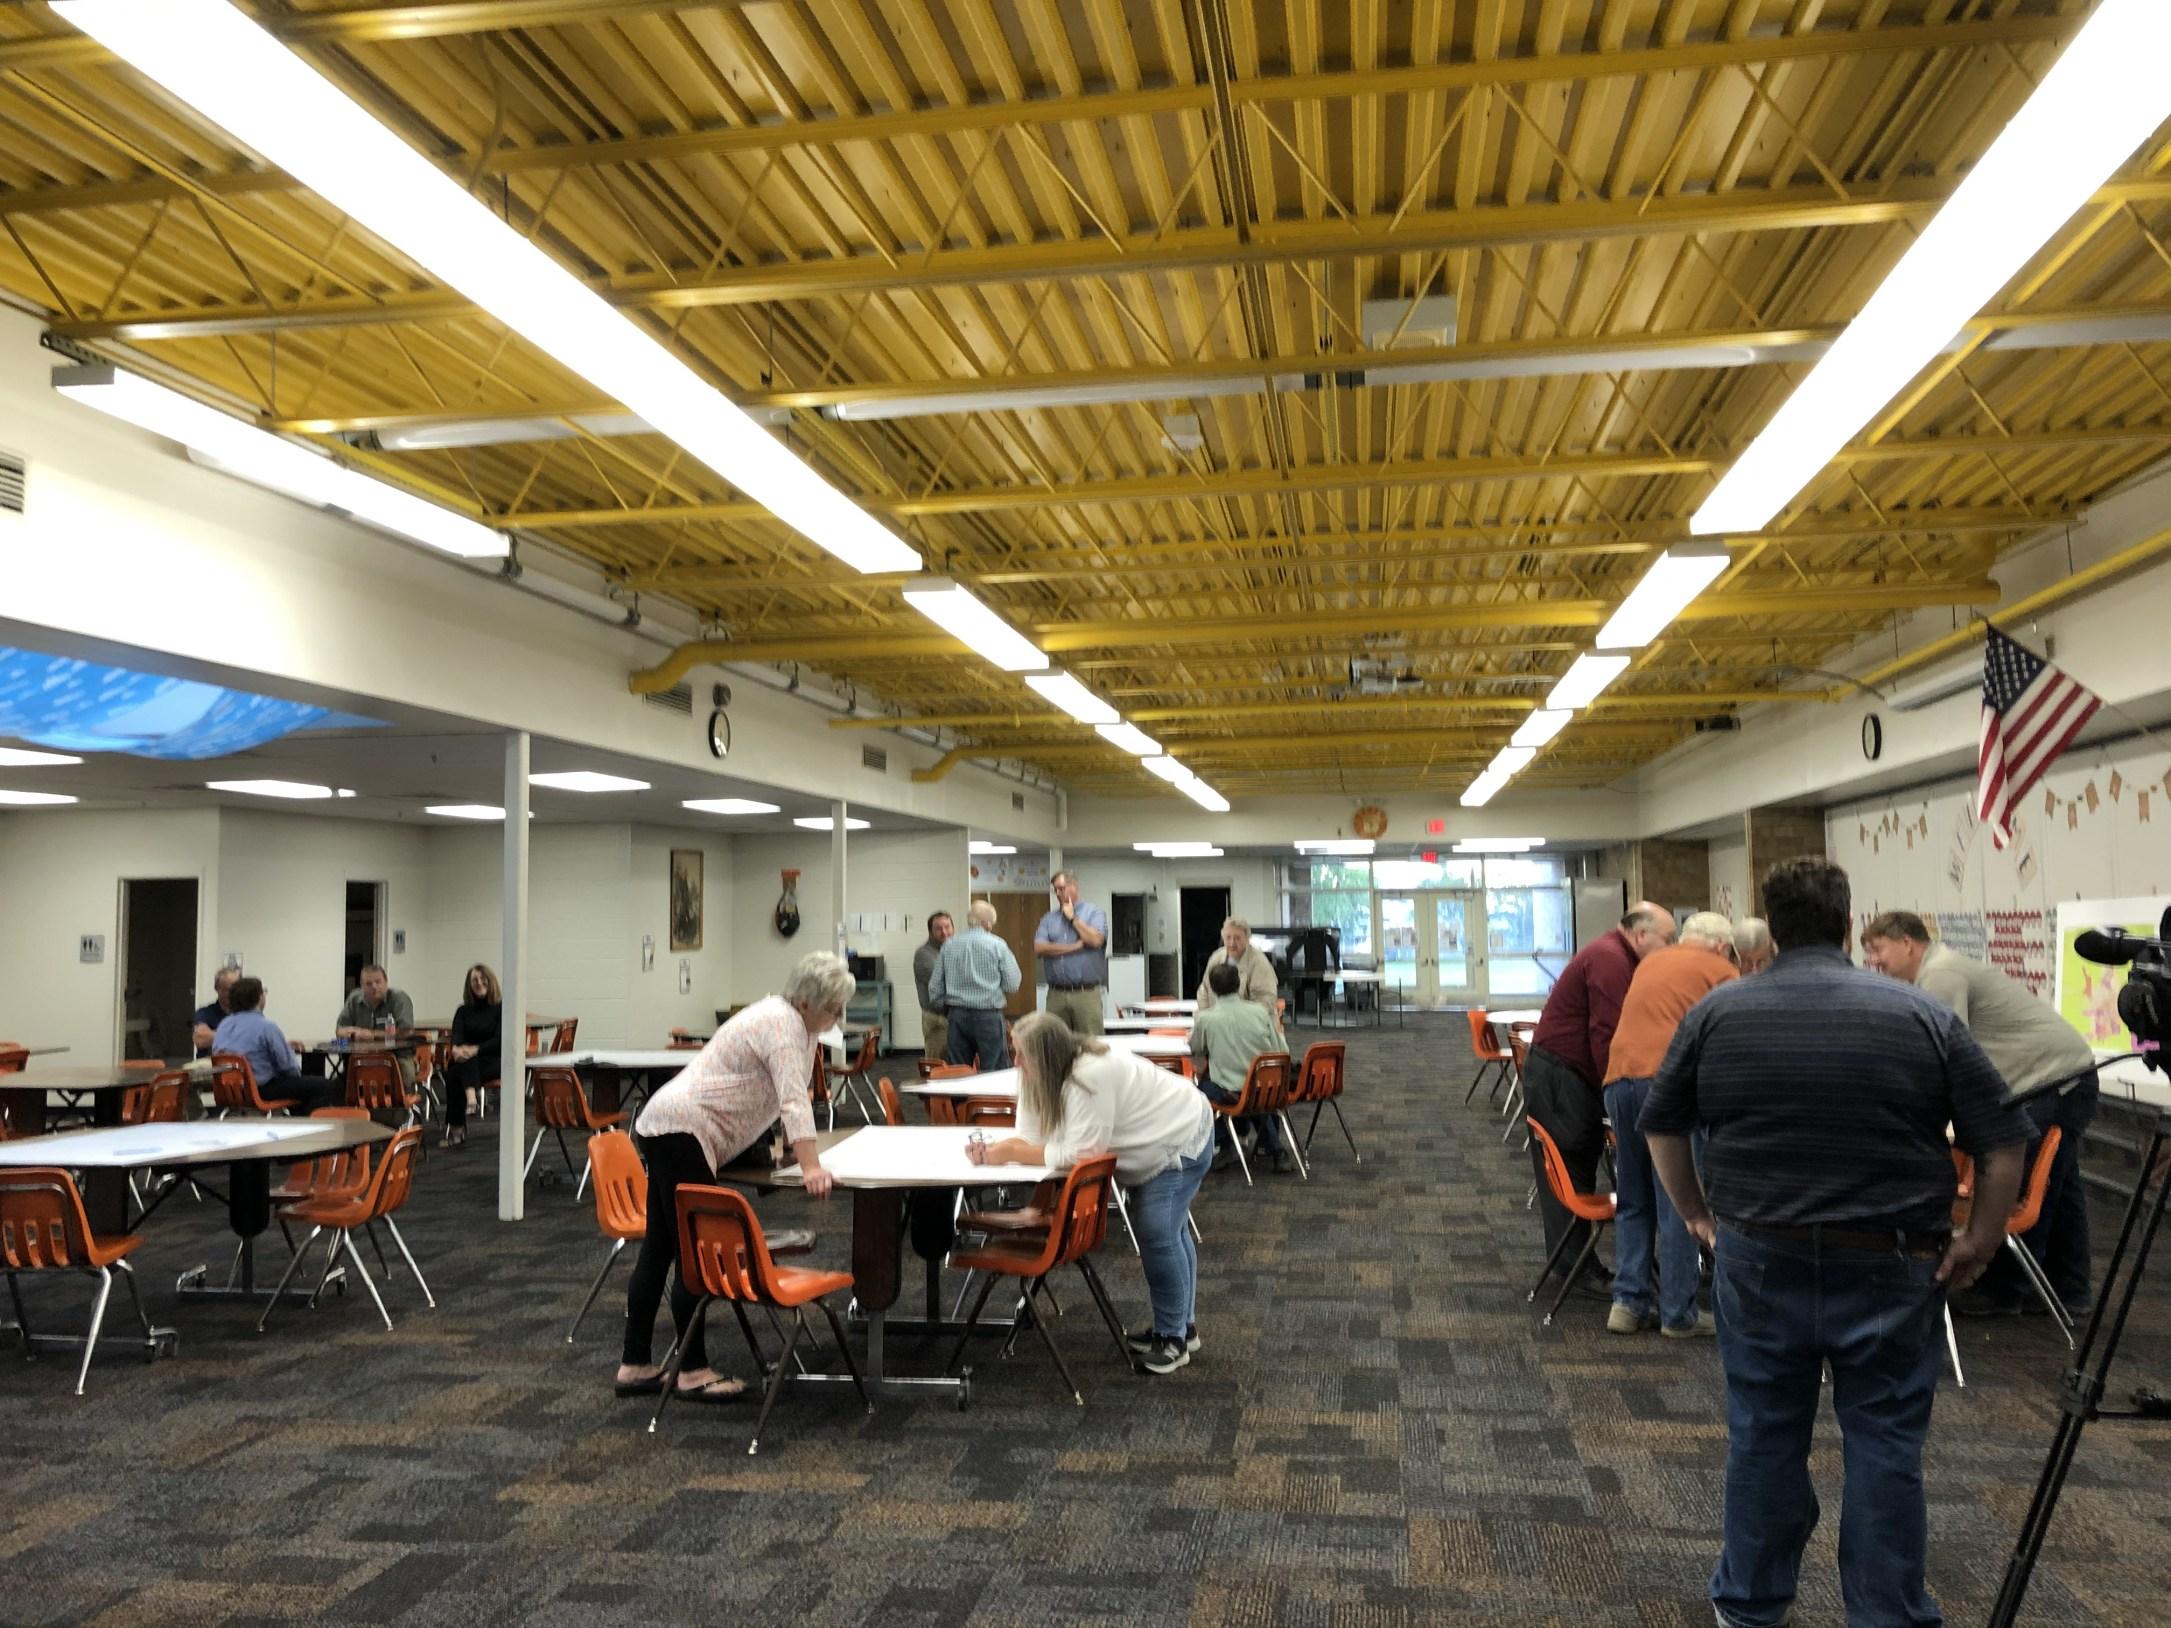
An open house was held on September 24, 2024, as a conclusion to the community engagement efforts of this project. The meeting was held at the Hastings Public Library.
Members of the planning team and City staff were present to answer any questions the public had about the direction provided by the Plan. Discussion at the open house was primarily centered on future land uses, demographics, and annexation policy.
Crowdsourcing
The residents of Hastings were able to contribute visually to the Comprehensive Plan through crowdsourced photography. Crowdsourcing through photography is like gathering a scrapbook of Hastings' best and worst. The project website had a survey where they could upload up to 10 photographs at a time of what they like and dislike about their communities. Photos encouraged were anything people like or dislike about Hastings. For those without access to the website, residents could also drop off photographs atCityHall.
Crowdsourced mapping is a process where residents are able to add their thoughts to a map of the city. These thoughts are represented by an icon, representing different topics on how to improve, preserve, or better Hastings. The project website contained a link to the crowdsource map. For those without access to the website, maps were left at City Hall, the Public Library, at all town hall meetings, and the Hastings 150th Anniversary Celebration. Central Community College and Hastings College distributed crowdsource maps to their studentsandfaculty.
Engage Hastings Webpage
The Engage Hastings webpage was created to inform the public
about ongoing efforts to implement this Plan. The webpage also provides constant up to date information on other planning efforts in the City, includingalistofprojectsineach neighborhood, zoning permits, and public works projects. This page also allows citizens to provide direct input back to the Cityonanyconcernsor thoughts they may have. Engage Hastings will not be closed once this Plan isadopted.
MindMixer
MindMixer is an online forum which encourages discussion, oftenontopicswhicharehardto be honest about at public meetings. Questions were posed by the planning team to participants, after which they were able to start an open dialogueonthequestionsposed.
Participantswere encouraged to get involved through gift cards and Hastings Museum passes. Themoresomeonewasinvolved, the more points they gathered, earning them a gift card or pass. The project website provided a linktotheMindMixerforum.
Surveys
SurveyMonkey, a web based survey tool, was utilized for gathering at-large input on Hastings. The survey process allowsindividualstoprovideinput while remaining totally anonymous.
The survey was advertised using the project postcards, as well as announcements on the city websiteandthroughtheHastings Tribune. The survey was also made available on the project website. For those who preferred to take the survey on paper, the survey was left at the Public
Community Engagement
Library, City Hall, and at all town hall meetings. Reaching all populations was important with this survey. The senior population of Hastings was reached by delivering surveys to the Good Samaritan Village. The younger student population was reached with surveys being delivered to Central Community College and Hastings College. The survey contained a total of 18 questions relatingtothecity.
The survey data helped to identify what people want protected, what needs to be changed, and what makes Hastings a special place to live. The results are listed in order of importance. Complete results of the survey can be found in the Appendix A - Survey Results. Answers that were inappropriate were not included in the results. Records of such answers can be requestedbythecity.
Goals and Actions
Planning for the future land uses of the city is an ongoing process of goal setting and problem solving, aimed at encouraging and creating a city with a better quality of life. Goal setting and problem solving began with the community engagement process, creating a base of priorities for the city’s future. Community engagement focuses upon ways of solving existing problems within the city, and providing a management toolenablingHastings’citizensto achievetheirvisionforthefuture.
Visioning
Visioning is a process of evaluating present conditions, identifying problem areas, and bringing about consensus on how to overcome existing problems and manage change.
Community Engagement
By determining Hastings’ vision, the city can decide where it wants to be in the future and then develop a vision plan guiding decisions of the city. The residents of Hastings must also act or implement the necessary steps involved in achieving this “vision”.
Change is continuous, therefore Hastings must decide specific criteriathat will be used tojudge and manage change. Instead of reacting to development pressures after the fact, the city along with their strategic vision, can better reinforce the desired changes, and discourage negative impacts which may undermine the vision. A shared vision allows Hastings to focus its diverse energies and minimize conflicts in the present, and in thefuture.
A key component of a Comprehensive Plan is the goals and actions. The issues and concerns of the citizens, gathered during the community engagement process, are developed into a vision. The vision statement can then be furtherdelineatedandtranslated into action statements and/or policies, used to guide, direct, and base decisions for future growth, development, and changewithinHastings.Hastings’ goals and actions attempt to address various issues regarding the questions of “how” to plan forthefuture.
Photo2.1:Openhousemeeting
Photo2.2:Openhousemeeting
Source:MarvinPlanningConsultants
Page Intentionally Left Blank
Chapter 3 Population
Population Trends
Understanding past and existing population trends and applying them to the future is a critical action Hastings should undertake. Hastings’ decisionmakers should understand where the city has been, where it is currently, and where it appears to be going. Population trends impact all major components comprising the city including housing, economics, medical services, local employment, education, and fiscal stability. Population projections also provide an estimate for the city to base development decisions andfuturelanduses.
The trends examined in this chaptercompareHastingstothe Tri-Cities region as well as peer cities. Comparisons to the TriCitiesareimportant,asHastingsis not getting the same share of growth being seen in Kearney or Grand Island. It is important for Hastings to know why this is the case. The peer cities of
Columbus, Fremont, North Platte, Norfolk, and Scottsbluff, Nebraska, were all selected due to their population size and economic impact on the region. However, these are all isolated regional centers; Hastings is not. Nevertheless, it is important to make these comparisons outside of the Tri-Cities; Hastings should
comparing themselves to these cities outside of the Tri-Cities. Ultimately,populationprojections are only estimates and unforeseen factors may affect projections significantly. The review of these projections should occur regularly, particularly as new data are releasedbytheCensusandthe
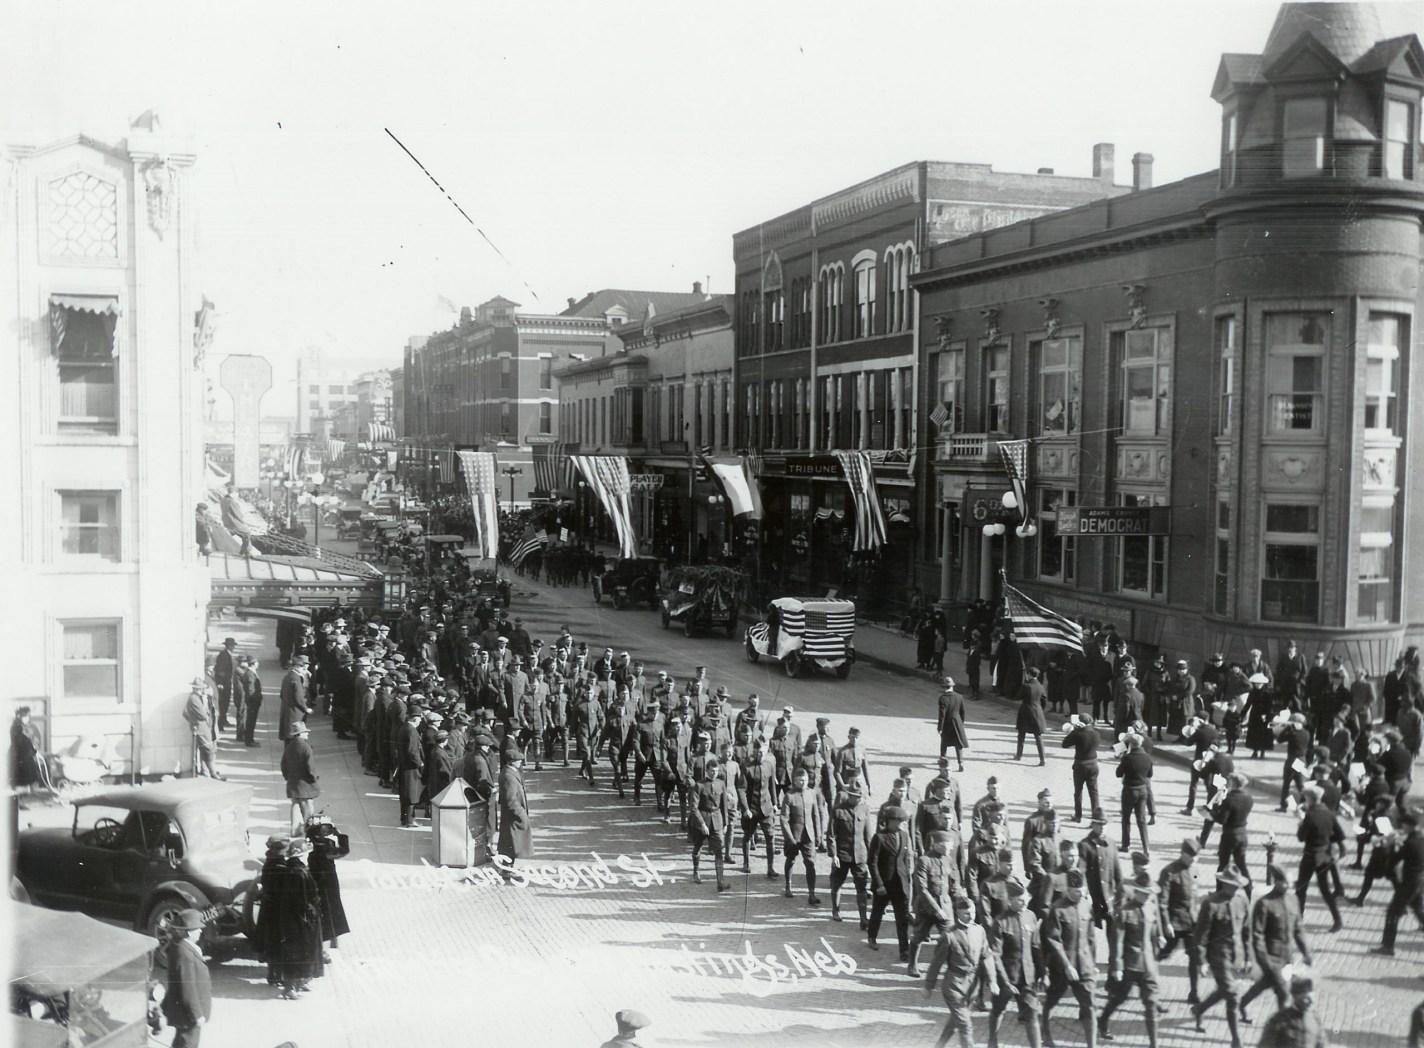
Photo3.1:Downtownparade,1920
Source:HastingsMuseum
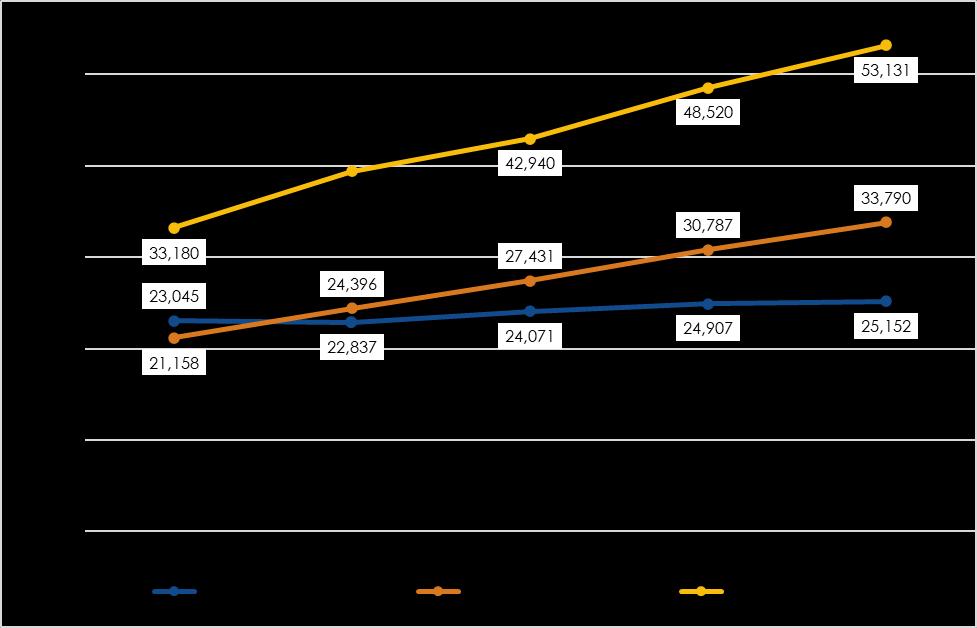
3.1: Population Trends, Hastings and the Tri-Cities, 1980-2020
Source: U.S. Census Bureau 1980 - 2020
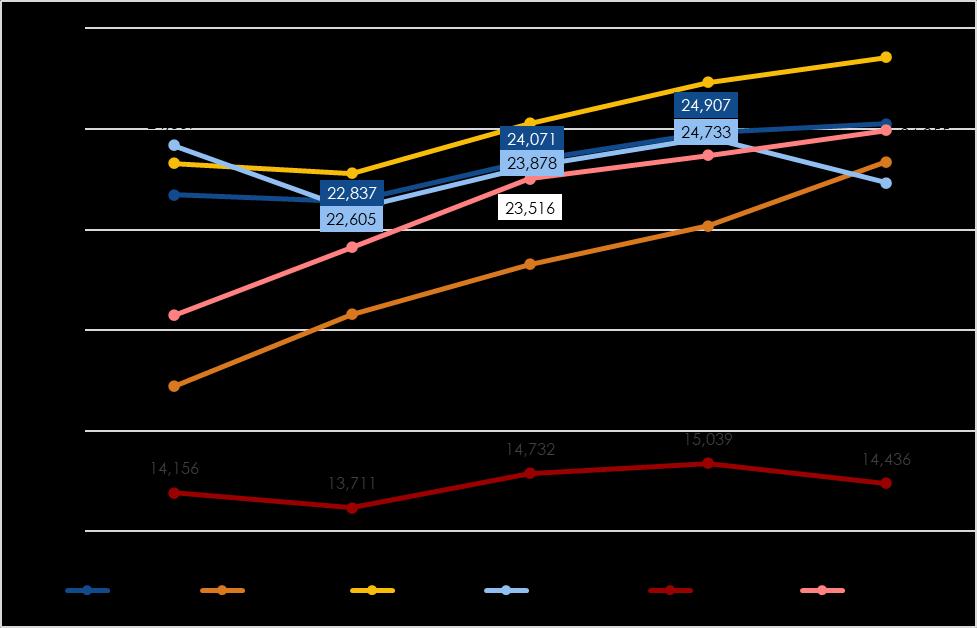
Figure 3.2: Population Trends, Hastings and Peer Communities, 1980-2020
Source: U.S. Census Bureau 1980 - 2020
Figure
Trends Analysis
Figures 3.1 and 3.2 contain the population over the previous 40 years, comparing Hastings to the Tri-Cities region and its peer communities in Nebraska. These data are the basis for the eventual projection lines for population scenarios in the community.
In comparison to the Tri-Cities, Hastings has the smallest current population. However, this was not always the case; Hastings had a higher population than Kearney and was comparable in size to Grand Island until 1990. Many factors caused Kearney and Grand Island to begin to grow more than Hastings; locationonI-80,inplaceindustry, and Kearney State’s College transition to the University of Nebraska system being amongst those reasons. Kearney now has over 8,000 more persons than Hastings, and Grand Island has now morethandoubledHastings insize.
In comparing itself to its peer communities, Hastings fares considerably better. Aside from the starting period of 1980, Hastings has had the second highest population of the six cities. Each community has seen consistent growth or a slight decrease in population; Hastings grew by 9.1% over the period, which was the fourth-highest growth rate. Columbus saw the greatest increase, growing by 38.7%.
Age Profile
Age Structure Analysis
Age structure is an important component of population analysis. By analyzing age structure, the city can determine
Table 3.1: Age Characteristics, 2012-2022
the key dynamic affecting the population growth or decline, and sustainability of Hastings’ population. Each age group affects the population in a number of different ways; the existence of large younger age groupsmeansagreaterabilityto sustain future population growth compared to large older age groups.
Table3.1containstheagegroup structure for Hastings in 2012 and 2022. The examination of the city’s age structures provides an understanding of where some of the population shifts are occurring. Reviewing population in this manner permits a detailed analysis of which specific groups aremovinginandoutofthecity. Positive changes in a group indicate in-migration or births. Negative changes in a group indicate out-migration or a combination of out-migration anddeaths.
Hastings saw growth in five age groupsfrom 2012to2022.The 0-4 and 5-9 groups are always an increase as these individuals were not alive for the 2012 American Community Survey. Outside of these age groups, the otherincreaseswereinthe10-14, 15-19, and 20-24 age groups. When you eliminate the first two younger populations, 653 people moved into Hastings during this period. Adding the new births into the mix, the total population growthwas3,827people.
There were eight age groups from 2012 having declined by 2022.Thegroupwiththegreatest loss was the 85 and over age group, which lost 1,485 persons, or 69.1% over the time period. The 65-74 age group lost the second most persons, which is alsoanolderagegroup.Thisage group lost 541 persons, or 17.9%. Younger age groups lost significant population as well. Likely college graduates, as well
Sources: ACS 5-Year Estimates 2012 and 2022
as young families, (25-29 through 40-44)alllostpopulation.
Median Age
Tables 3.3 and 3.4 compares the medianagesofHastingsandthe Tri-Cities and Hastings and its peer communities between 2012 and 2022. In comparison to the Tri-Cities, between 2012 and 2022, the median age for Hastings only decreased by 0.2 years (36.5 to 35.3). Hastings had thehighestmedianage ofthe Tri -Cities. The presence of the University of Nebraska-Kearney in Kearneyislikelyareasonwhythe median age has consistently been lower than Hastings’ median age. As shown in Table 3.1, college graduates and family bearing aged persons are leaving the city, leaving Hastings with an aging population and a consistentlyhighermedianage.
In comparison to the peer communities, Hastings is far more comparable. Each city had a median age in the mid to late 30’s across the time period, excluding Norfolk, which reached40.1by2022.Asof2022, Hastings’ median age was 36.3, the third lowest of the communities. Scottsbluff had the lowest median age at 31.0 in 2012.
Age Cohorts
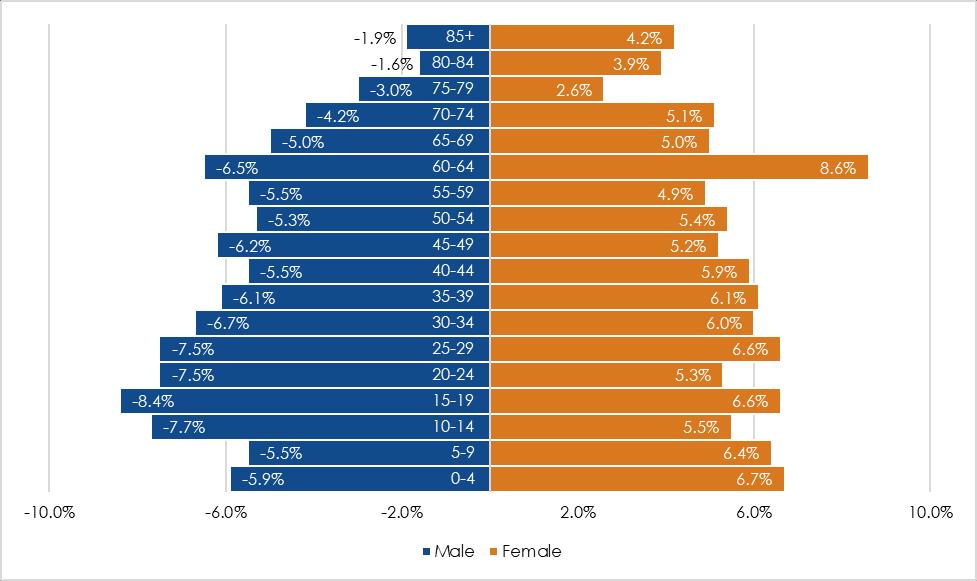
Figure 3.3 is a population pyramid of the current age structure of Hastings. The largest cohort of males (14.2%) were young men/children age 15-19. The largest cohort of women (13.6%) were young women/ children age 15-19 and 20-24. There was a greater share of women than men over the age of 50. Service providers for senior citizens should take this gender discrepancyintoaccountduring
Table 3.2: Median Age, Hastings and the Tri-Cities, 2012-2022
Source: ACS 5-Year Estimates 2012 - 2022
Table 3.3: Median Age, Hastings and Peer Communities, 2012-2022
Source: ACS 5-Year Estimates 2012 - 2022
Figure 3.3: Population Pyramid 2022
Source: ACS 5 Year Estimates 2022
program planning. Among working age population (20-64), the smallest cohort among men were age 50-54 (5.0%) and among women were ages 40-44, 45-49, and 55-59 (4.6%). The larger numbers of younger people in age cohorts 20-24 through 35-39 are prime candidates for workforce training.
Age Cohort Projections
Tables3.4 through 3.6 to the right project the population of three critical age groups into the future;youth (0-19),collegeage/ young professionals, and seniors (55-85+). Monitoring these population’s projected growth is important, as all have their own unique needs. Youths need adequate school facilities and healthcare services, (their caretakers need sufficient daycare services). College aged persons and young professionals seek amenities and entertainment options, particularly if they are in college (attracting them to Hastings is important) or are a young professional looking to start a family. Seniors require certain healthcare services and also require sufficient housing to either age-in-place or transition into.
These data were calculated by taking the 2021 ACS 5-year estimate for each age cohort, and then applying the fertility rate of females and mortality ratetoeachagecohort.Ineach subsequent decade the two factors of mortality and fertility are reapplied, to eventually reach the 2051 number. These are merely projections; where Table 3.1 looks at raw data only, these tables model what the cohorts may look like in the next
Table 3.4: Youth Cohort Projections, 2021-2051
Table 3.5: College/Young Professional Cohort Projections, 2021-2051
Table 3.6: Senior Cohort Projections, 2021-2051
30 years. Table 3.4 projects the youth population to grow from 7,057 to 11,197 (58.7%). The significant growth over the next 30yearswillmeanthecityshould focus on providing more adequate services and facilities for both the children and their caretakers. (Levels of service will beexploredinChapter6.)
Table 3.5 projects a slight increase in college aged
persons/young professionals (1.9%).Thenumberstayingnearly the same means the city will need to continue to provide the amenities sought by college students or by those young professionals who want to set down roots and start families in thecity.
Table 3.6 projects the senior population to fluctuate, with an overall decrease from 7,482 to
7,152 (-4.4%). Some of this decrease is due to the mortality rate in this age group as well as the likelihood of persons moving away. Although the population decreases slightly, the city must still ensure they are providing healthcare services and meeting housingneedsforthispopulation.
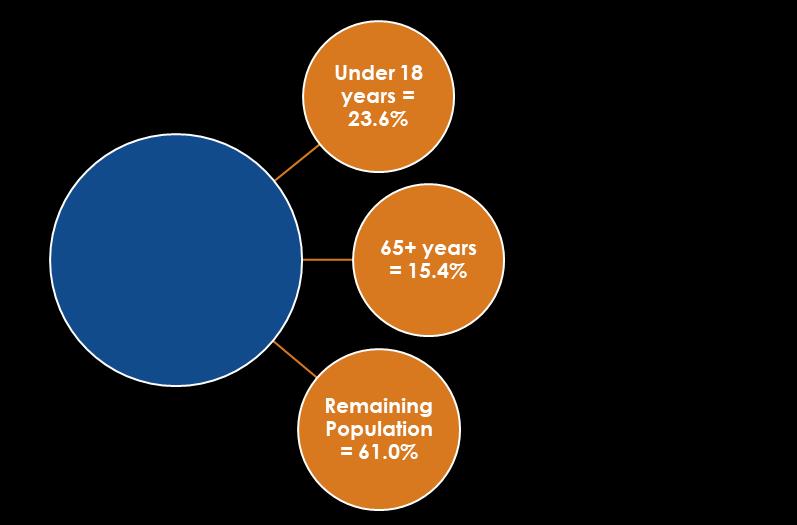
Dependency Ratio
This ratio examines the portion of Hastings’ supporting age groups historically dependent upon othersfor survival (thoseunder18 years and those 65+ years). The ratioisimportanttoexamine asit focuses on the number of dependent persons and if there is enough employed persons in the community to support the dependent populations and the employedpopulation.
Dependency Ratio
< 1: 1 Independent resident is able to support more than 1 Dependentresident
=1: 1 Independent resident able to support 1 Dependent resident
>1: 1 Independent resident able to support less than 1 Dependentresident
(%18 years and younger + % 65yearsandolder) Dividedby %ofremainingpopulation
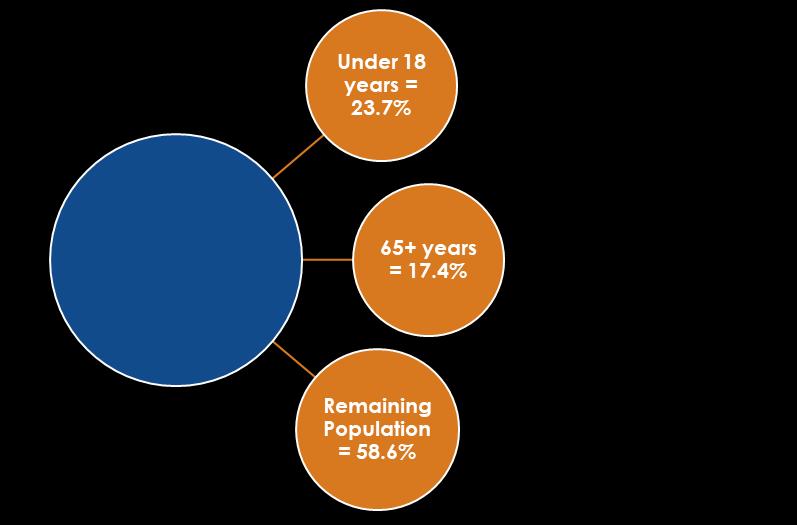
Figures 3.3 and 3.4 indicate the dependency ratios for 2012 and 2022 in Hastings. The portion of persons less than 18 years of age stayed the same between 2011 and 2021, however those aged 65 years and older increased by 2.0% over the time period. In 2012, Hastings had a dependency ratio of 0.64. By 2022 the dependency ratio had increasedto0.70.
Dependency Ratio = .64
Dependency Ratio = .70
Increases are not a positive sign foranycommunity.Itisimportant for the city to keep the working agepopulationinthecity.Ahigh dependency ratio means the city’s population is aging in conjunction with the working age population decreasing or not growing. This means the working age population is not being replaced by young persons; the age pyramid is heavieratthetopandnotatthe base.
A focus on keeping and attracting working age persons will be important for the city. Secondly,adecreaseinthenonworking age population means the city must work to continue providing services for persons below18andforseniorcitizens.
Source: ACS 5-Year Estimates 2012
Figure 3.4: Dependency Ratio, 2012
Figure 3.5 Dependency Ratio, 2022
Source: ACS 5-Year Estimates 2022
Ethnicity
Analysis of ethnicity provides more detail as to the changes beingseeninacommunity.Each resident bring their own cultures and beliefs to the area; supporting each culture and belief is paramount to the successofthecityintothefuture. Both the city and school districts need to track these changes annually in order to support and helpthesegroupsthrive.
Hastings was predominantly White alone in 2010; this did not changeby2020.TheWhitealone population did decrease by 1,408 persons (6.6%) between 2010 and 2020, though the total population was still 79.8% White. The Hispanic Origin (Any Race) population increased from 2,430 to 3,479 between 2010 to 2020. The Two or More Races population group also increased over the time period, growing from 255 persons to 791 persons. The other groups saw either a slight increase or decrease in persons over the time period. Despite the increases in these other groups, the population in Hastings’ remained a majority White alone. This will likely continue into the future for the citybasedonthesetrends.
Educational Attainment
The greatest number of Hastings residents are high school graduates, or have attended some college with no degree. Among Hastings residents 25 years and over, 25.7% had a Bachelor’s Degree or higher In 2022. This compares to 32.9% of allNebraskans. Therewere90.5% of Hastings residents the same age who were High school graduateorhigher,comparedto 91.7%statewide.
Source: U.S. Census Bureau 2010 and 2020
Income and higher education attainment tend to be highly correlated. Over recent years, the share of Hastings residents holding a higher education degree has risen gradually, but steadily, from 2012 to 2022. The share of personswith aBachelors degree increased by nearly 15.5% from 2012 to 2022. As of 2022, 35.6% of the total population in Hastings has at leastabachelorsdegree.
Not all higher paying jobs require college degrees, and quality vocational and on-the-job training in this job environment can translate well into steady living wages. Nevertheless, continuing the increase in educational attainment will be beneficial to the community and economy.
Population Projections
Population projections are estimates based upon past and present circumstances. The use
of population projections allows Hastingstoestimatethepotential population in future years by looking at past trends. By scrutinizing population changes in this manner, the city will be able to develop a baseline of change from which future scenarios can be generated. A number of factors such as demographics, economics, or social may affect projections positivelyornegatively.
At the present time, these projections are the best tool for predicting future population changes. There are many methods to project the future population trends; the one projection technique used is intended to provide Hastings a broad overview of possible populationchangesinthefuture.
Trend Line Analysis
Trend Line Analysis is a process of projecting future populations based upon changes during a
Table 3.7: Population by Ethnicity, 2010 and 2020
specified period of time. In the analysis of Hastings, four different trend lines were reviewed: 2010 to 2020, 2000 to 2020, 1990 to 2020, and 1970 to 2020. A review of these trend lines indicates Hastings will see varied levels of population changes between now and 2050. The following projections summarize the decennial population for Hastingsthrough2050.
The trend lines examined were calculated by finding the rate of change over 10, 20, 30, and 50 years in Hastings. The rate of change per each period was then applied to the current population to project growth over the next 30 years. The table totheright(?)liststhefourtrends.
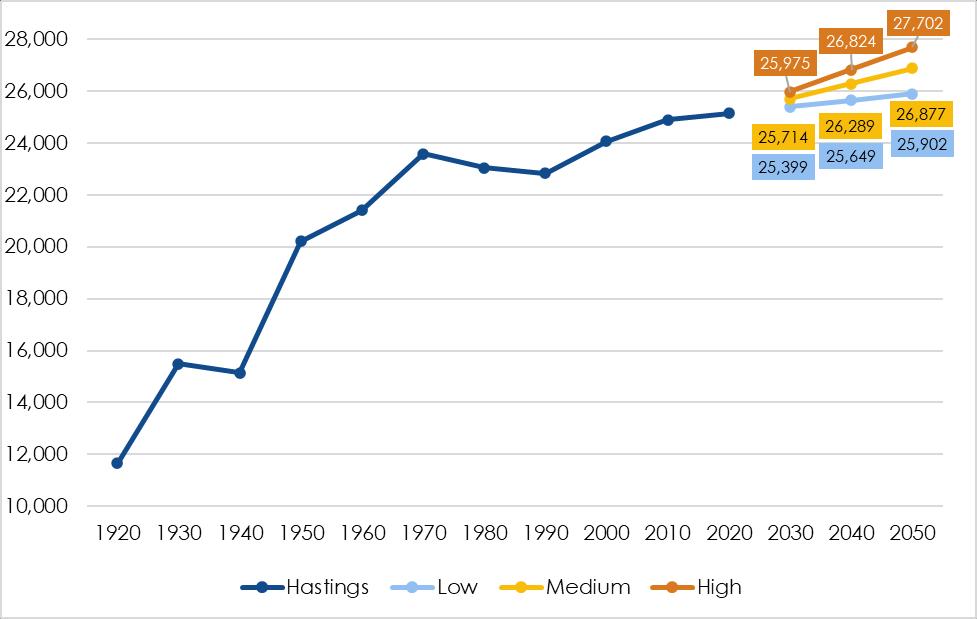
Summary of Population Projections
Three population projection scenarioswereselected:
Low = 2010 to 2020
2030 25,399persons
2040 25,649persons
2050 25,902persons
Medium = 2000 to 2020
2030 25,714persons
2040 26,289persons
2050 26,877persons
High = 1990 to 2020
2030 25,975persons
2040 26,824persons
2050 27,702persons
Each projection trend shows growth for the city. The range of growth between low and high is approximately1,800persons.
Year 1970 to 2020
2020 25,152 persons 2030 25,479 persons
2040 25,810 persons
2050 26,145 persons
Year 1990 to 2020 2020 25,152 persons
2030 25,975 persons
2040 26,824 persons
2050 27,702 persons
Year 2000 to 2020
2020 25,152 persons
2030 25,714 persons
2040 26,289 persons
2050 26,877 persons
Year 2010 to 2020
2020 25,152 persons
2030 25,399 persons
2040 25,649 persons 2050 25,902 persons
Source: U.S. Census Bureau 1920 - 2020, Marvin Planning Consultants
Figure 3.6: Population and Projections
Chapter 4 Housing Housing
Housing is an essential need for all residents of a community. Housing preferences also vary widely between people and those in different stages of their life. Young families have different needs and preferences than senior citizens. Those preferences changeconstantlyovertime.
This housing profile examines the existing and projected housing market conditions for Hastings, with a focus on affordable and “missing middle” housing and needs of at risk households. Data used in this element comes from a variety of sources including the U.S. Census Bureau, U.S. Department of Housing and Urban Development (HUD), Adams County Assessor, thirdparty vendors, and qualitative information from focus group participants.
Projecting future housing needs requires consideration of multiple factors including population
change, household income, housing vacancy rates, employment rates, land use patterns, and residents' preferences. This chapter incorporates findings of the HastingsAffordableHousingPlan, and presents information on the householdcharacterof Hastings’ residents, describes the existing housing stock and housing conditions, and considers future needsforhousing.
Household Character
Overall, Hastings has seen marginal growth over the past twodecades, both in population and households. As Table 4.1 illustrates, the number of households in Hastings grew by only 1.2% from 2012 to 2022. The number of households with more thanoneormorepersons65and oldergrewby23.3%.
Table 4.1: Hastings Households, 2012-2022
Sources: ACS 5-Year Estimates 2012 and 2022
Households
In 2022, the number of persons in Hastings living in households numbered 23,840, a growth of 155 persons from 23,685 in 2012. According to the U.S. Census Bureau, 903 persons lived in group quarters as of 2020. 73 of those were institutionalized, which includes such places as correctional facilities for adults, juvenile facilities, and nursing/ skilled-nursing facilities. 830 of those were noninstitutionalized, living primarily in College/ Universitystudenthousing.
Household Size
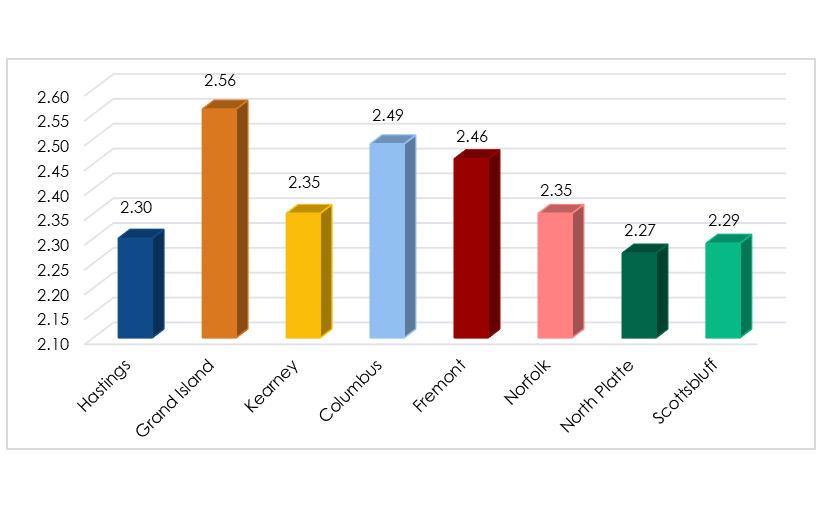
As seen in Figure 4.1, the average household size in Hastings in 2022 was 2.30 persons per household. The trend nationally has been towards a declining household size. Hastings had a lower average household size than the other two Tri-Cities. Compared to its peer cities, Hastings also had a lower household size, aside from NorthPlatteandScottsbluff.
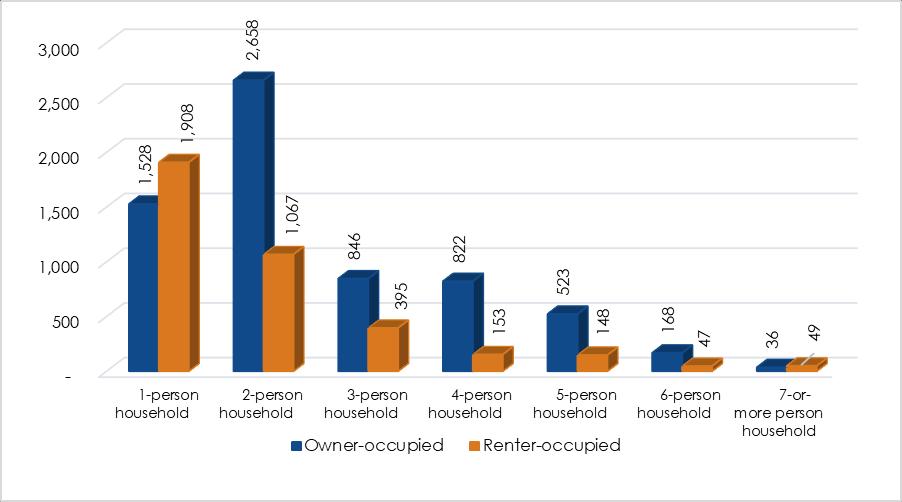
Two-person households were the largest group of owner-occupied housing in Hastings in 2021, with 2,658housingunits(Figure4.2).By comparison, the largest household size for rentals was one-person households with 1,908housingunits.
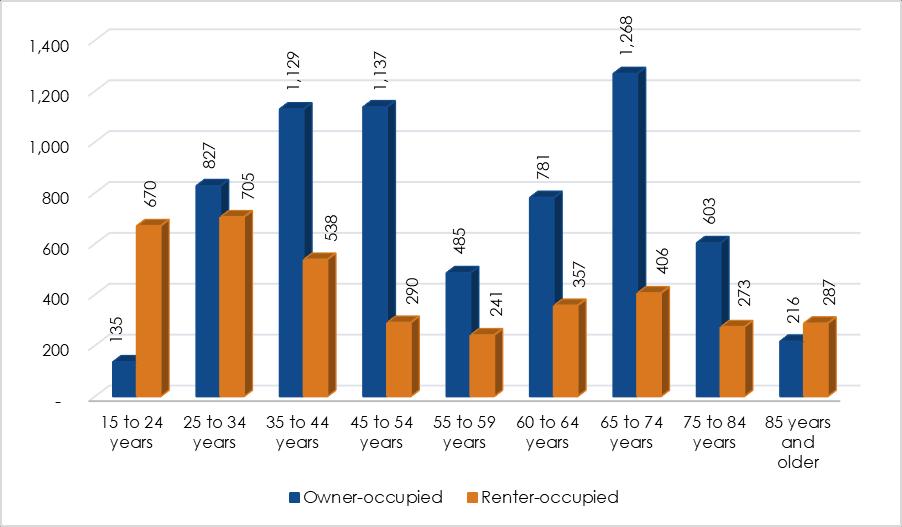
In 2022, the largest home ownership age cohort (Figure 4.3)werethose65to74yearsold (1,268 or 19.3%). The largest renter-occupied age cohort were those 25 to 34 years (705 or 18.7%). While home-ownership does tend to skew towards older demographics, there is a demand for rental housing amongresidentsofallages.
Figure 4.2: Persons By Household Type, 2022
Source: ACS 5-Year Estimates 2022
Figure 4.3: Age by Household Type, 2022
Source: ACS 5-Year Estimates 2022
Housing
Housing Stock
While the housing stock in Hastings continues to age, the shareofolderunitsislessthanthe state overall. However, as each year passes the housing stock ages, and approximately 1% of existing housing units (on average) are removed from the housing stock, through fires, demolition, or other means. If new units are not placed in service or existing units are not maintained or renovated, neighborhoods can deteriorate, leading to disinvestment and dissatisfaction.
Age of Housing Units
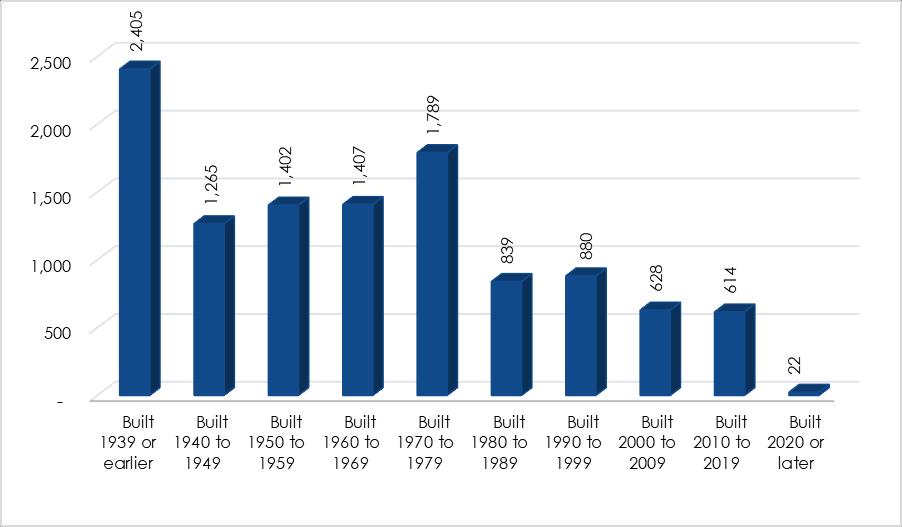
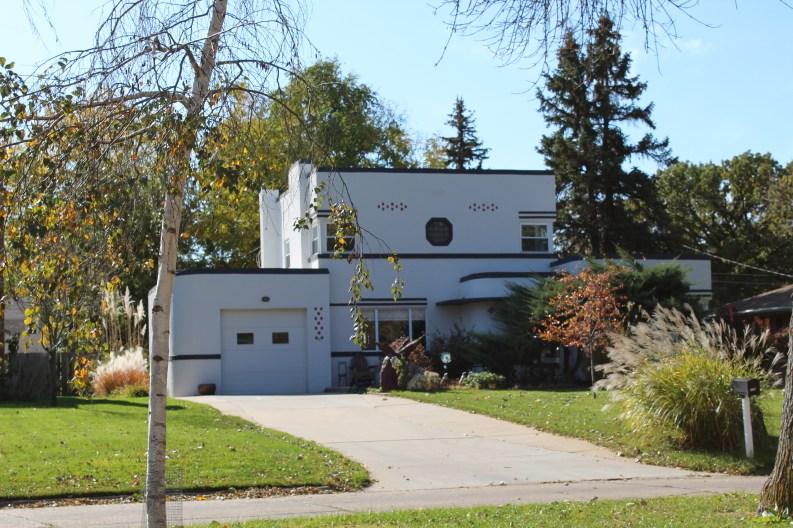
Hastings’ housing stock was primarily built 1939 or earlier. Figure 4.4 shows 2,405 housing units - over 24.1% of all housing units in the community - were constructed from at this time. These statistics represent older well-kept homes as well as homes likely in need of repair and possibly rehabilitation. Approximately13.0%ofallhomes have been constructed since 2000.
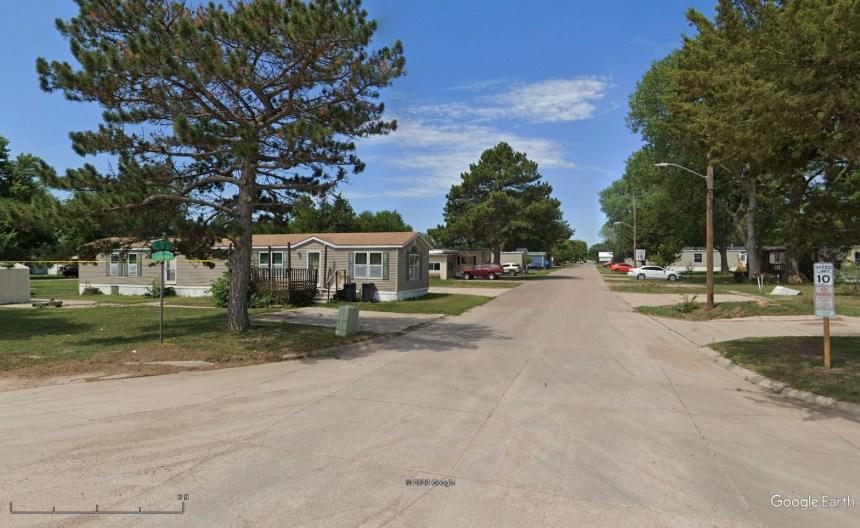
Housing Types
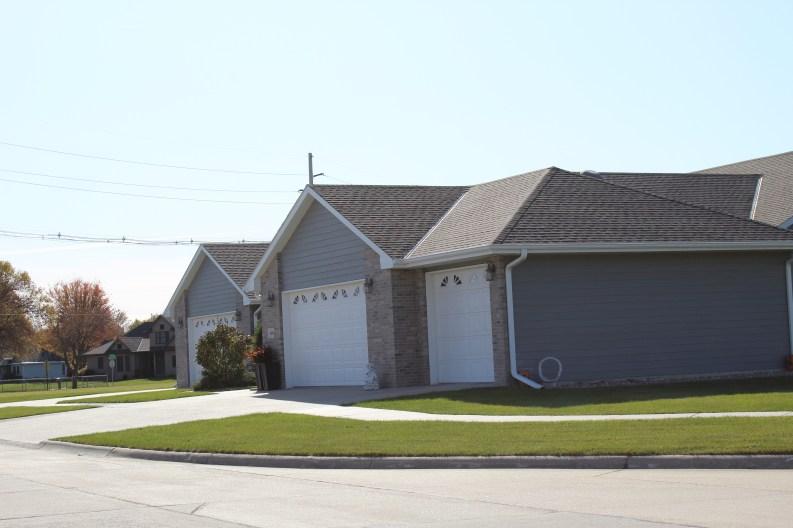
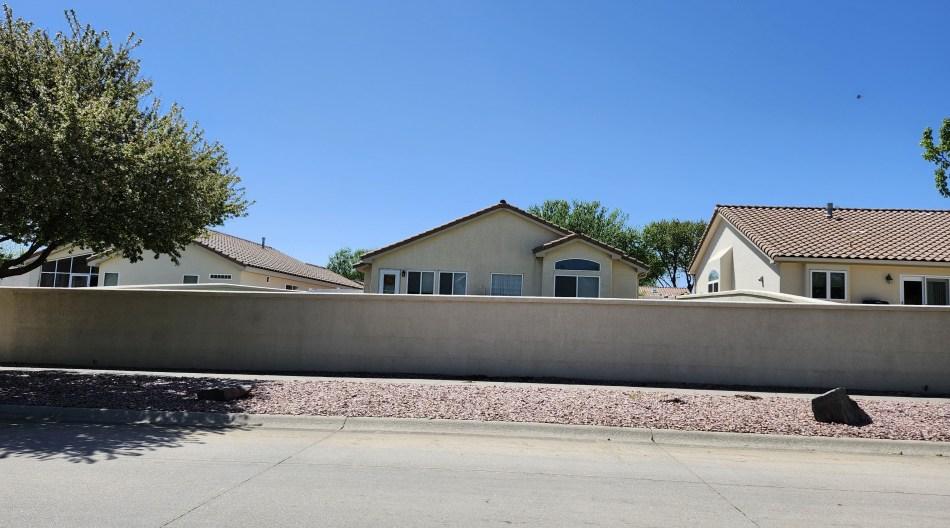
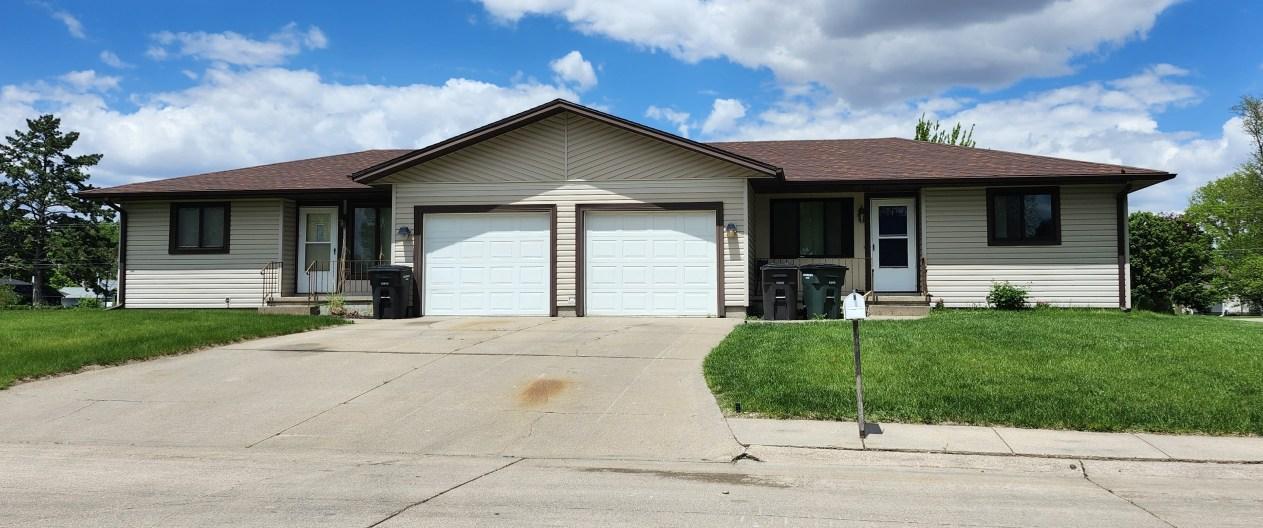
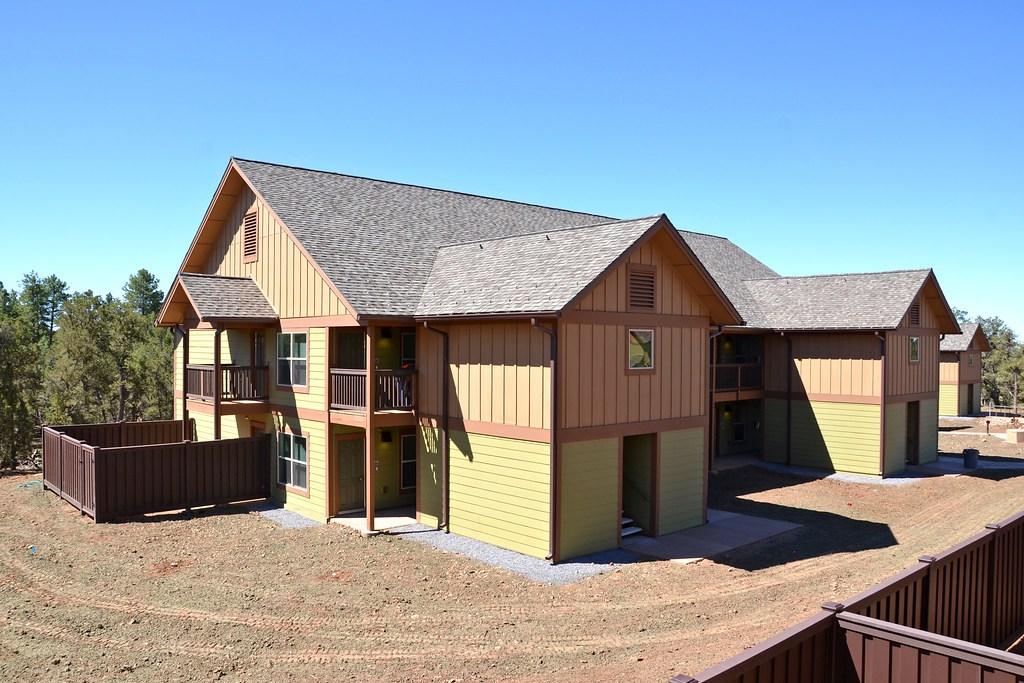
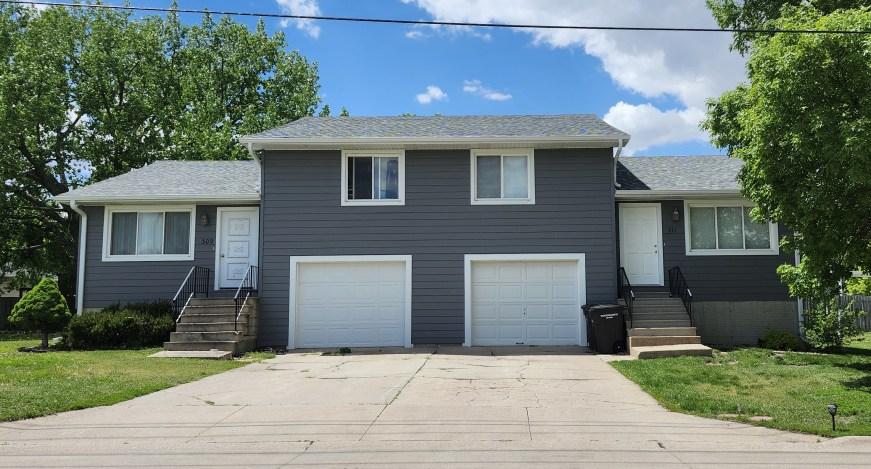
Adiversevarietyofhousingtypes within a community enables residents to more easily find housing which fits the current needs of their household. Hastings has a comparable housing stock compared to the overall State of Nebraska. As shown in Table 4.2, 70.4% of Hastings’ housing is single-family detached units, compared to 72.0% in the overall state, a difference of 1.6%. Hastings does have significantly more Tri– or Quadplex (3 or 4 units) than the overallstateaswell.
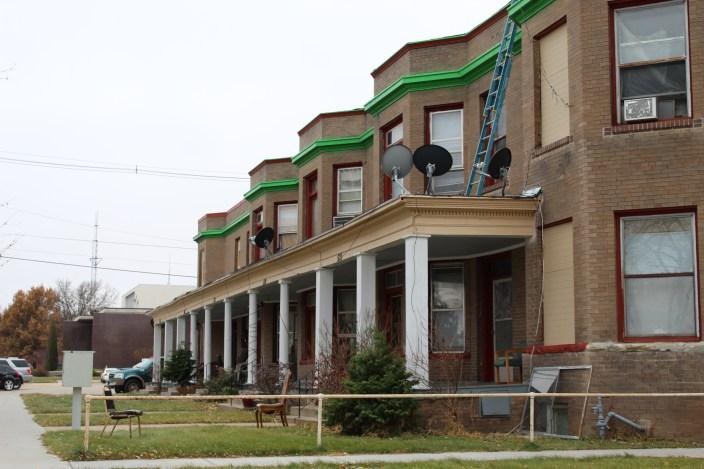
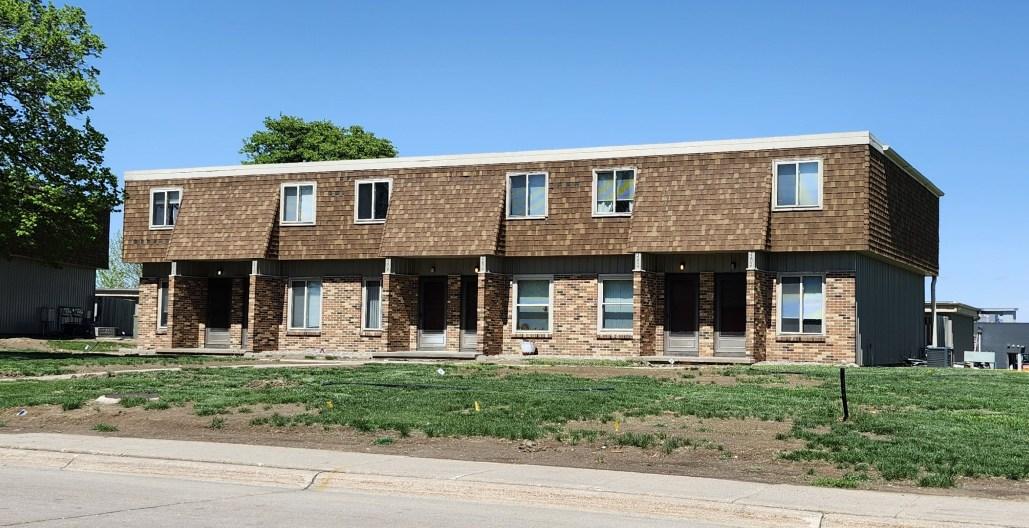
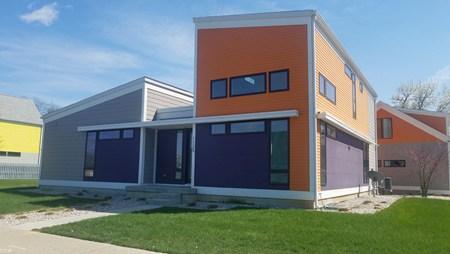
“Missing middle” units are also better represented in Hastings compared to the overall state. These house-scale buildings fit seamlesslyintoexisting residential neighborhoods and support walkability, locally-serving retail, and public transportation options.
As Daniel Parolek notes in his book Missing Middle Housing (2020), “These [housing] types have historically delivered attainable housing choices to middle-income
without subsidies and continue to play a
role in providing homes to the ‘middle income’ market segment that typically straddles 60% to 110% average median household income, in new construction,for-salehousing.”
Approximately 10.6% of Hastings’ housing meets the definition of Missing Middle Housing (townhouse, duplex, triplex), compared to just over 4% within the entire state. Hastings is better represented compared to the State.
Figure 4.4: Age of Existing Housing Stock, 2022
Source: ACS 5-Year Estimates 2022
Table 4.2: Existing Housing Types, 2022
Source: ACS 5-Year Estimates 2022
Inadditiontoavarietyofhousing types, choices in number of bedrooms is important to ensure the housing stock is appropriate for the size of a community’s families and households. The mix ofbedroomdiversityinHastingsis similar to the state overall as illustratedinTable4.3.
Vacancy Rates
A housing market is considered healthy when the effective vacancy rates are between 5% to 7%. This ensures an adequate product for new housing moving intoacommunityandforexisting residents to move into housing which better supports their household needs. A constrained housing market leads to price escalation, potential difficulties in attracting workers to a region, exasperatingatightlabormarket and hampering economic growth. The lack of available housing may also cause frustration from existing residents who may not find the desired product for their current lifestyle and may choose to leave the community in search of housing fittingtheirneeds.
Conversely, a housing market with high vacancy rates can be problematic for a community. High vacancy rates may place downward pressure on for-sale and rental housing. While lowercost housing is advantageous for renters and home buyers; it can resultinlessoperatingincomefor rental housing and less ability to borrow against a home’s equity, leading to deferred maintenance and or home improvements.
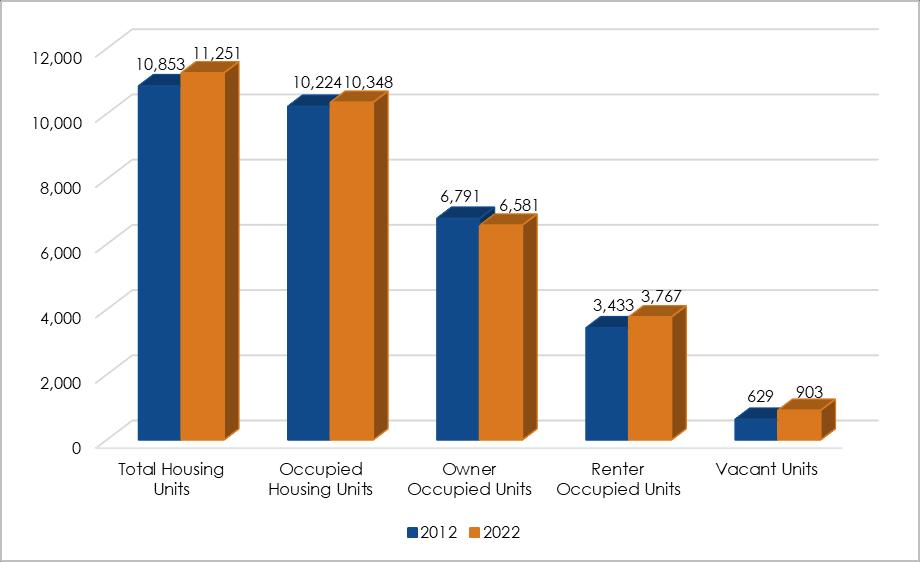
The ACS-estimated number of occupied housing units in Hastings grew from 2012 to 2022, while the number of vacant units grewaswell.Thenumberof
Sources: ACS 5-Year Estimates 2012 and 2022
Table 4.3: Number of Bedrooms, 2022
Figure 4.5: Occupied vs. Vacant Housing Units, 2012 and 2022
Source: ACS 5-Year Estimates 2022
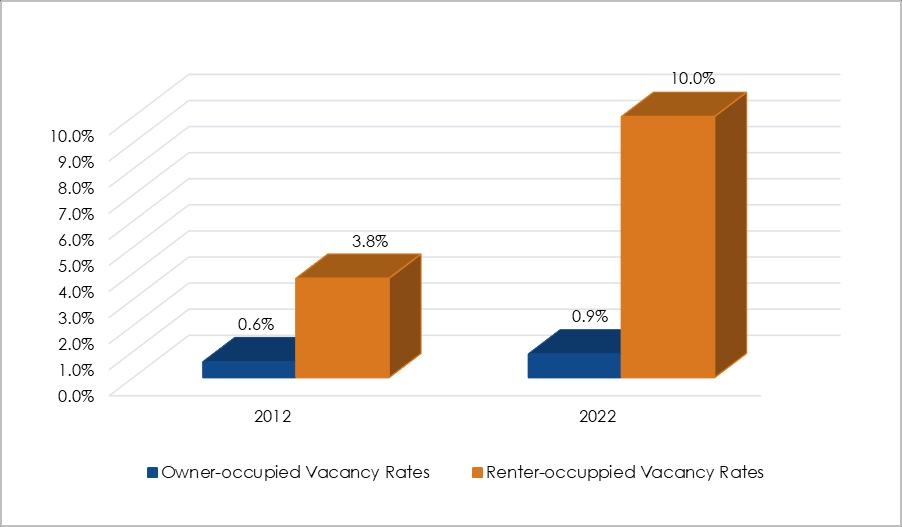
Sources: ACS 5-Year Estimates 2012 and 2022
Figure 4.6: Vacancy Rates by Type of Unit, 2012 and 2022
Housing
owner-occupiedunitsdecreased slightlyto6,581whilethenumber of renter-occupied units increased more significantly to 3,767 (Figure 4.5). The vacancy rate for owner-occupied units grew from 0.6%to0.9%, whilethe vacancy rate for renteroccupied units increased greatly from 3.8% to 10.0% (Figure 4.6). Anincreaseinrentalvacanciesis likely attributed to less college students being enrolled during theCOVID-19pandemic.
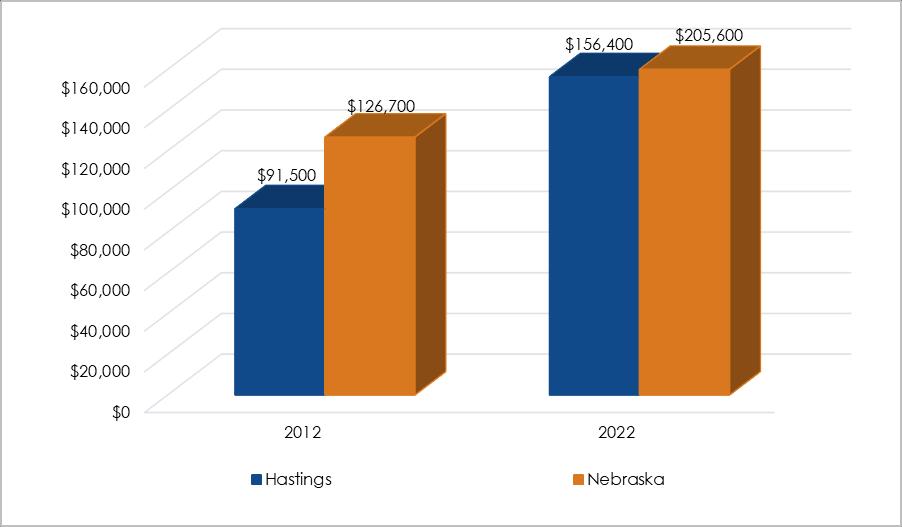
Over the same time period, the State’s median value had increased from $126,700 to $205,600. The median value in Hastings grew by 70.9% over the time period, which was a higher increase than the growth the statesaw(nearly63.0%).
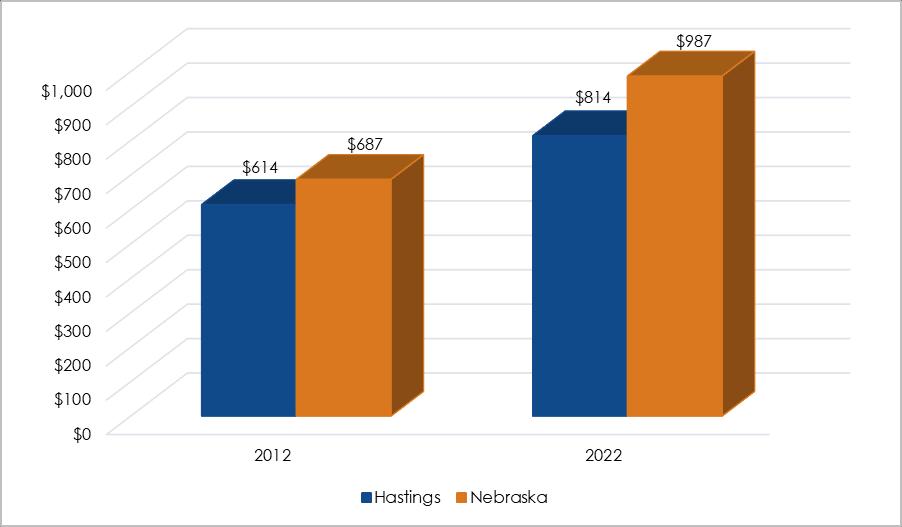
Median gross rent in Nebraska increased by 43.7% between 2012and2022.Mediangrossrent in Hastings grew, but at a considerablylesserrate(32.6%).
Housing Conditions
If properties are allowed to fall into disrepair either because the owner does not have the resources to maintain the structure or simply through neglect, properties can become highly dilapidated. At some point, if there is no intervention, it maycostmoretorehabilitatethe structure than is economically feasible and in many of those cases, these properties become abandoned.
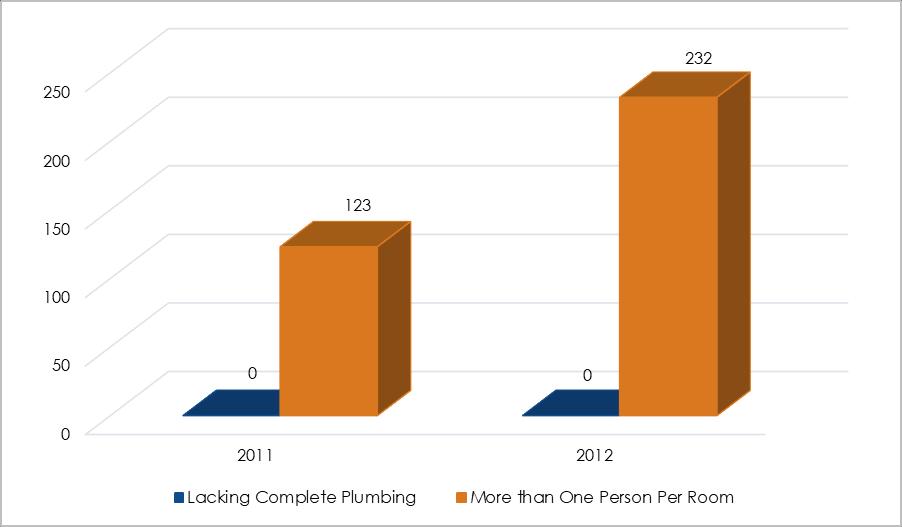
According to the U.S. Department of Housing and Urban Development (“HUD”) guidelines, housing units lacking complete plumbing or are overcrowded are considered substandard housing units. HUD defines a complete plumbing
Figure
4.7: Median Value Owner-Occupied Units, 2012 and 2022
Source: ACS 5-Year Estimates 2012 and 2022
Figure 4.8: Median Gross Rent, 2012 and 2022
Source: ACS 5-Year Estimates 2012 and 2022
facility as hot and cold-piped water, a bathtub or shower, and a flush toilet; overcrowding is more than one person per room. Inaddition,anytimethereismore than 1.0 persons per room, the housing unit is considered overcrowded,thussubstandard.
When applied to Hastings, 123 units were considered substandard in 2012 and 232 units were substandard in 2022 (Figure 4.9 on the next page).
Some housing units may have met both criterion and were effectively counted twice. Even so, the City should not assume the number of substandard housing units are overestimated. Housing units containing major defects requiring rehabilitation or upgrades to meet building, electrical, or plumbing codes should also be included in an analysisofsubstandardhousing.
At-Risk Households
A key factor to examine is householdsatrisk ofenteringinto a housing crisis, becoming homeless, or due to income constraints not able to maintain theirhousing.
Poverty
The poverty rate estimate by the ACS in 2022 is higher for Hastings (14.0%) than the overall poverty rate in Nebraska (10.4%). Those households tend to be the highest risk for homelessness because they are living on the financial edge and may have issues of income, food, and housinginsecurity.
Cost-Burdened Households
The U.S. Department of Housing and Urban Development defines cost burdened households as thosespendingmorethan30%of their household income on housing costs. Severely cost burdened households are those spending 50% or more of their household income on housing costs. Housing costs include mortgageorrent,andutilities.
As Table 4.6 illustrates,over 13.2% of Hastings’ households are considered cost-burdened and an estimated 10.9% are severely cost-burdened.
Affordable Housing Plan
The City of Hastings adopted an Affordable Housing Plan on December 12, 2023, as required by Nebraska State Statutes 195501 to 19-5506 (LB 866 - The Municipal Density and Missing Middle Housing Act). These statutes require cities to adopt plans addressing goals for construction of affordable and accessible housing, increasing missing middle and multi-family
Goal 4.3: Development costs are reduced where possible.
Actions
4.3.1:ExplorepartnershipswiththeNebraskaManufacturedHousingAssociationtoworkwithlocalhousing manufacturers to develop a palette of neighborhood context sensitive home plans that can be constructedoninfilllots.
4.4.1: Work with existing subsidized housing owners to ensure their properties are well-maintained and the affordableunitsarepreserved.
4.4.2: Work with affordable housing developers to create additional rental housing for very-low income families.
4.4.3:ExploreestablishinganLB424LandBank.
Page Intentionally Left Blank
Chapter 5 Economic Profile
Economic Profile
Economic development is a processofinvestmenttoincrease the well-being of a community. The creation of new enterprises and the retention and expansion of existing businesses enables the creation of jobs for current and new residents, and provides new sourcesofincome.
A diversified economic base enablesa communitytorespond to changing economic conditions, increase local income,createjobopportunities, and improve the quality of life of a community. As Edward Hill of The Ohio State University wrote in Economic Development Quarterly (2023): “Economic development introduces new goods and services into a region's portfolio of traded products or expands the productivecapabilitiesofexisting members of a region's economic base.”
In this section, income and employment data and trends are presented and analyzed for Hastings,AdamsCounty,andthe state of Nebraska. This section also contains a more detailed analysis of commercial real estatetrends.
Many economic data sources onlycovercounties,metropolitan statistical areas (MSAs), and states. City-specific data is consideredwhenavailable.
Source:MarvinPlanningConsultants
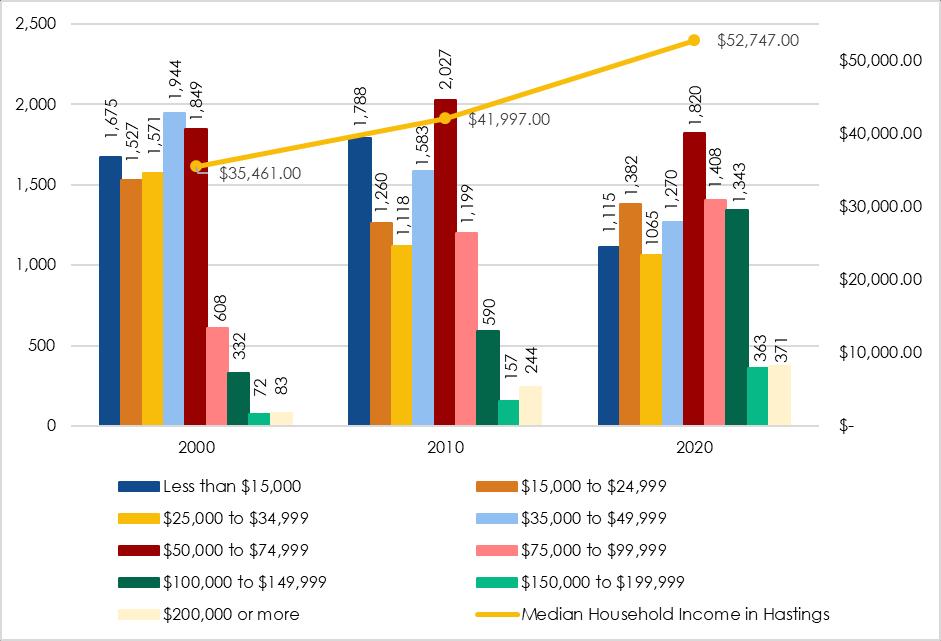
5.1: Household Income, 2000-2020
Sources: US Census Bureau 2000, ACS 5-Year Estimates 2010 and 2020
Income Statistics
Income statistics for households are important in determining the earningpowerofhouseholdsina community. These data were reviewed to determine whether households experienced income increases at a rate comparable to the state of Nebraska and the ConsumerPriceIndex(CPI).
Figure 5.1 indicates the number of households in each income range for Hastings from 2000 to 2020. The household income range most commonly reported foreachtimeperiod was$35,000 to $49,999 (20.1% of all households), $50,000 to $74,999 (20.3% of all households), and
$50,000 to $74,999 (18.0% of all households),respectively.
Those households earning less than $15,000 accounted for 17.3%, 17.9%, and 11.0% of all households for the three time periods, respectively. These households account for the poorest of the poor in the city. In addition, the households earning lessthan$35,000madeup49.4%, 41.8%, and 35.1% of all households for the time period in Hastings,respectively.
The median household income for Hastings was $35,461 in 2000, which was $3,789 less than the state’s median income of $39,250. By 2010, the median
household income increased to $41,997 (an increase of 18.4%), which was nearly $8,000 lower than the state’s median household income of $49,342. By 2020, the median household income had risen again to $52,747, which was a rise of 25.6% from 2010. The city’s median household income had still not surpassed the state’s median household income of $63,015by2020.
The CPI rose 50.5% over the time period, which indicates household incomes in Hastings did not exceed inflation. Over the time period, household incomes increased by 48.7% in the city. However, household
Figure
Economic Profile
incomes in Nebraska rose by 60.5%,thusexceedingtherateof increaseinCPIinthestate.
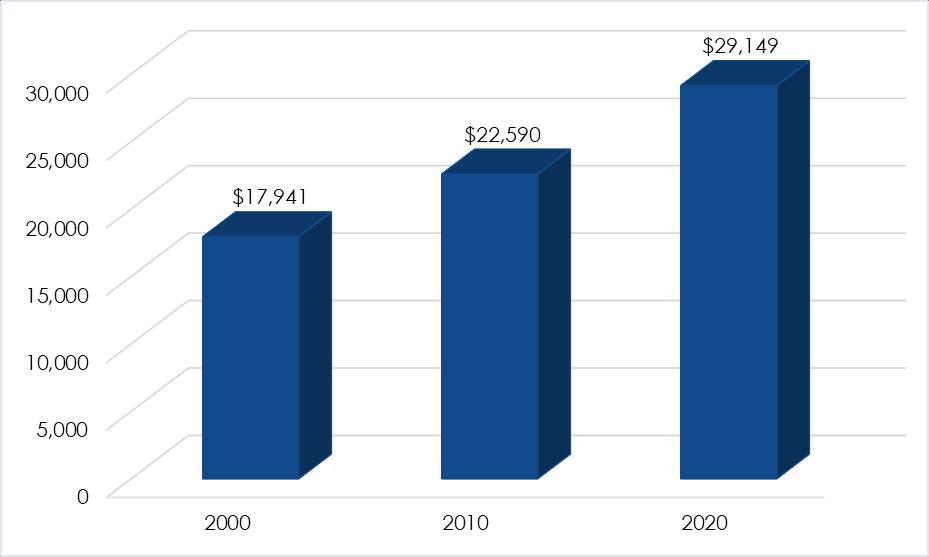
Per Capita Income
The per capita income in Hastings increased from $17,941 in 2000 to $29,149 in 2020, or an increase of 62.5%, which was greater than the CPI for the period. Hastings’ per capita income in 2000 was 91.5% of the state per capita income of $19,613 and by 2010 the city dropped to 91.3% of the state’s per capita income level of $24,744. Finally, in 2020, per capita income in Hastings was up to 87.8% of the state of Nebraska’s per capita income ($33,205).
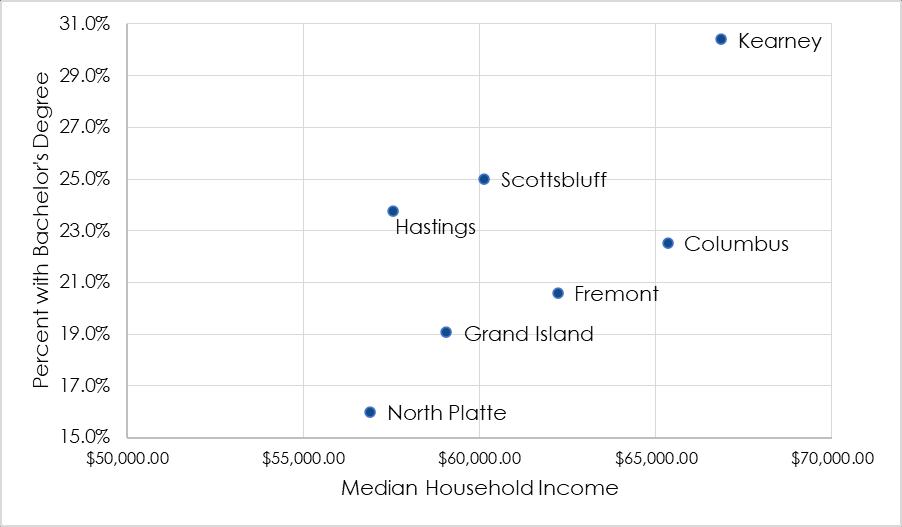
Income and Education
With occasional exceptions, income and higher educational attainment tend to be highly correlated. Figure 5.3 plots Hastings and comparison areas (the Tri-Cities region and peer cities) based on median household income and percent of adults (age 18 and above) with bachelor’s degrees or higher. Hastings had the third highest amount of population with bachelor’s degrees or above. However those residents had the second to lowest median household incomes of the comparison areas. Note not all higher paying jobs require college degrees. The Kearney datapointisanoutlierduetothe presence of the University of Nebraska-Kearney.
Sources: US Census Bureau 2000, ACS 5-Year Estimates 2010 and 2020
Figure 5.3: Income by Educational Attainment, 2022
Source: ACS 5-Year Estimates 2022
Figure 5.2: Per Capita Income, 2000 - 2020
Sales Tax
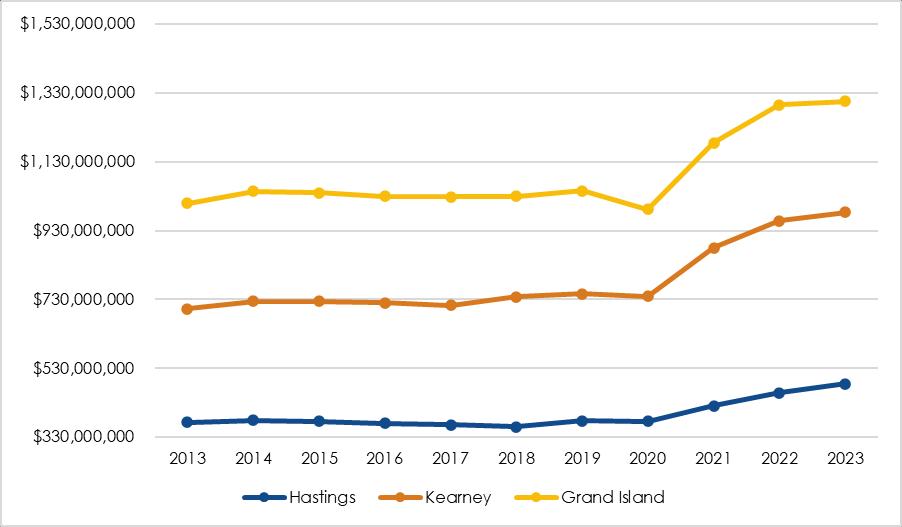
Increasing income tends to result in increasing retail sales, providingabaseforemployment and income for local residents. Retail sales also drive local sales and use tax receipts for municipalities and the State of Nebraska. The City of Grand Island has adopted a local rate of 2.0%. The City of Kearney and the City of Hastings have adoptedlocalratesof1.5%.
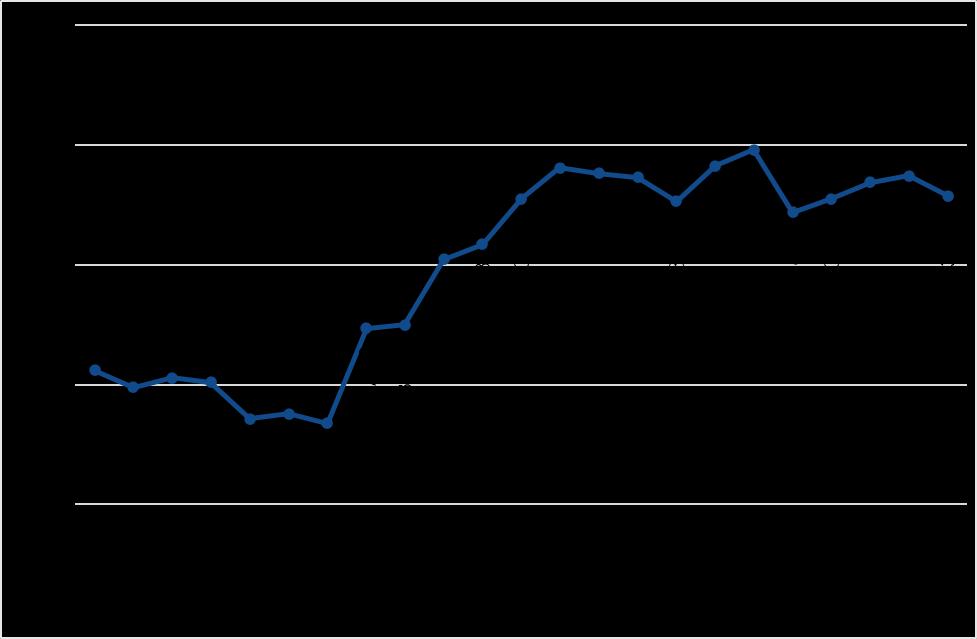
According to the Nebraska Department of Revenue, Net Taxable Sales in Hastings have grown from over $373 million in 2013 to over $484.7 million in 2023, an increase of 29.8% (Figure 5.4). Kearney realized a much higher level of sales - $983 million in 2023 - bringing the tenyear trend up to an increase of 39.9%. Grand Island sales grew from just over 1 billion in 2013 to just over 1.3 billion in 2023, an increase of 29.3%. The retail options in Kearney and Grand Island, as well as larger populations, are likely reasons why the net taxable sales were considerably higher in the other Tri-Cities.
However, it should be noted that NetTaxableSalestookalargehit across the board during the COVID pandemic in 2020. The overallimpactsofthepandemic, along with shifts towards online sales, will continue to bear watching.
Labor Force Characteristics
In this section, labor force and unemploymentwillbeexamined. The following definitions were taken from the Bureau of Labor Statistics.
Figure 5.4: Net Taxable Sales, Hastings and Tri-Cities, 2013-2023
Source: Nebraska Dept. of Revenue, Non-Motor Vehicle Sales Tax Collections
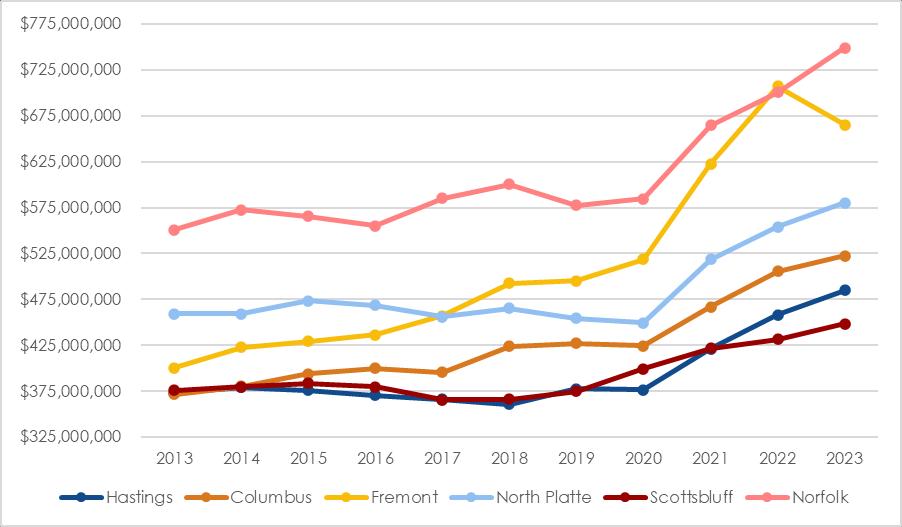
Figure 5.5: Net Taxable Sales, Hastings and Peer Communities, 20132023
Source: Nebraska Dept. of Revenue, Non-Motor Vehicle Sales Tax Collections
The labor force includes all people ages 16+ who are classified as either employed or unemployed. People are classified as unemployed if theydonot have a job, have activelylookedforworkinthe prior 4 weeks, and are currentlyavailableforwork.
Labor Force Participation Rate
The labor force participation rate is the proportion of the workingage population that is either working or actively looking for work. The unemployment rate is the remainder of the labor force participation rate from 100%. This rate is an important labor market measure because it represents the relative amount of labor
Economic Profile
resources available for the production of goods and services (Bureau of Labor Statistics). This rate is calculated by dividing the total Employed personsbythetotalLaborForce.
The unemployment rate in Hastings is middle of the pack compared to the Tri-Cities. Kearney had the lowest unemployment rate in 2022. Hastings fared better compared to the peer communities, tied with Fremont and Norfolk at 2.2% unemployment rate. Data were not available for Scottsbluff and Columbus.
Industry Employment
Employment by industry data assists in understanding the key generators of income. The Bureau of Economic Analysis (“BEA”) tracks employment by county. The total annual average number of jobs in Adams County grew from 20,625 in 2012 to 21,473 in 2022, a 4.1% growth rate (Table 5.3). This includes people who live elsewhere and commute into Adams County. While there were impacts from the pandemic in 2020,unemploymentinNebraska decreased by 1.6% in the same decade.
Manufacturing had the largest number of jobs, 3,060 in 2022, up 28.9%over2012.Wholesaletrade contracted by –10.6% to 763 in 2022, the largest decrease seen over the time period. Farm employment in the county decreased slightly over the time period.
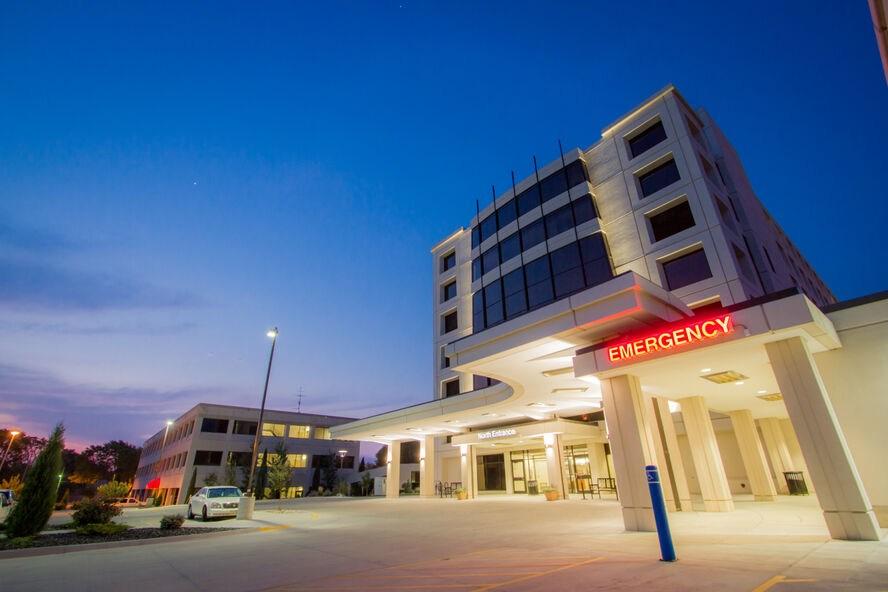
Health Care is the largest employment sector in Nebraska statewide. This is true for Hastings as well, as Mary Lanning Healthcare has historically been
Table 5.1: Labor Force Participation Rate, Hastings and the Tri-Cities, 2012 and 2022
Table 5.2: Labor Force Participation Rate, Hastings and Peer Communities, 2012 and 2022
one of the largest employers in the city.Over the 10 year period, thislikelystayedtrue.
Source: NEWorks 2012 - 2022
Source: NEWorks 2012 - 2022
Employment by Place of Residence
The ACS estimates employment statistics for the people who live in an area. These represent people who live in the city of Hastings, whether they work in the city or commute outside the city. If more people are employed in an industry, it may indicate opportunities for local jobcreation.
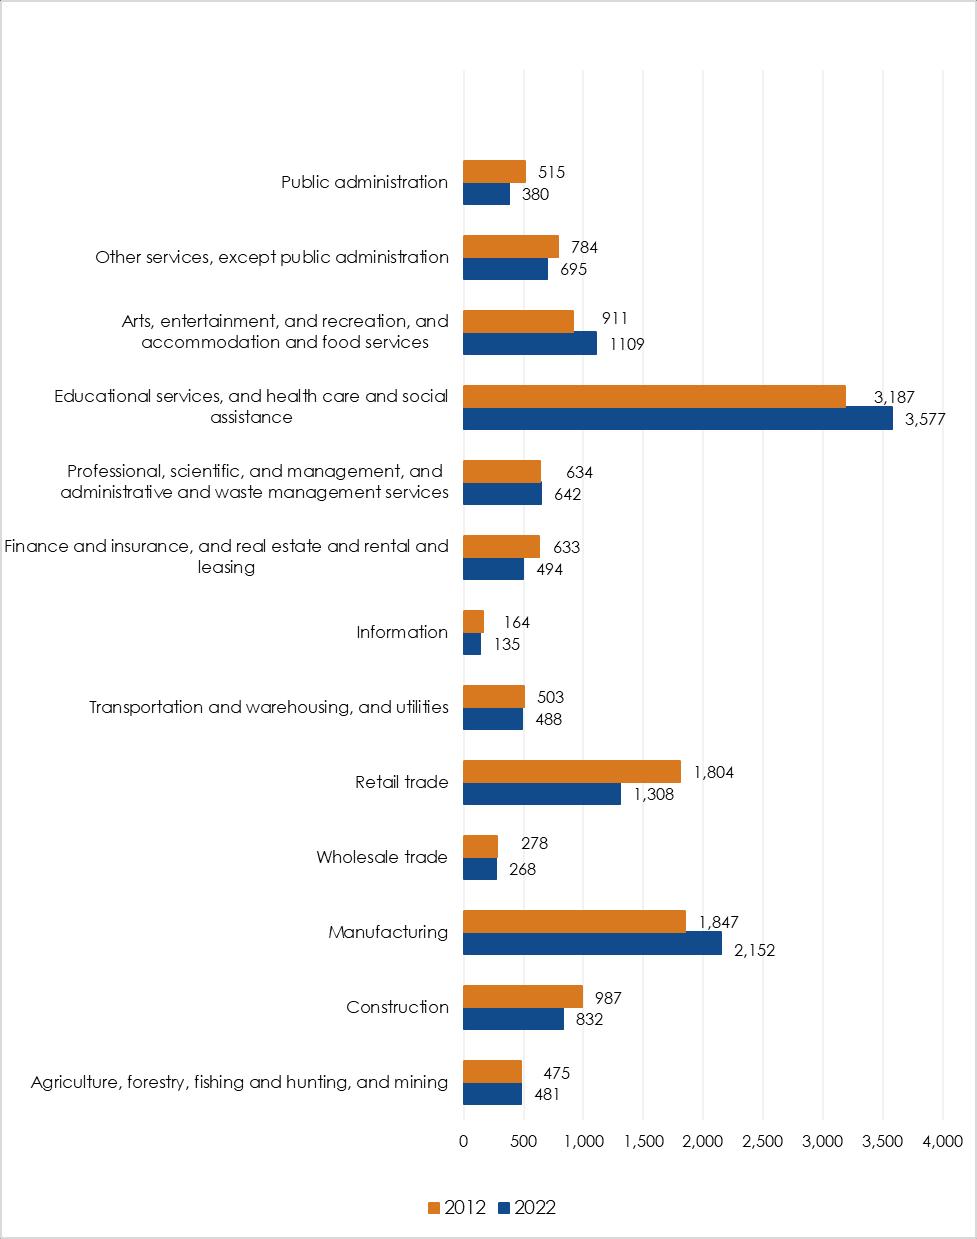
In Hastings, 3,577 residents reported they worked in the Educational services, and health care and social assistance industryin 2022 (Figure 5.6).While Table 5.3 did not show data for those who worked in this sector, these employment numbers suggest how important Mary Lanning Healthcare is to the city and region. Retail trade and manufacturing are the next highest employment sectors in Hastings. Retail trade contracted over the time period. With more retail options in Kearney and GrandIsland,thisisnotsurprising.
Major Employers
According to Hastings Economic DevelopmentCorporation,major employers in Hastings include manufacturers, healthcare, education, and government jobs. The top manufacturer jobs include:
• ThermoKing;
• WRReserve;
• Dutton-LainsonCompany;
• T-LIrrigation;
• FlowserveInc.;
• AgProcessingInc.;
• PaperworksIndustries;
• CentennialPlastics;
• A1Fiberglass;
• NebraskaAluminumCastings;
• FlandersProvision;
• ChiefEthanolFuels,and;
• HastingsIrrigationPipe
5.6: Hastings Residents’ Employment by Industry 2012-2022
Source: ACS 5-Year Estimates 2012 and 2022
The top non-manufacturing jobs include:
• Mary Lanning Memorial Hospital;
• HastingsPublicSchools;
• GoodSamaritanVillage;
• CentralCommunityCollege;
• USMeatAnimalResearch;
• HastingsCollege;
• CityofHastings;
• HastingsUtilities,and;
• AdamsCounty
Commuter Trends
Hastings is part of a regional job market, with some local residents leaving the city to commute to work elsewhere in the Tri-Cities Regions, while others commute into Hastings from their homes in Adams County or further away. The ACS estimates that in 2022, 27.3% of Hastings residents left the city to work each day, and 17.0%leftAdamsCountytowork.
Figure
Economic Profile
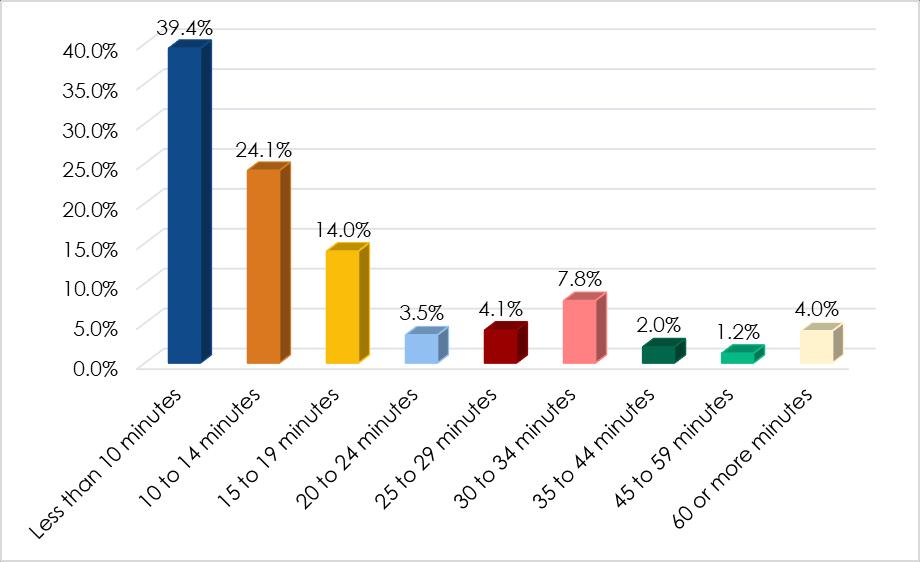
Traveltimetoworkaffectsquality oflife.Ifcommutetime becomes excessive,peoplemayseekwork closer to home or leave the community to move closer to their workplace. 22.5% of people travel more than 20 minutes to work (5.2% travel 45 minutes or more). About 39.4% of commuters traveled 10 minutes orlesstowork,including the3.8% who worked from home (Figure 5.7).
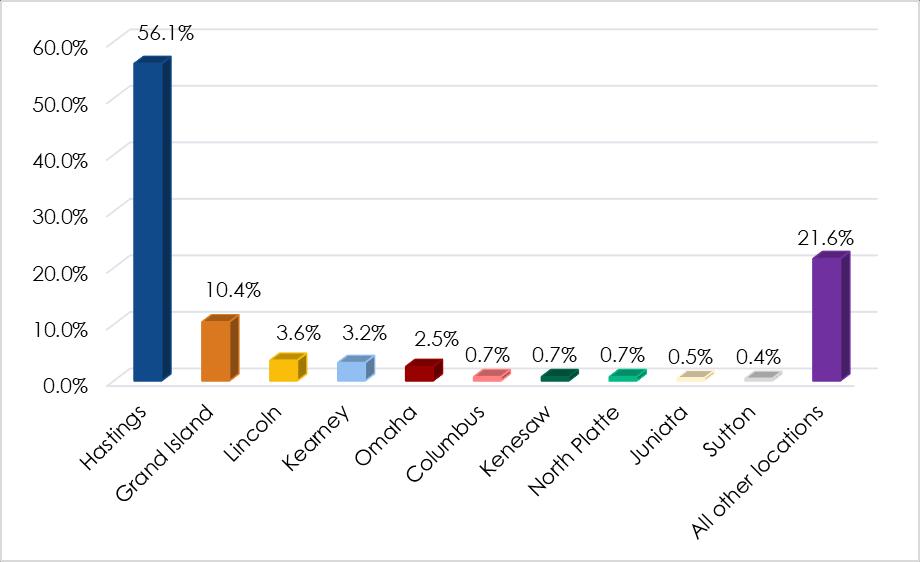
Figure 5.8 shows where people travel to for work. The vast majority (56.1%) stay in Hastings. About 13.6% of persons travel to the Tri-Cities. Juniata and Kenesaw are both within Adams County (the former being adjacent to Hastings to the west),whileSuttonisa shortdrive to the east in Clay County. The larger cities of Lincoln, Omaha, North Platte, and Columbus are outliers, attracting a minimal amount of workers. “All other locations” can include out state jobs in Kansas, South Dakota, or Colorado. This data does include persons who call Hastings home but may commute during the week, or work from Hastings and their job is in a place such as Omaha.
Sources: ACS 5-Year Estimates 2022
Figure 5.8: Employment Location
Sources: US Census Bureau OnTheMap 2021
Figure 5.7: Travel Time to Work, 2022
Goals and Actions
Goal 5.1: The City has a strong economy supporting new business and retention & expansion of existing business.
5.2.3: When economically feasible, proactively extend public utilitiesto reduce the costs of development andencouragedevelopmentinappropriateareas.
Goal 5.3: The City is responsive to employers considering relocation.
Actions
5.3.1: Work with Hastings Economic Development Corporation and the Hastings Chamber of Commerce todevelopacommunityprofilepublicationwithdemographic,housing,andeconomic statisticsfromthis planforsiteselectorsandprospectiveemployers.
5.3.2: Continue to post community profiles, planning & zoning requirements, and other development informationontheCityofHastingswebsite.
5.3.3: Work with Nebraska Department of Economic Development and the Hastings Economic DevelopmentCorporationtoberesponsivetopotentialrelocationtargets.
Chapter 6 Community Facilities
Hastings’ Facilities
State and local governments provide a number of services to their citizens. These services are provided in a wide range of buildings owned and maintained bydifferentlevelsofgovernment. Such facilities are provided to ensure the safety, wellbeing,and enjoyment of the residents of Hastings. These facilities and services provide residents with social, cultural, educational, and recreationalopportunities.
It is important for all levels of government to anticipate the futuredemandfortheirservicesif the city is to remain strong and vital. The examination of existing facilities and future services are contained in this chapter. Alternatively, in some instances, there are a number of services notprovidedbythelocalorstate governmental body and are provided by non-governmental entities, private organizations, or non-profits for the community as a whole. These organizations are
important providers of services and are an integral part of the community.
Facilities Plan
The FacilitiesPlan reviews present capacities of all public and private facilities and services. To determine if these facilities are sufficient for future populations, “The Planner’s Estimating GuideProjecting Future Land-Use and Facility Needs” was used as reference. Thisguide is written for planners to determine level of service within their communities, basedonnationalstandards.
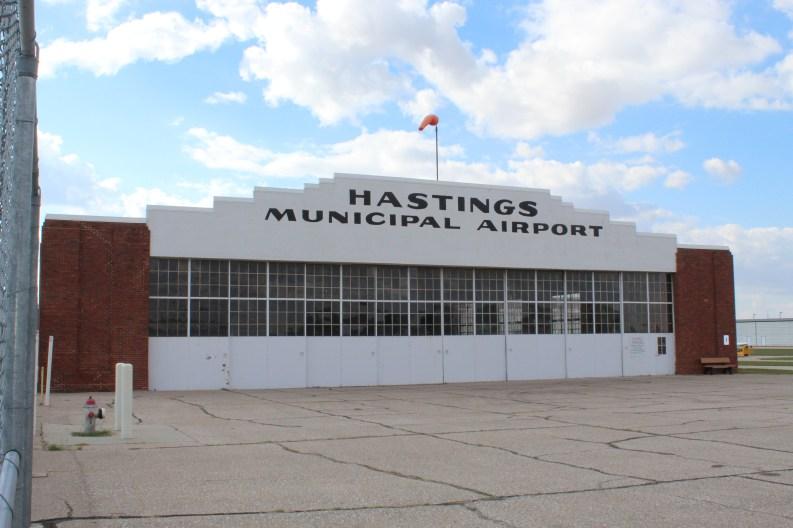
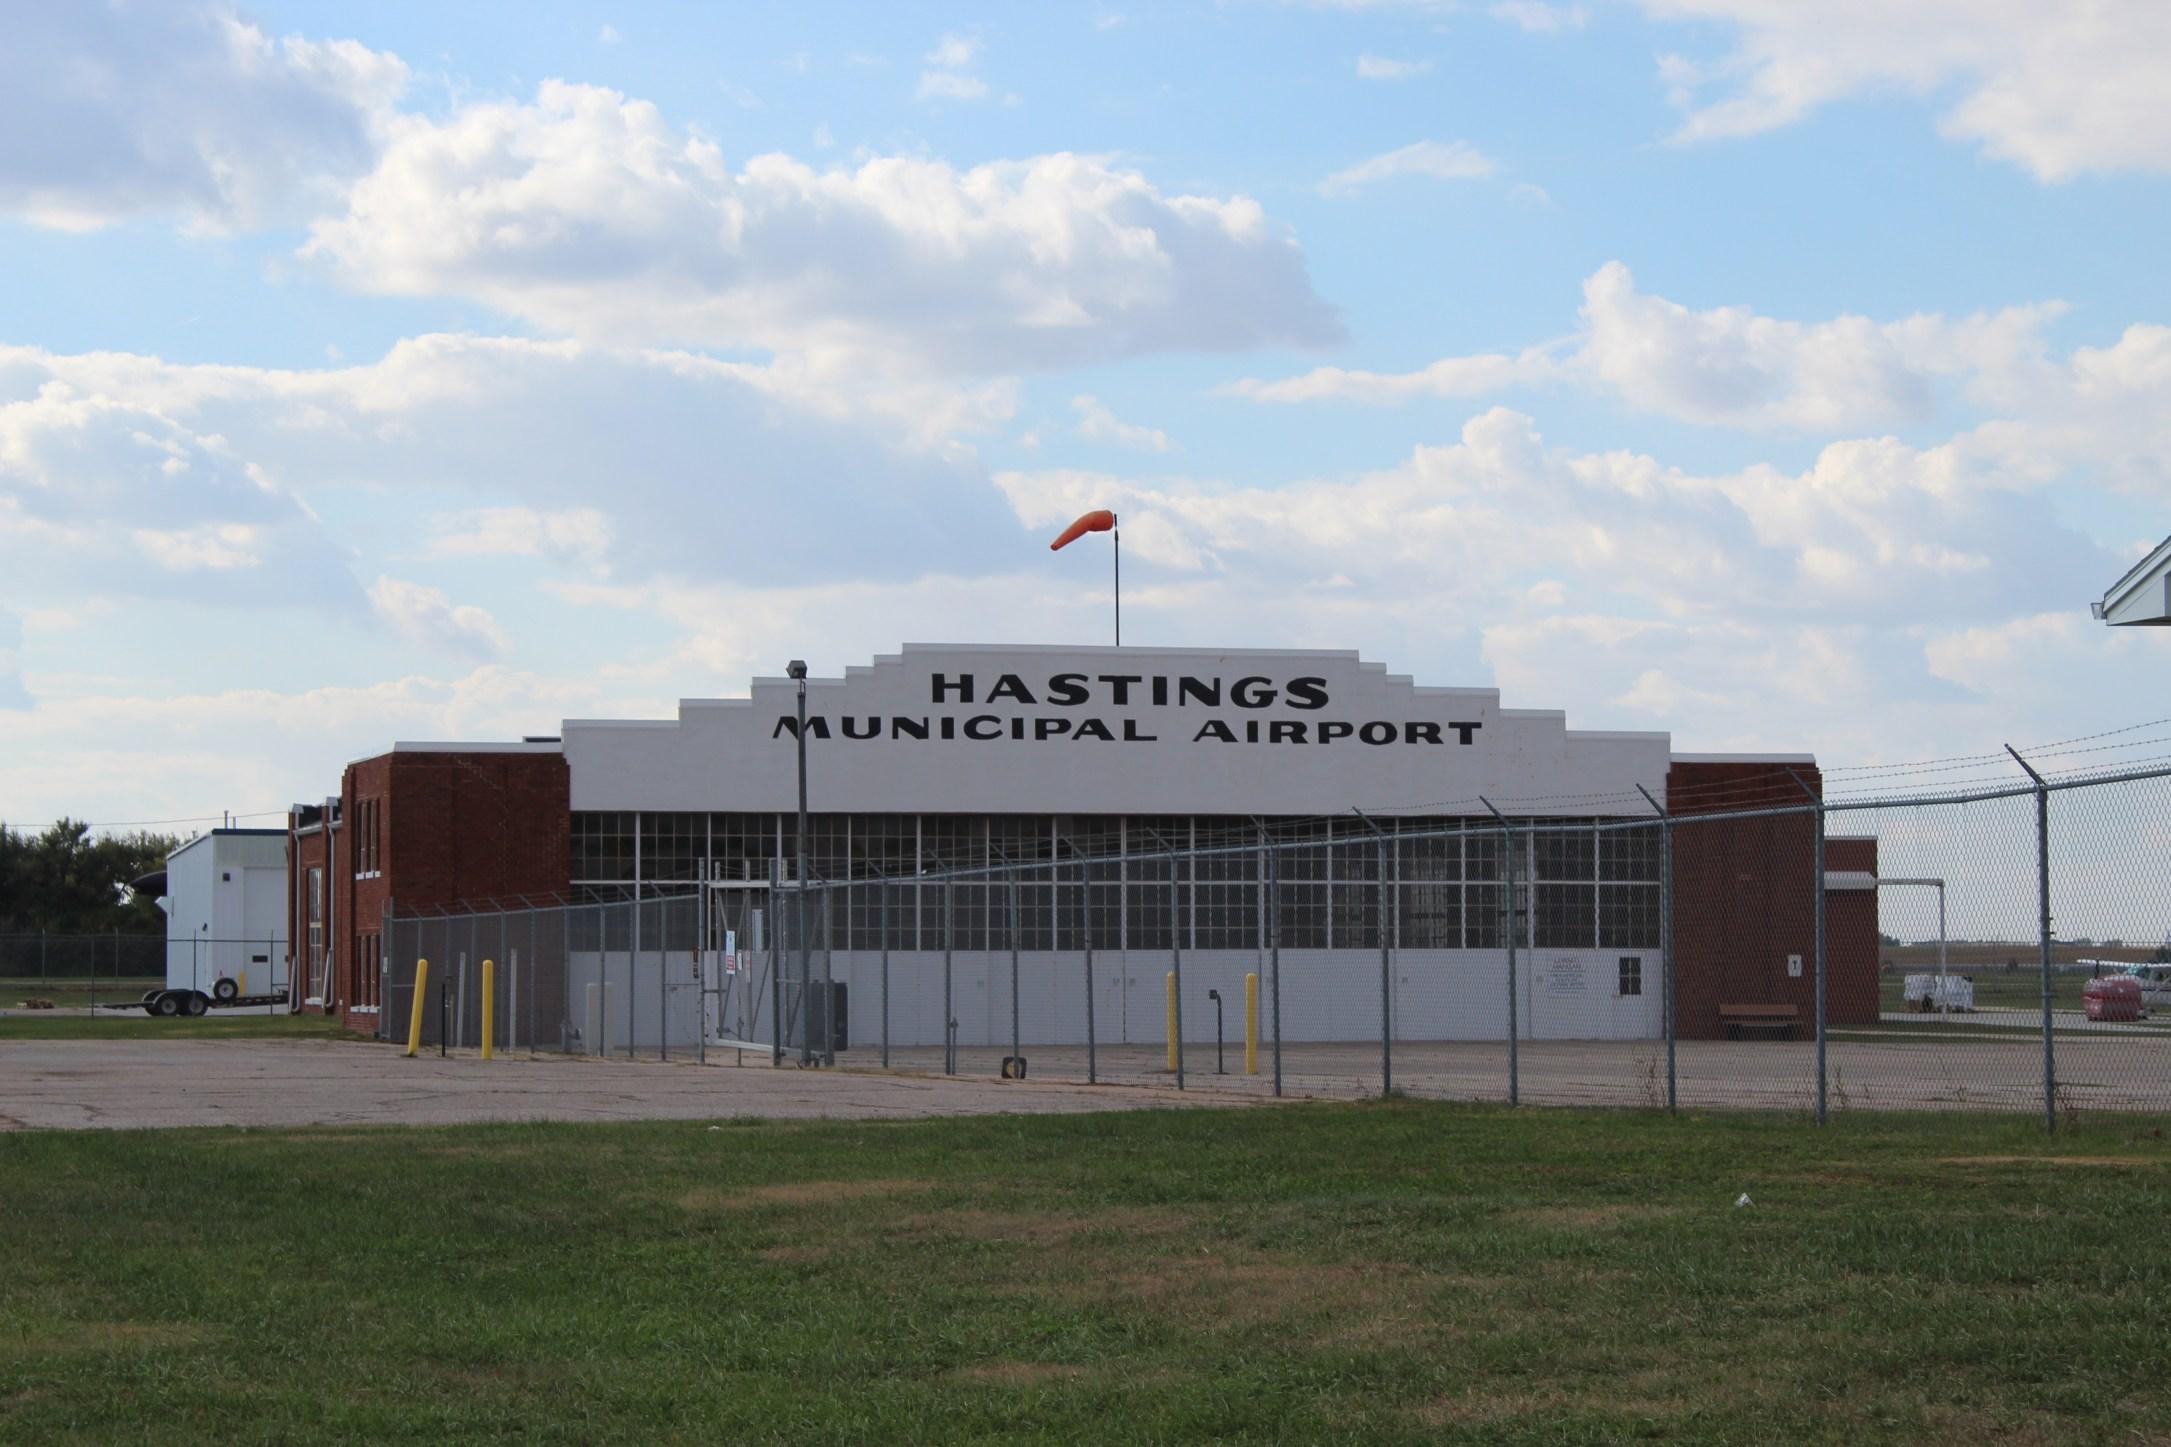
The Facilities Plan for Hastings is divided into the categories of City Facilities and Education. While the Hastings Municipal Airport and Pollution Control Facility(presentonFigure6.4)are City owned, they will be discussedinlaterchapters.
Data Variations
The data presented about college students reflects
decreased attendance during the COVID-19 pandemic. The pandemic caused a dramatic reduction in in-person attendance as well as overall enrollment.
City Facilities
Hastings City Offices HastingsCityOfficesarecurrently split between three locations after the closing of City Hall at 220 N Hastings Ave. Departments are now split between the Landmark Center at 2727 W 2nd St, 3505 Yost Ave, and 1228 N Denver Ave. City Hall is facing significant renovations,which the public showed support for in 2023.
As these facilities are currently being renovated, level of service was not investigated. However, into the future, the City must meet the needs of future populations with the future City Offices.
Source: cityofhastings.org
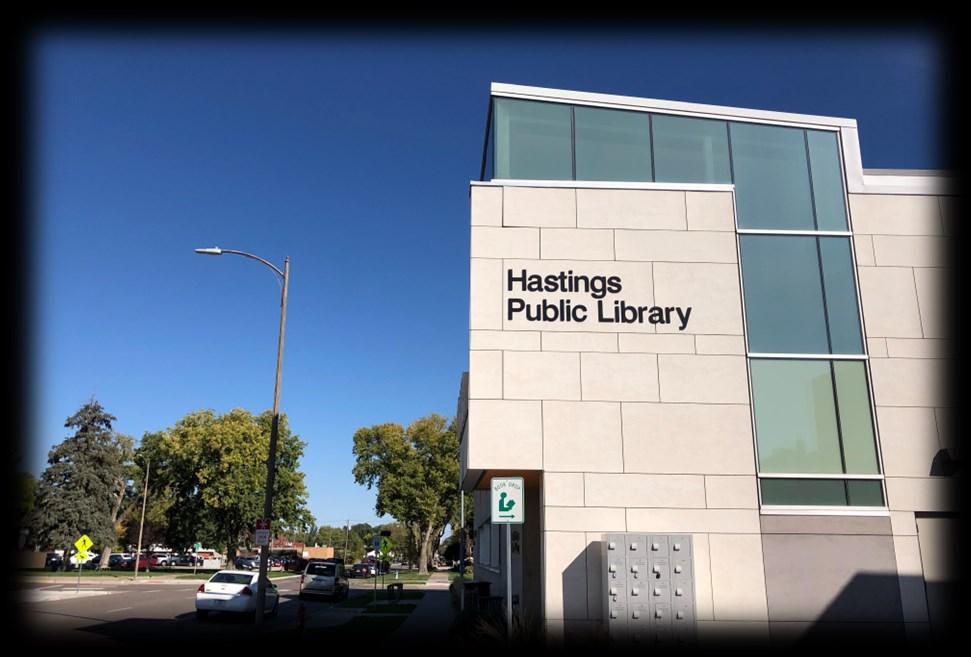
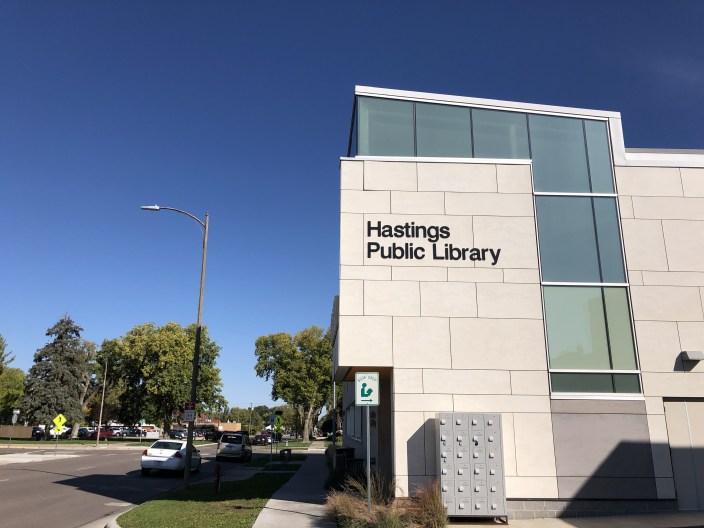
Library
The Hastings Public Library, pictured on page 35, is located at 314 N Denver Ave. The Library was first built in 1962. In 2017, renovations were completed to the facility, adding 2,500 square feet to the 29,000 square foot facility. The renovations won the AIA/ALALibraryBuildingawardin 2018. The Library also hosts skilled tradelicensingprograms.
With recent renovations, the City is meeting the needs of the community. In the future, the Library should be monitored to ensure it isstill meetingthe needs of the City, particularly in the technology sector. The City and Library should follow the American Library Association standards.
(Note: modified slightly from website.) Sources: aia.org; cityofhastings.org; Hastings Public Library
City Auditorium
The City Auditorium was built in 1924 at 400 N Hastings Ave. Amenities include a full kitchen with capability for catering, a balcony with theater seating, stage and arena for dancing and large events, ADA accessibility, and a drop down screen for video presentations. These amenities make the Auditorium a popular Hastings location for stage productions, conventions, seminars, receptions, and trade shows. The Auditorium can seat 1,668, with 800 on the main floor and 868 in thebalcony.
(Note: text modified from website.) Source: cityofhastings.org
Educational Facilities
Hastings Public School District
Hastings Public Schools (“HPS”) is home to an early learning center, five elementary schools, Hastings Middle School, and
Community Facilities
Figure 6.1: School Enrollment 2000-2023, Hastings Public School District
Source: Nebraska Department of Education
Hastings High School. The school district is highly decorated, having won a multitude of awards for student success, being a model school in the state and nation, contributing to the city, and having high wellness standards. Hastings Public Schools was granted District Accreditation from AdvancED Accreditation Commission.
Hastings Public Schools saw a peak student population of 3,740 studentsin2017-2018.Inaddition, thelow occurredduring the2006 -2007 academic year with 3,169 students. The total enrollment at HPSislargelymaximizedbecause of an interlocal agreement between HPS and Adams Central School District,which sets HPS’s district boundaries and doesnotallowittoexpand.
In 2020,Citizensin the HPSDistrict approved a bond to renovate the district’s facilities. The improvements created through the approved bond ensure that eachschoolbuildinghasenough
room to meet the needs of the students and teachers. Because of these improvements and the fact that the school district enrollment is largely set by the interlocal agreement, no new schools are planned for. If a building reaches its expected life cycle, and the District chooses not to repair and renovate the building, HPS has land available to construct new school buildings,asneeded.
Source: Hastings Public Schools
Adams Central School District
Adams Central Public Schools (“Adams Central”)is hometoan early childhood learning center, a newly constructed elementary school, and a junior/senior high school. Adams Central became the first former Class 1-Class 6 school district in the state to reach district accreditation throughAdvancEDAccreditation Commission. After the completion of Adams Central Elementary School, student enrollment nearly doubled. Before the building of the new elementary school, the
Community Facilities
population ranged between 445 to 467. After the addition of the new school, the population peaked at 1,005 in 2018-2019. The lowest student population was in 2006-2007, the first year of theelementaryschool’s building.
The School District anticipates an annual 1%growth rate.Based on this growth rate, the school district is currently not planning on any new school facilities. The District is in the process of updating athletic facilities and making other needed renovations to the existing buildings to meet the needs of thestudentsandteachers.
Source: Adams Central Public Schools
Hastings Catholic Schools
Hastings Catholic School System is home to an early learning center (Pre-Kindergarten), elementary school, and combined middle/high school. St. Michael Elementary is accredited through the Nebraska Department of Education (Rule 14). St. Cecilia Middle and High School has met the criteria for educational quality established by the AdvancED Accreditation Commission and the Nebraska Department of Education. Student enrollment at Hastings Catholic School System is currently around 400 students. This enrollment total has remainedsteadysince2010.
In2022,theSchoolSystembegan renovation of the St. Cecilia Middle and High School, which included renovations. This construction project modernizes and expands the school for current and future students. The middle and high school is in a campus setting where the Catholic School System controls a majority of land within the four
Source: Nebraska Department of Education
Source: Nebraska Department of Education
blocks it is situated on. The School System should consider creating a campus master plan for its facilities and rezoning its land to the Campus Master Plan (“CMP”) zoning district to better organize the school site and allow for future changes. As land withinthisareaisacquiredbythe school, these lots can be made part of the CMP, which will also improve the effectiveness of the districtandtheschool’smaster
plan. As a school, naturally attending to pedestrian access for student safetyand enjoyment should be a focus of this campus master plan. Being adjacent to Mary Lanning Healthcare there is a good opportunity to coordinate pedestrian amenities between the two campuses for the betterment of both organizations and the community.
Source: Hastings Catholic School System
Figure 6.3: School Enrollment 2002-2023, Hastings Catholic Schools
Figure 6.2: School Enrollment 2000-2023, Adams Central School District
Hastings College
Founded in 1882, Hastings College is a private, four-year residential institution affiliated with the Presbyterian Church (USA)andistheonlyPresbyterian College in Nebraska. Hastings College has been accredited by the Higher Learning Commission of the North Central Association of Colleges and Schools since 1916, the National Association of Schools of Music since 1947, and the National Council for the Accreditation of Teacher Educationsince1964.
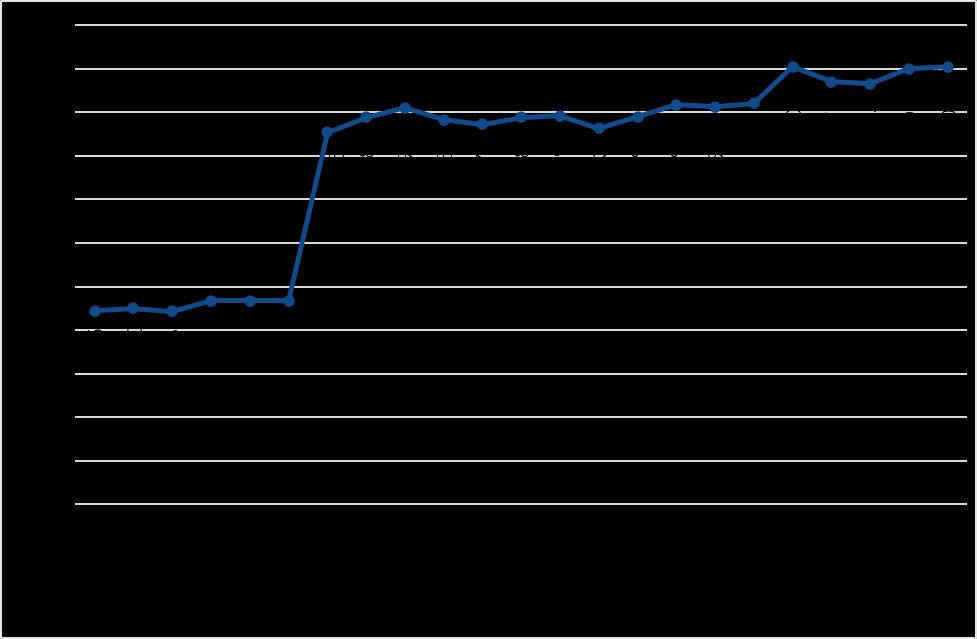
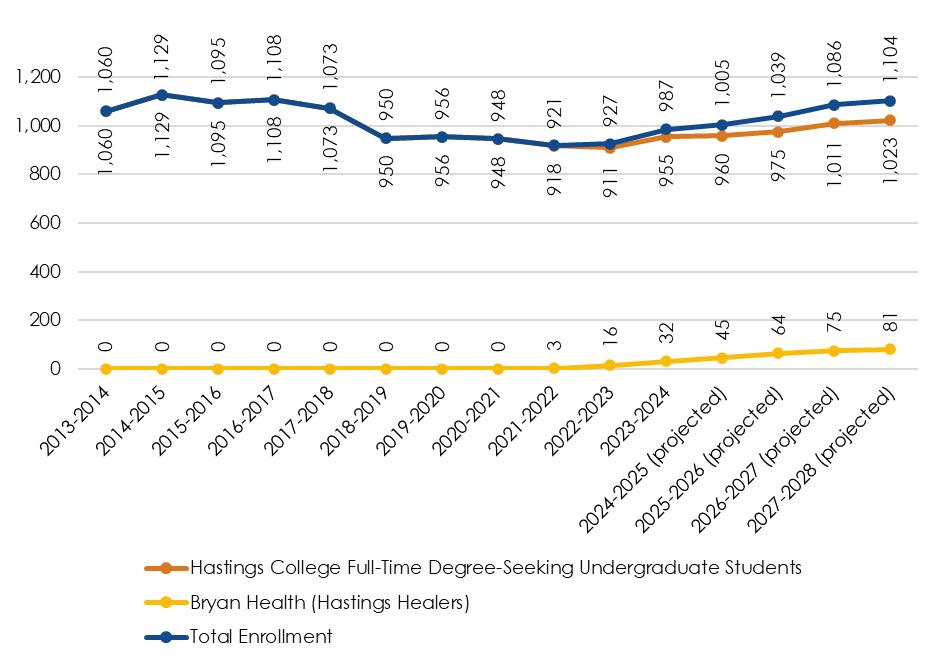
Hastings College’s past enrollment from 2013-2024 and projected enrollment from 20242028 are identified in Figure 6.4. The college saw a peak student population of 1,129 in 2014-2015 and a low student population of 921 in 2021-2022. This total enrollment consists of full-time degree-seeking undergraduate students at Hastings College as well as Hastings Healers, which provides bachelors of science in nursing degrees through Bryan College of Health Sciences. The Hastings Healers program provides students with the opportunity to take a majority of general education courses through Hastings College as well as clinical opportunities at Mary LanningHealthcareinHastings.
Hastings College’s enrollment is projected to increase in the next four years with the total enrollment increasing from 987 students in 2023-2024 to 1,104 students in 2027-2028. This total enrollment increase includes an increase in both full-time undergraduate students at Hastings College as well as an increase in students participating intheHastingsHealersprogram.
Community Facilities
Source: Hastings College
Note: Projected enrollment is based on Hastings College's annual enrollment goals as inputs in a 4-year revenue model that accounts for average attrition of returning students.
Source: Hastings College
Source: Hastings College
Figure 6.4: School Enrollment 2013-2028, Hastings College
Table 6.1: On/Off Campus Students & Commuter Students, Hastings College
Table 6.2: Alumni Information, Hastings College
Community Facilities
Table 6.1 identifies the percentage of students living on and off campus between 2017 and 2024 as well as the percentage of students from Hastings, from Nebraska and from out-of-state. The majority of students at Hastings College live on campus with approximately 30 percent living off-campus within the City of Hastings. Additionally, the majority of Hastings College students are from Nebraska with a small percentage originating from Hastings.
The number of alumni remaining in-state and in Hastings is shown in Table 6.2. The majority of alumni, for which location information is known, remain instate, however a small percentage of those remain in Hastings. The percentage of students remaining in Hastings has increased throughout the past two years, with approximately a quarter of students remaining in Hastings in 2023.
The College recently completed a master plan for the years 20242034. Duringthistimethecollege will actively be renovating and constructing new buildings on campus. The buildings planned forrenovationsinclude:
• HazelriggStudentUnion;
• PerkinsLibrary;
• Babcock, Taylor, Altman and BroncResidenceHalls;
• BroncoVillageApartments;
• McCormickHall,and;
• theFuhrHallofMusic
Following renovations and the new residence hall, next on the horizon for consideration at the College would include an indoor track, amphitheater, and new education building, assuming
growth enrollment goals are achieved. With the construction of the new residence hall, housing on campus will be sufficientforstudents.
According to the 2023 Nebraska’s Independent Colleges & Universities: Spurring Economic Growth and Brain Gain Study, Nebraska experiences brain drain and independent colleges and universities are integral to reversing this trend. In 2021, Nebraska had a net brain drain of 137,361 people. However, Hastings College recruited 426 students who had previously lived outside of Nebraska. This resulted in a brain gain for Nebraskaduetothefactthatan estimated 52.9 percent of studentsremaininthestateupon graduation.
Additionally, Hastings College has a positive impact on the economyofHastings.In2021,the college had an annual average of516jobsandatotaleconomic impact of $47.1 million. This includes $23.1 million in Wages and Salaries and $1.1 million in Self-EmploymentIncome.
Central Community College Central Community College (“CCC”), accredited by the higher learning commission, is a multi-campus community college serving a 25-county area in central Nebraska. The central administration is located in Grand Island. Three main campuses are located in Columbus, Grand Island, and Hastings. CCC is one of six community college areas in Nebraska. This structure was the result of 1971 Nebraska State legislation that formed the six areas and required that all
counties in the state become part of one of the community collegeareas.
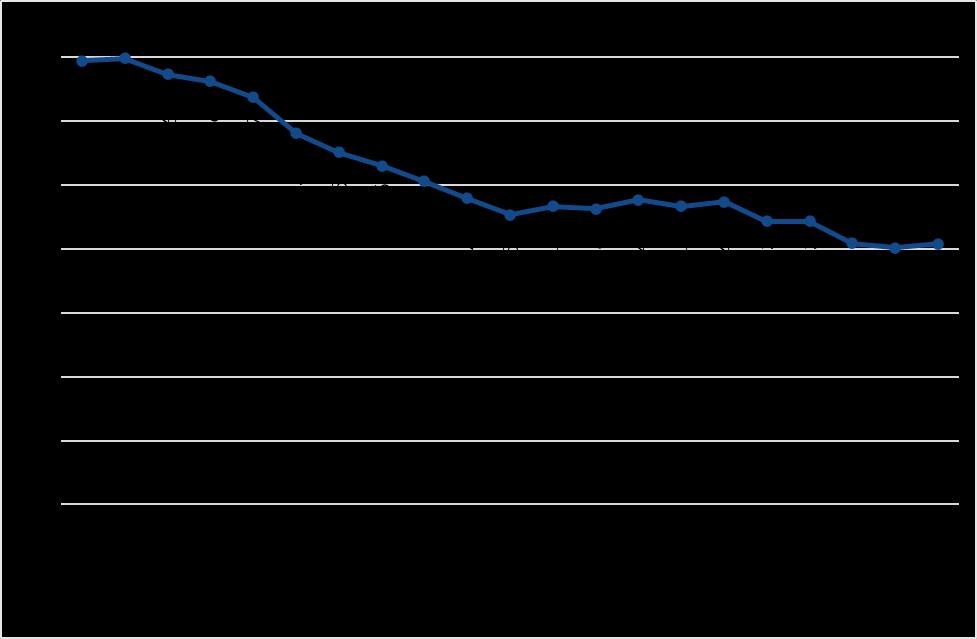
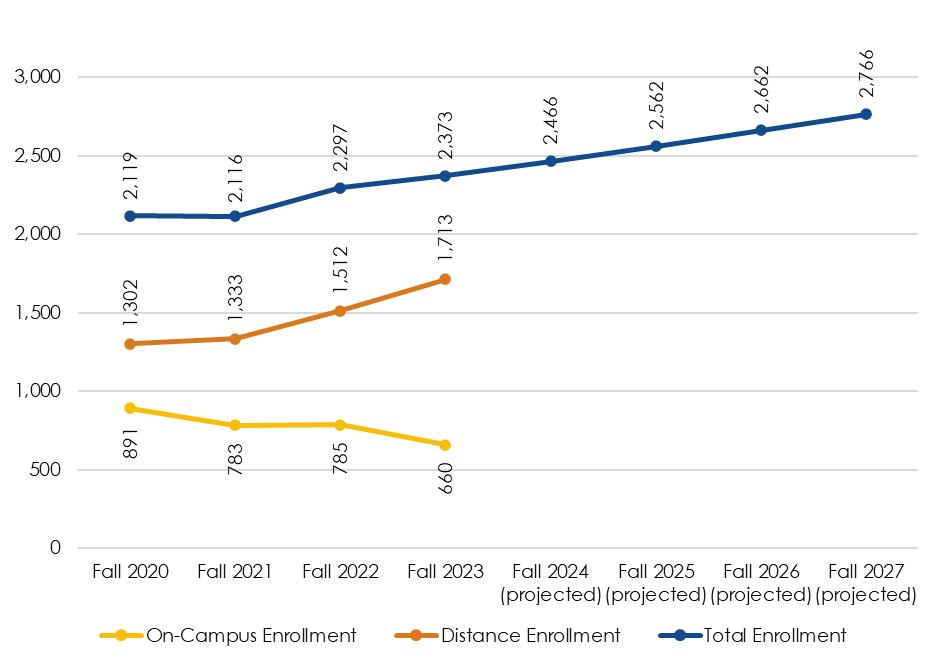
The Hastings campus offers 28 career education programs in addition to providing courses in 17areasfor studentswhoplanto complete two years at CCC before transferring to four-year colleges and universities to complete bachelor’s degrees. Housing is available on campus forapproximately400students. Central Community College’s past enrollment at the Hastings campus from 2020-2023 and projected enrollment from 20242027 are identified in Figure 6.5. The college saw a peak student population of 2,373 in Fall 2023 and a low student population of 2,116 in Fall 2021. This total enrollment consistsof on-campus students at the Hastings campus as well as distance learners, who take classes through Hastings campus, but may be in a differentphysicallocation.
CCC’s enrollment is projected to increase in the next four years with the total enrollment increasing from 2,373 students in Fall 2023 to 2,766 students in Fall 2027. This total enrollment increase includes an increase in distance learners at the Hastings campus but a decrease in the on-campusenrollment.
Table 6.3 identifies the percentage of students living on and off campus between 2020 and 2023 as well as the percentage of students in Hastings, from Nebraska and from out-of-state. The majorityof students at CCC’s Hastings campus are distance learners and approximately 62 percent live within the City of Hastings. Additionally, the majority of CCC
students are from Nebraska with a small percentage originating from out-of-state. Additionally, a majority of CCC students remain in the community. There are currently 2,477 CCC alumni who liveinHastings.
The Hastings campus of CCC is comprised of 23 separate and distinct buildings that were, by and large, all built during or shortly after World War II (early 1940s) as part of the Naval Ammunition Depot. These buildings have served the college since 1966. Many of these original buildings require continuing maintenance and upgrading. These facilities are sufficient for the needs of the campus.
The college plans to build a new Automotive Training Career Center to replace the current Furnas building. The Furnas building will be repurposed and the Kearney building will be demolished once the new building is in place. The new facility should be completed by 2026. Additionally, the Phelps building will be remodeled in summer/fall of 2024 and should be back in service by the beginning of 2025. The building will be repurposed for hosting largereventsoncampus.
Community Facilities
Figure 6.5: School Enrollment 2020-2027, CCC
Source: CCC
Note: Projected enrollment is based on simple linear regression. The CCC Hastings Campus has experienced an average 3.9% increase in enrollment year over year. If this trend continues, the projected enrollment will be achieved.
Source: CCC
Note: Projected enrollment is based on simple linear regression. The CCC Hastings Campus has experienced an average 3.9% increase in enrollment year over year. If this trend continues, the projected enrollment will be achieved.
Table 6.3: On/Off Campus Students and Commuter Students, CCC
Community Facilities
Goals and Actions
Goal 6.1: The City provides accessible public buildings and facilities required by the citizens of Hastings.
6.1.2: Continue to routinely evaluate City services and facilities needs to appropriately place facilities in thecommunitysothattheservicescanbemosteffectivelyprovidedtothosethatneedthem.
Goal 6.3: The City supports quality educational services for residents and workforce of all ages.
Actions
6.3.1: Continue support of K-12 education and coordination with Hastings Public Schools, Adams Central PublicSchools,andHastingsCatholicSchools.
6.3.2: Encourage Hastings College and Central Community College to continue providing services in Hastings.
6.3.3:Include Hastings Public Schools, Adams Central Public Schools,and Hastings CatholicSchoolsin the developmentreviewoflargedevelopmentprojectstoensuretheaccommodationoffuturestudents.
6.3.4: Work with the local education providers to ensure that future school sites are provided in or near growthareastoensurenewandgrowingneighborhoodsareadequatelyserved.
Goal 6.4: The City supports quality health care services in the community.
Actions
6.4.1: Work with Mary Lanning Healthcare and other health care providers to appropriately site health serviceswheretheyaremosteffectivetomeetthehealthcareneedsofthecommunityandtheregion.
6.4.2: Review and update zoning and development regulations to encourage active living and multimodalbike/pedestrianfacilities.
Page Intentionally Left Blank
Chapter 7
Parks, Recreation, and Attractions
Parks, Recreation, and Attractions
This chapter begins by cataloging the social, cultural, and recreational facilities found in Hastings. This chapter concludes with an examination of park standards used by cities and then applying them to Hastings.
Parks, Recreation, and Attractions
Hastings’ is home to 20 parks of all sizes, multiple recreation centers, and unique regional attractions.Figure 7.1,at the end of this chapter, maps all of these assets of the community. Each park offers different options for residents to enjoy. Hastings recreation options include a regional softball complex, hike and bike trails, and first-class recreation facilities. Lastly, Hastingsoffersbothresidentsand the region opportunities to learn, play, and witness natural phenomenon’s such as the
For more information on these parks, recreation, and attractions, visit the City of Hastingswebsite.
SandhillCranemigration.
Photo7.1:LibsParkDiscGolfCoursemap
Historic Standards
A standard used for decades regarding parks and recreation, as established by the National Parksand Recreation Association (“NPRA”), is 10 acres per 1,000 residents. However, there are a number of standards in addition to NPRA. Nebraska Game and Parks Commission (“NGPC”) has usedastandardof14to25acres per 1,000 residents. Another standard is the Small Community Park & Recreation Standards (“SCPRS”), 2003, which examines the primary areas of small communityparksandrecreation. This standard breaks parks down into five basic categories: sports fields, courts, outdoor recreation, leisure, and other recreational facilities.
This resource also determines the minimum acreages for eachthetotalcomesto15.5 acresper 1,000residents.
Parks and Recreation Standards
There are a number of standards to be examined. This section will examine some of the basic standards established overall andinmorespecificdetail.
Table 7.2 examines the desired standards for key facilities found in small and larger communities in the United States. The table is meant as a guide for Hastings instead of an absolute. For example, not all communities have skate parks or BMX courses in their communities; actually in some cases these facilities may become a huge liability risk to thecommunityduetothenature oftheuses.
Parks, Recreation, and Attractions
Source: Marvin Planning Consultants
Table 7.3 examines standards as established in Small Community Park & Recreation Standards, 2003.
Table 7.4 expands on the standards in Table 7.3 and applies it to the minimum amounts of land needed to meetthesestandards.
Table 7.1: Hastings Parks and Recreation Standards
Photo7.2:HeartwellPark
Source:MarvinPlanningConsultants
Parks, Recreation, and Attractions
Source: Small Community Parks and Recreation Standards, 2003
Table 7.3: Small Community Parks Land Standards
Park Demands
Table 7.5 examines population demands per park type, as established by the National Parks and Recreation Association, Tables 7.6 then identifies specific recreational uses and their potential demand based upon the three different population projections in Chapter 3. The number represented in the far right column represents the total needed by 2050 based upon the projections and ideal ratio per 1,000persons.
Some of the recreational uses may be more in demand than others as the planning period moves forward to 2050; there may be demand for soccer fields, basketball courts, trails, picnicareas,andparkbenches. The tables are a guide for the community,notanabsolute.
Source:MarvinPlanningConsultants
These numbers begin to indicate the overall impact long range growth can have on Hastings. As the planning period moves forward an annual to five year review of these criteria should be undertaken to determine future needsand deficits.
Source:MarvinPlanningConsultants
Photo7.3:BrickyardPark
Photo7.4:LakeHastings
Parks, Recreation, and Attractions
Table 7.4: Population served per Park System Facility
Mini Parks .2 to 1 acre Residential neighborhoods within ¼ mile radius
Neighborhood Parks 5 to 10 acres Residential areas within ½ mile radius
Community Parks 20 to 40 acres ½ mile to 3 miles
District / Regional Parks 40 to 150 acres 5 mile radius
Uses
A walk-to facility that provides play and passive recreation for the immediate vicinity:
• Playground equipment
• Picnic tables and shelters
• Open turf
• Natural areas
A walk-to facility with amenities that are predominately neighborhood-oriented (not competitive sports):
• Play areas
• Tennis courts
• Basketball courts
• Open field for casual and multi-use play
A drive-to facility that serves multiple neighborhoods and includes both competitive sports and passive recreation facilities that are typically not provided in neighborhood parks:
• Active sports facilities grouped for efficiency where possible (three to four tennis courts, two or three basketball courts, etc.)
• Lighted sports fields with bleachers
• Small passive areas for neighborhood park functions
• Community center for indoor recreation including kitchen, meeting rooms and large open exercise area
• Natural area with trail
A city-wide drive-to resource primarily for nature-oriented activities and/or major sports facilities:
• Large children’s playground (with theme)
• Lighted active sports facilities (tennis, baseball, soccer, etc.) grouped in complexes for efficiency
• Significant dedicated natural areas with trails and passive park uses
• Community center
Natural Resource Area based on resource Entire community Lands set aside to preserve unique natural resources:
• Remnant landscapes
• Open space
• Visual/aesthetics buffering
Greenway (trails and linear parks) 25 ft. width minimum; 200 ft. or more optimal
Based on resource availability and opportunities
School – Park 10 to 15 acres minimum Based on school district’s school distribution policies
Sports Complex 40 acres or more Entire community
Special Use Variable Variable
Source: National Parks and Recreation Association
Ties park system components together to form a continuous park environment
Combines parks with school spaces
Consolidates heavily-programmed athletic fields to larger and fewer sites
Covers a broad range of park and recreation facilities oriented toward a single-purpose use
Parks, Recreation, and Attractions
Table 7.5: Recreation Needs - Low, Medium, and High Series Projections
Source: Marvin Planning Consultants – 2024
Goals and Actions
Goal 7.1: Residents have access to a variety of parks and recreation facilities.
Goal 7.2: Area attractions enhance the quality of life for local residents and also attract visitors from other communities.
Actions
7.2.1: Ensure that new attractions for residents and visitors are appropriately located to draw visitors and minimizeimpactsonthesurroundingneighborhoodandcommunity.
Planning in the United States originated with a public health purpose;planningisrootedinthe need to improve public health through reduction of congestion, regulating for responsible development, and providing equitable access to recreation for all people. Public health is the promotion and protection of the health of people and the communities where they live, learn, work, and play.Thegoalof public healthistoultimatelysave people money on health care, improve quality of life, help children thrive, and reduce humansuffering.
Those working in public health try to prevent people from getting sick or injured in the first place. Public health concepts promote wellness by encouraging healthy behaviors such as exercising, reducing use of tobacco, and education on alcohol abuse. The field of public health works to
assure the conditions in which people can be healthy. This can mean vaccinating children and adults to preventing the spread ofdiseasebyothermeans.Public health also sets safety standards to protect workers and develops school nutrition programs to ensure kids have access to healthy,nutritiousfood.
Public health workers track disease outbreaks, work to preventinjuries,andshedlighton why some are more likely to suffer from poor health than others.The manyfacetsofpublic health include speaking out for laws promoting smoke-free indoor air and seatbelts, spreading the word about ways to stay healthy, and giving science-based solutions to problems.
Sources: American Planning Association, Planning and Community Health Research Center, Healthy Plan Making; American Public Health Association
South Heartland District Health Department
This department (“SHDHD”) covers public health services in Adams, Clay, Nuckolls, and Webster counties. They work with local partners to develop and implement Community Health Improvement Plans and all other health services mandated by Nebraskastatestatutes.
Source: southheartlandhealth.ne.gov
Community Health Improvement Plan
The community health improvementprogram(“CHIP”)is developed from a community’s health needs assessment. Priority goals are developed to address areas of need in each community. The priority areas for SHDHD, for the years 2019-2024, areasfollows:
• Accesstohealthcare;
• Mentalhealth;
• Substancemisuse;
• Obesity and related conditions,and;
• Cancer
Source: southheartlandhealth.ne.gov
Active Living
Active living is about incorporating physical activity and movement into everyday activities.Forexample,takingthe stairs instead of the elevator or biking to work are part of an active lifestyle. Increasing daily physical activity can prevent obesity and promote health for peopleofallages.
Hastings has recently undertaken planning for transportation and infrastructure promoting active lifestyles. The Walkability and Connectivity study, written in 2019, provides the city (among other items) carefully laid plans for active living improvements in thecity.
This study was a part of Hastings continuing to become a more vibrant and attractive community. Active living is about making the healthy choice the easychoice.
Recreation
As the National Recreation and Park Association notes, “The nation’s public parks and recreation are leaders in improving the overall health and wellness of the nation. They are essential partners in combating some of the most complicated challenges our country faces –poor nutrition, hunger, obesity, and physical inactivity. Park and recreation agencies effectively improve health outcomes and thus should be supported through national and community level funding and policies that enable them to continue to expand their efforts in making a positive change in the health andwellnessofournation.”
Public health is intricately tied to
Source:MarvinPlanningConsultants
Parks and Recreation planning presentedinChapterSeven.
Source: nrpa.org
Walkability
Americans are putting an increasingvalueonwalkability.In 2023, the National Association of Realtors released a survey revealing Americans living in walkable communities report a higher quality of life. Sidewalks and multi-use trails not only help residents improve quality of life but also help improve quality of publichealth.
Walk Score data is a tool to measure walkability of a community. Hastings has earned a walk score of 38 out of 100. In comparison, the city earned a bike score of 47 out of 100. These numbers can be improved over time with the help of the Walkability and Connectivity Study.
Complete Streets policies, a robust sidewalk program, enhancements to development requirements, shared use agreementsforschoolrecreation facilities, and support for transit programs can all add incentives for making the healthy choice theeasychoice.
Public health is intricately tied to Transportation planning presentedinChapterFourteen.
Source: walkscore.com
Livability
Livable communities are welcoming for people of all ages. A livable community provides safe, walkable streets, age-friendly housing, access to services, and opportunities for residents of all ages to participateincommunitylife.The AARP Livable Communities initiative supports the efforts of neighborhoods, towns, cities and rural areastobe great placesfor peopleofallages.
Photo8.1:PioneerSpiritTrail
Hastings earned a 55 out of 100 pointsonAARP’sOverallLivability Score,placingitinthetophalfof communities in the United States. The AARP Livability Index draws on multiple, interconnected points to capture the complexity of what produces a high quality of life for a diverse population across many ages. Metric values and policy points are scored for each of the seven livability categories: housing, neighborhood, transportation, the environment, health, engagement,andopportunity.A location’s total livability score is an average of those seven category scores. Hastings scored in between 45 and 62 for the categories.
AARP explains: “Metrics measure how livable communities are in the present. Data is collected and analyzed from local, state, federal, and private sources. Policies measure how communities might become more livable over time based on actions taken now. Policy data is derived from publicly available dataandinformationandcovers theentireUnitedStates.
Source: aarp.com/livablecommunities
Healthcare Facilities
Hastings offers residents healthcare with a nationally recognized hospital and a range ofseniorlivingoptions.
Mary Lanning Healthcare
Mary Lanning Healthcare first began serving the people of Hastings in 1915. Today, Mary Lanning serves patients throughout central Nebraska. It is licensed for 183 beds and employs a staff of nearly 1,000. Mary Lanning is the largest employerinAdamsCounty. Mary Lanning is a nationally
recognized hospital system for its excellence in providing healthcare. Awards that recognizethisexcellenceinclude the American Hospital Association Quest for Quality Award, Platinum Award from the National Safety Council, Greater Omaha Chapter, NRC HonorsNational Research Path to Excellence, and Care Chex honorsformedicalquality.
Alongside the hospital complex, Mary Lanning operates healthcare clinics in Hastings, Grand Island, and Blue Hill. These clinics provide outpatient servicesforspecializedcaresuch as behavioral health and heart health.
In conjunction with the other educational services previously mentioned, Mary Lanning also offers educational opportunities for Clinical or Preceptorship experience and EMS training for EMTs.
The hospital continues to grow, expand, and change to meet the needs of the Hastings
community and surrounding region. As the community’s only hospital, the organization’s leadership changes its health care services, as community trends dictate, to provide quality service and care. As Hastings and the surrounding region’s populationages,andasmedical technology advances, the healthcare system and its partners will need to adapt to the community’s needs.
In speaking with Mary Lanning Healthcare’s leadership, the hospital is not planning for new buildings or building additions in the upcoming years. The facility plan for the foreseeable future is to renovate the existing buildings to the community's needs to ensure quality health care and service.
Mary Lanning Healthcare has a campus master plan that primarily covers their property, which is between N. Denver Avenue, W.9th Street, N. Kansas Avenue, and W. 7th Street. The hospital owns most of the land in this area. However, there remain
Photo8.2:MaryLanningHealthcare
a few parcels not under the hospital’s control. As these properties become available for sale, the Hospital will purchase them through normal real estate transactions.
Because the Hospital has a campus master plan, the principles and standards for that plan will be continued as the campus expands and redevelops in the future, as needed. Mary Lanning Healthcare should pay special attentiontohow theedgeofthe campus is treated to minimize impacts on the adjacent residential neighborhoods. Also, accommodations for pedestrians, bicyclists, and vehicles traveling in and around the hospital campus should be continually considered to improve safety and access for patients and guests, staff, and thesurroundingcommunity.
(Note: text modified from website.) Source: marylanning.org
Senior Living
Hastings is home to seven senior living facilities, with each providing memory care, assisted living, or both. One senior living facility,theKensington,occupies the Clarke Hotel building downtown. This facility is listed on the National Register of Historic Places. The largest senior living facilityisGoodSamaritanSociety - Hastings Village. This facility, occupying the southeast corner ofthecity,offersmultiplehousing typesforseniors.
Photo8.3:TheKensington
Source:MarvinPlanningConsultants
Chapter 9 Public Safety
Safety in Hastings
Public safety in Hastings encompasses fire protection, emergency medical services, emergency management, and law enforcement. These services are made up of municipal and county-wideproviders.
Fire Protection
Hastings Fire & Rescue Fire & Rescue
Hastings Fire & Rescue operates inanISO-2ratedcommunity.The department employs four administrative staff and 27 fulltime firefighters who are supplemented by up to seven part-time firefighters. Crews respond from Station 1 (located at 1313 N Hastings Ave) and Station 2 (located at 1145 S Hastings Ave), offering fire protectionfor13.67squaremiles.
Emergency Medical Services
Hastings Fire & Rescue's Emergency Medical Services (“EMS”) Division provides both basic life support (“BLS”) and
advanced life support (“ALS”) services to the city and Adams County. The EMS Division also provides ALS interceptor and transport services for the surrounding counties. The EMS division operates five ambulances, two of which are staffed24-7.Theremaining three areusedasback-up.
(Note: text modified from website.) Source: cityofhastings.org
Fire & Rescue Needs
The Department can currently cover about 90% of the city with two stations; their current standard is six minutes for response time. Drive times can be seen in Figure 9.1. Moving forward the Department desires tokeepthisstandard. Should the city grow outward, there would be concerns with coverage. The majority of their calls are in the city core, where there are not issues with coverage.
Staffing issues make coverage difficult for the department. Their
current staffing levels mean they struggle to meet national standards for safety and efficiencyattimes.
Transportationisanotherconcern for the department. Crossing the railroadswouldbedifficultshould a train be derailed; there would be significant issues crossing the railroad aside from the one underpass on Burlington Ave. For major transportation routes, the cityhasgreateasttowestroutes, but not as much north to south. Unpaved roads are a challenge, with weather slowing response timeongravelroads.
For all of these reasons, a new station will likely be necessary on the north or the west side of the city, depending on where more growth occurs. Possible locations would include the area of 42nd St and Baltimore Ave, 12th St and Highland Dr, and Showboat Blvd and Highway 6, asidentifiedbytheFire &Rescue Department.
Hastings Rural Fire District
Hastings Rural Fire District (“HRFD”), formed in 1955, covers the remainder of the city’s extraterritorial jurisdiction which is not covered by the Hastings Fire & Rescue Department. HRFD is a volunteer service and has a contractwiththe Cityof Hastings to house, maintain, and staff HRFD equipment. HRFD is housed at2985S.BaltimoreAve,southof thecity.
Emergency Management
Emergencies in Hastings are managed by the Adams County Emergency Management Agency. The agency plans for emergency response, trains communities on emergency response, coordinates response withcommunities,andadminister grants as needed. The communities of Ayr, Holstein, Juniata, Kenesaw, Prosser, and Roseland are all under the umbrella of this agency along withthecityofHastings.
(Note: text modified from website.)
Source: bereadynebraska.com/ adamscountyema
Law Enforcement
Hastings Police Department
The Hastings Police Department, located at 317 S Burlington Ave, provides law enforcement service for the City of Hastings. The Police Department also manages community service operations within the Operation Division. Community Service Officers are responsible for keeping the city free from all nuisances and neighborhood eyesores. Since 2013, officers have provided code enforcement and animal control throughoutthecity.
(Note: text modified from website.)
Source: cityofhastings.org
Adams County Sheriff Department
The Adams County Sheriff Department,locatedat500West 4thSt,isincharge ofgenerallaw enforcement areas in the county except those under municipal police departments. The Sheriff’s Office manages and governs all jail operations at the Adams County Jail, a medium-security facility.
Staff shortages have affected the Police Department and city greatly, delaying emergency responsetimes. Asthecitygrows, thePoliceDepartmentwouldlike to see more emphasis on roadway safety. Code enforcement on existing facilities will be important now and for future facilities as well, especially asthecitygrows.
Public Safety
Goals and Actions
Goal 9.1: Adequate Law Enforcement services are provided to the community.
9.1.3: Consider working with the Hastings Police Department to develop Crime Prevention Through Environmental Design (“CPTED”) strategies to lower crime throughout the community.
9.2.2: Continue to work closely with the Fire Departments Risk Reduction Division to ensure new and renovatedbuildingsaresafeandmeettheCity’sbuildingandfirecodes.
9.2.3: Support the construction of new fire stations as the city grows, with the locations being dependent onwheregrowthoccurs.
9.2.4: Identify specific ways the City can mitigate transportation concerns from the Fire & Rescue Department,particularlyoneasttowestroutesandovertherailroads.
Goal 9.3: Adequate Emergency Management services are provided to the community.
Utilities in Hastings include electric, water, gas, sewer, trash, and recycling. These services provide city residents with basic needs, all of which will have to adjustasthecitygrows.
Hastings Utilities
The City’s Utilities Department is locatedat1228NDenverAve.
Electric
Hastings Utilities currently has the capability of producing approximately 170 megawatts of electricity. Hastings Utilities serves a 56-square mile area including the city of Hastings and the village of Juniata. Electricity is generatedatthreedifferentsites. The largest producing power plant is the coal-fired Gerald T. Whelan Energy Center. The 77 megawatt power plant uses low sulfur coal from Wyoming coal mines.
The two other generation sites include the North Denver Station
and the Don Henry Power Center. The Don Henry Power Center operates primarily on natural gas, but can also be operated on fuel oil. This center can be brought online in a moments notice. The North Denver Station has two natural gas fired generators. All generation is sold to the Southwest Power Pool market and then City load is purchased back. Generation above that required for City load is wholesale power. Wholesale power revenues help to hold the line on local electric rates. The Utilities Department’s services also include tree trimming to ensure electrical system’s integrity.
Lastly, the department offers thermal imaging services to determine hot spots in or on buildings, windows, doors, circuit breaker panels, conveyor belts, pulleys, electrical motors, and gearboxes.
(Note: modified slightly from website.)
Source: cityofhastings.org
Community Solar Farm
Community solar is when solar electricity is owned and shared by multiple customers while being produced in one location. A community solar farm's primary purpose is to give customers the option to participate in renewables who cannot or do not want to install the solar panelsontheirownproperty.
Anyone who gets their electricity from Hastings Utilities can participate. Those who wish to participate can do so through ownership and subscription. Ownership gives customers the ability to purchase and own the panel. The panel will stay in the solar field and will be maintained by Hastings. Subscription allows customers to purchase solar shares each month to offset some of the energy they use each month. The Hastings Community Solar Farm is located westofthemunicipalairport. (Note: modified slightly from website.) Source: cityofhastings.org
Water
Hastings Utilities supplies potable water to residential, commercial, and industrial customers within and near the community. The city also provides water to private water systems, including Sanitary Improvement District (“SID”) 1 of neighboring Clay County and the Village of Trumbull (in both Adams and Claycounties). Waterispumped directlyfromtheOgallalaAquifer using 23 operational wells. There are a total of 35 wells, but 12 are inoperable due to either age or contaminants. Water is supplied through a water distribution system thathasatotallengthof 327 miles. The average system demand is seven million gallons perday.
Source:MarvinPlanningConsultants
The city also operates seven additional wells for emergency use purposes and three wells devoted to Aquifer Storage and Restoration (“ASR”) operations. The ASR Project went online in 2018.Thesystemwasdesignedto reduce the nitrate concentration in the aquifer beneath Hastings. Doing so keeps system wells viable.
A water main and lead service replacement program was started in 2021 for the purpose of replacing aging pipe, boosting residential fire flow, and eventuallyeliminatingleadwater servicelinesinHastings.Currently, high population centers such as churches and schools are provided with sufficient fire flow. However in residential areas, where there are still 4” water mains,it isdifficult toachieve the desired1,500gallons per minute forsufficientfireflow. Iffireflowis less than 750 gallons per minute, then replacement becomes a priority.
As of 2024, the City plans to upgradeall4”lines(25.5milesas of 2024). The City is able to replace 1.5 miles per year, meaning in 2041 all 4” lines will be replaced. See Figure 10.2 to viewthelocationsoftheselines.
(Note: modified slightly from website.)
Source: cityofhastings.org; City of Hastings staff
Gas
Hastings Utilities operates a Local Distribution Company ("LDC") consisting of over 180 miles of primarymain,ranginginsizefrom 2"through12"servingover11,000 customers. Natural gas supplies enter the local distribution company at two municipal limit border stations. Natural gas is transportedtothecommunityvia connections from two interstate natural gas pipelines. Two propane/air mixing plants can be operated in order to shave the consumption peaks during winter'scoldestdays.
(Note: modified slightly from website.)
Sources: cityofhastings.org
Sewer
The city’s Pollution Control Facility,locatedat2120E26thSt, dischargestreatedwaterintothe south branch of the west fork of the Big Blue River. The current process involves primary sludge digestion and land application followed by wastewater activatedsludgetreatment.
The Pollution Control Facility treats about 3.6 million gallons of wastewater per day. The water is conveyed from the city to the treatment facility utilizing eight sanitarysewerliftstationsand166 milesofsewermain.
(Note: modified slightly from website.)
Source: cityofhastings.org
Sanitation and Recycling
The City of Hastings Solid Waste Landfill/Wood Waste Facility is located at 725 SSouthern HillsDr. This facility provides a safe and integrated solid waste management system for Hastings and Adams County. Clay,
Photo10.1:Wellinoperation
Utilities and Energy
Nuckolls, Webster, Franklin, and KearneyCounties,aswellastheir communities, utilize this facility as well. Pick up is managed by privatetrashhaulers.
(Note: modified slightly from website.)
Source: cityofhastings.org/
Energy Element
This section is intended to meet the requirements for an energy element in Neb. Rev. Stat. §19903(4) that each city comprehensive plan “Assesses energy infrastructure and energy use by sector, including residential, commercial, and industrial sectors; evaluates utilization of renewable energy sources; and promotes energy conservation measures that benefitthecommunity.”
Energy Use by Sector
Hastings provides residents with electricity and natural gas. In regard to electricity, the current rated capacity of the city is 169 MW. The average peak demand for the city, from 2021-2023 was 91.4MW.
Source: City of Hastings
Residential Energy Use
Energy is consumed in the residential sector primarily for spaceheating,waterheating,air conditioning, refrigeration, cooking, clothes drying, and lighting. Fuel used for motor vehicles by household members is included in the transportation sector.
In the previous three years, the annual average electricity consumption in the residential sector was 112,803,796 kwh. The annual average natural gas consumption, in the previous threeyears,was645,861MCF.
Source: City of Hastings
Commercial Energy Use
Commercial uses include buildings such as retail stores, nonmanufacturing businesses, motels, health and education institutions for energy use reporting. Government uses are included in this sector for these reports. Common uses of energy in the commercial sector include space heating, water heating, refrigeration, air conditioning, andcooking.
In the previous three years, the annual average electricity consumption in the commercial sector was 108,333,804 kwh. The annual average natural gas consumption, in the previous threeyears,was398,066MCF.
Source: City of Hastings
Industrial Energy Use
Energy use in the industrial sector covers fuels for manufacturing, data centers, construction, mining, agriculture, and forestry. Energy to transport products is included in the transportation sector.
In the previous three years, the annual average electricity consumption in the industrial sector was 206,712,976 kwh. The annual average natural gas consumption, in the previous threeyears,was306,164MCF.
Source: City of Hastings
Renewable Energy
Renewable energy is energy from sources which are naturally replenished. Nebraska, like all of the United States, is moving towards renewable and away from legacy fuel sources. While almost 75% of the state’s electricity was generated by coalin2011,only50%camefrom coalin2021.
Biomass
Biomass is renewable organic material coming from plants and animals. This includes biofuels, such as ethanal and biodiesel, along with wood waste, landfill gas, and similar fuels. In 2021, there were six units in Nebraska producing electricity from biomass,and11fromlandfillgas. Source: eia.gov/energyexplained/ biomass
Geothermal
Geothermalenergyisheatwithin the earth. Geothermal energy is a renewable energy source because heat is continuously produced inside the earth. People use geothermal heat for bathing, for heating buildings, and for generating electricity. Geothermal electricity generation requires water or steam at high temperatures(300° to700°F).
According to the U.S. Environmental Protection Agency (“EPA”), geothermal heat pumps are the most energy -efficient, environmentally clean, and cost-effective systems for heatingandcoolingbuildings. Source: eia.gov/energyexplained/ geothermal
Solar
A photovoltaic (“PV”) cell, commonlycalledasolarcell,isa nonmechanical device which converts sunlight directly into electricity. Some PV cells can convert artificial light into electricity.
The efficiency at which PV cells convert sunlight to electricity varies by the type of semiconductor material and PV celltechnology.Theefficiencyof commercially available PV modules averaged less than 10%
in the mid-1980s, increased to around 15% by 2015, and is now approaching 20% for state-of-the art modules. Experimental PV cells and PV cells for niche markets, such as space satellites, have achieved nearly 50% efficiency. Rooftop solar has increasingly become an option for many homeowners and small businesses. The direction and pitch of the roof affect the amount of energy produced, as do nearby trees or other structures. In the previous three years, the annual average energy solar production in Hastingswas3,615,672kwh.
Sources: eia.gov/energyexplained/solar; City of Hastings
Wind
An increasing share of Nebraska’s energy comes from renewable wind energy. In 2021, therewere1,333utility-scalewind turbines producing electricity in Nebraska. The state’s wind generation grew from 3% of electricity generated in 2011 to 25%in2021.
According to the US Department of Energy’s Office of Energy Efficiency & Renewable Energy, “Areas with annual average wind speeds around 76,320 ft per hour and greater at 262.5 ft height are generally considered to have a resource suitable for wind development. Utility-scale, land-based wind turbines are typically installed between 262.5 ft - and 328.1 high although towerheightsfornewinstallations are increasing -up to459.3 ft - to gain access to better wind resourceshigheraloft.”
Individual sites may be powered by Small Wind Energy Systems, a type of wind energy conversion system with a rated capacity of
Utilities and Energy
Figure 10.3: Direct Normal Solar Resource of Nebraska
Source: National Renewable Energy Laboratory, 2010
Figure 10.4: Average Annual Wind Speed at 80m
Source: National Renewable Energy Laboratory, 2010
100kilowattsorless.
Technological advancements are driving the growth of the small wind power market by making turbines more efficient and cost-effective. Small wind turbines can operate efficiently on wind speeds of just 13.2 feet perhour.
Utilities and Energy
Thelocationoflargecommercial utility-scale wind farms are chosen for a variety of factors, including wind speed, and the ability to tie into interstate transmission lines gaining access totheelectricgrid.
In the previous three years, the annual average wind energy production in Hastings was 7,330,359kwh.
Source: eia.gov/energyexplained/wind; City of Hastings
Battery Backup Systems
Experimental energy storage technologies, particularly battery energy storage systems, are growingrapidlyandalreadyplay aroleinenhancingtheelectrical grid by supporting deployment and integration of renewable energy sources increasing reliability, controlling costs, and buildingamoreresilientgrid.
Source: cleanpower.org
Net Metering
Since 2009, private electricity generating facilities with capacityatorbelow 25 kilowatts may operate under Nebraska's net–metering statutes. Any excess generation produced by thesystemwillbecreditedatthe utility’s avoided cost rate and carriedforwardtothenext billing period. Any excess remaining at the end of an annualized billing period is to be paid out to the customer.
Solar/Wind Access
Municipalities are permitted to develop regulations or development plans protecting access to solar and wind energy resourcesiftheychoosetodoso. Local governing bodies may also grant zoning exemptions to solar and wind energy systems which would be restricted under existing regulations, so long as
the exemption is not substantially detrimentaltothepublicgood.
Conservation Measures
There are different ways to improve energy efficiency and usage. These strategies range from simple (often less costly) to complex (often more costly). Unfortunately, not all of the solutions will have an immediate return on investment. Individual property owners and tenants will needtofindstrategiesfittingtheir budgets to harvest long-term savings.
Some common ways to make a structure more energy efficient include:
• Converting incandescent light bulbs to Compact FlorescentLights(CFL)orLight EmittingDiodes(LED);
• Installingadditionalinsulation;
• Replacingwindows;
• Changing out older, lessefficient air conditioners and furnaces to newer highefficiencyunits;
• Changing out older appliances with new EnergyStarratedappliances;
• Addingsolarpanels;
• Weatherization assistance programs;
• Adding individual-scale wind energy conversion systems (WECS),and;
• Installing a geothermal heatingandcoolingsystem
Resources
Brownfields Assistance
A brownfield is a property, the expansion, redevelopment, or reuse of which may be complicated by the presence or potential presence of a hazardous substance, pollutant, or contaminant. Reinvesting in
these properties increases local tax bases, facilitates job growth, utilizes existing infrastructure, takes development pressures off of undeveloped, open land, and both improves and protects the environment.
ESAs
Sec. 128(a) Assessment are Environmental Site Assessments (“ESAs”) providing preliminary environmental information to determine if there is contamination on a property. The Nebraska Department of Environment and Energy offers theseassessmentsatnocost. Theseassessmentsareperformed in accordance with the “all appropriate inquiry” requirements but may include additional activities such as nearby drinking water well sampling and testing building materials for asbestos, leadbased paint and/or mold. The first part of the assessment examines the background, setting and past uses of a property. It includes a records review, site reconnaissance, interviews, and, as a final product, a report documenting the environmental conditions at theproperty.
The second part of the assessment examines and evaluates the conditions identifiedintheinitialassessment. Soil and groundwater sampling and analyses are conducted to determine whether any contamination associated with any environmental conditions has occurred on the site. The results of the sampling and analyses are evaluated in the AssessmentReport.
Source: dee.ne.gov
Goals and Actions
Goal 10.1: Power utility Infrastructure is sufficient to meet the current and future needs of residents and employers.
Goal 10.2: Water and sewer utility infrastructure is sufficient to meet the current and future needs of residents and employers.
Actions
10.2.1: Incorporate and phase water and sewer system improvements recommended by the City’s engineeringstudiesintotheCapitalImprovementsPlantomeetthedemandsofHastings’sgrowth.
Hazard mitigation planning reduces loss of life and property by minimizing the impact of disasters. It begins with local governments identifying natural and manmade disaster risks and vulnerabilities common in their area. After identifying these risks, they develop long-term strategies for protecting people and property from similar events. Mitigation plans are key to breaking the cycle of disaster damageandreconstruction.
The impacts of hazard and potential damage can be avoided, or at least lessened, with thoughtful land use and development practices. Hazard mitigation informs the entire emergencymanagementcycle.
This chapter summarizes findings of the Lower Big Blue NRD and Little Blue NRD Hazard Mitigation Plan (2021), and presents information on floodplain management. The Federal
Emergency Management Agency(“FEMA”)requireshazard mitigation plans be updated every five years to reflect changing conditions. This Comprehensive Plan should itself be updated to reflect any changes in the hazard mitigation plan.
Hazard Mitigation Plan
The Lower Big Blue NRD and Little Blue NRD Hazard Mitigation Plan was updated in 2021 by JEO ConsultingGroup,andapproved by FEMA in compliance with requirements of the Disaster Mitigation Act of 2000. Developing a hazard mitigation plan is not only good public policy for a resilient community, butparticipationinandadoption ofahazardmitigationplanisalso required to become eligible for certainfederalfundingsources.
The 2021 plan update process was sponsored by the Little Blue and Lower Big Blue NRDs and was lead by local planning representatives from NRDs and
Emergency Management offices in Adams, Clay, Fillmore, Gage, Jefferson, Nuckolls, Saline, Thayer, and Webster Counties. The City of Hastings was representedbytheCityEngineer, Environmental Director, Director of Development Services, and Adams County Emergency Management.
Hazard Mitigation Goals and Objectives
The hazard mitigation plan includes goals, objectives, and actionitems,including:
• Goal 1: Protect the Health andSafetyofthePublic
• Goal 2: Reduce Future Losses fromHazardEvents
• Goal 3: Increase Public Awareness and Education on theVulnerabilitytoHazards
The hazard mitigation plan identifies a broad range of Critical Facilities for each participating jurisdiction. For the City of Hastings, these include public and private schools, park facilities,andcityfacilities.
Hazard Risk Assessment
The hazard mitigation plan includes a description of the hazards considered, including a risk and vulnerability assessment. This information is taken directly fromthemitigationplan.
From 1996 to 2020, Adams County experienced the following hazard events, as documented by the NCEI Storm EventsDatabase:
• Agricultural Disease: 28 incidents
• DamFailure:1event
• Drought:493of1,504months
• Earthquakes0events
• Extreme Heat: Average 6 daysperyear
• Flooding: 11 flash floods and 10generalfloodevents
• Grass/Wildfire:121incidents
• HazardMaterials:62incidents
• LeveeFailure:0events
• Public Health Emergency: 2,898cases,43deaths
• Severe Thunderstorms: 140 events
• Severe Winter Storms: 99 events
• Terrorism:0incidents
• Tornadoes and High Winds: 54events
Countywide, 852 hazard events were logged with $129,766,259 million in property damage and $59,047,780 million in crop damagereported.
Improvements in the floodplain
In 2019, there were 117 improved structures located in Hastings’ mapped floodplainapproximately 1% of all improvements in the city - with a value of about $59.3 million. (JEO Consulting Group analysis).
Top Hazards of Concern
Each participating entity ranked hazards with the potential to affect their own jurisdiction. For the City of Hastings, the top hazardofconcernincludeddam failure, flooding, severe thunderstorms, severe winter storms, and tornadoes and high winds.
Dam Failure
Hastings is protected by the Hastings Northwest Dam, a highhazard dam located 1.9 miles northwest of Hastings.This28 foot high dam is owned by the Upper Big Blue NRD. As noted in the mitigation plan, while the dam is classified as a “high hazard”, hazard level correlates to areas at risk if a failure were to occur rather than the likelihood of failure. If this dam were to fail, a largeportionofthecitywouldbe inundated. The City of Hastings, AdamsCounty,UBBNRD,andthe NeDNR Dam Safety Division have been working together to address dam safety and maintenanceschedules.
Hastings Dam is a significant hazard dam, located on Lake Hastings in the northern part of the city. This 15 foot high dam is owned by the City of Hastings. NeDNR inspectors have noted
Hazards
the primary spillway is insufficient fora100-year(1%)floodevent.
Flooding
Hastings has been impacted by flooding impacts, both from natural floodways and from poor stormwater drainage. The outskirts and edges of Hastings have identified flood hazard risk areas.
Flood events in 2007, 2008, 2009, 2015, and 2019 were documented in the hazard mitigation plan as causing $645,000 in reported damages. During the 2007 flood event many streets in Hastings had one to two feet of standing water and the Burlington Street underpass was closed due to highwater.WhiletheMarch2019 flood event did not significantly impact the city, heavy rainfall across the area resulted in the flooding of the West Fork of the Big Blue River in eastern Adams County. Portions of Showboat Road near the river, which runs along the east edge of Hastings, was covered in several inches of water.
The hazard mitigation plan specificallycallsoutfloodingand ponding in certain areas of the city:
• Properties along the railroad tracks
• Trailer park homes (southeast sideoftown)
• PawneeCreek
• Municipalwell#35
• HastingsMunicipalAirport
• Heartwell Lake Dam area/ EastSideBlvd.
Severe Thunderstorms
Hastings frequently experiences damaging severe thunderstorms which can include impacts from heavy rain, lightning, strong
Table 11.1: Mitigation Actions
Mitigation Action
Enroll in a tree maintenance program
Install Outdoor Warning Sirens; update and improve current sirens
Provide a generator for City Hall
Protect power lines from severe weather events
Repair or conduct replacement of Hastings Dam
Provide a generator for Highland Park (North) Fire Station
Develop and conduct a city-wide comprehensive flood mitigation plan to evaluate problem areas and identify strategies to reduce flooding in Hastings
Improve stormwater drainage in existing developments around Heartwell Lake Dam as part of new maintenance strategy
Develop and implement a stream buffer ordinance for construction activities and developments near streams in town. This ordinance would be developed in conjunction with a Comprehensive Watershed Study and Storm Sewer Master Plan.
Purchase an adequate rescue boat that would provide life-saving rescues to victims of flooding, entrapment, ice breaks, or swift water. Purchase an airboat or similar quick deployment vessel that is capable of LOW and High-water level rescues similar to an airboat.
Update local floodplain ordinance to include language that floodplains remain as open space and prohibit fill in floodplain areas.
Green Infrastructure in the form of filter strips, native plantings, with potential underdrains is needed in many areas of town to provide drainage and not overload the grey infrastructure system. Vegetated Buffer strips are needed around water bodies for water quality.
Widen 12th Street to improve emergency evacuation routes/emergency access.
Plan for and install an additional above-grade BNSF railroad crossing to improve emergency access. Potential locations include at Marion Road or Showboat.
Upgrade, repair and improve stormwater infrastructure including culverts, pipes, and networks throughout the city. Pawnee Creek Railroad – upgrade and upsize culverts to reduce flood impacts on residents, the airport, solar farm, and municipal water wells. With new floodplain mapping efforts, municipal well #35 has no freeboard and additional flood protection is needed.
Enforcement of floodplain management requirements, including regulating new construction in Special Flood Hazard Areas (SFHAs).
Install a high profile and traffic camera
Note: Green highlighted rows are completed actions, yellow are in progress, and red have been removed.
Source: Little
NRD and Little Blue NRD Hazard Mitigation Plan (2021)
Big Blue
winds, and hail. City officials are concerned about disruption of utilities and public services, propertydamageandsafetyrisks to residents from severe thunderstorms.
Criticalfacilities,suchasCityHall, the public library, and the museum, do not have portable generators or hail resistant roofing. About 20 percent of the powerlinesinthecityareburied. Interior flooding does occur during heavy rainfall events which can overwhelm the aging stormwater drainage system. Areaswithpoordrainageinclude the Burlington Underpass, 12thStreet, and the 33rd and Kansasarea.
Severe Winter Storms
Adams County frequently experiences severe winter weather, with heavy snowfall, high winds, and sometimes crippling ice accumulations. Extremelycold temperatures can accompany these systems, such as when a winter storm on February1, 2011 wasfollowed by wind chills approaching 35 degrees below zero in Hastings. The city’s main concerns from severe winter storms are snow removal, property damage, and publicsafety.
Tornadoes and High Winds
Hastings is prone to damaging windsandtornadoevents.AnF-1 tornado on June 7, 1994 just north of Hastings caused several million dollars’ worth of crop damage. An EF-0 tornado on August 22, 2007, with winds of 75 mph caused $25,000 in damage intown.
The City’s main concerns from tornadoes and high winds are disruption of utilities, property
damages, blocked transportation routes, loss of life and crop damage. High winds have been reported in excess of 70 mph and have caused substantial damages to homes. The city does not have a community safe room, so residents must rely on their own or a neighbor’s basement or stormshelterforsafety.
Mitigation Strategy
The primary focus of the mitigation strategy is to identify action items to reduce the effects of hazards on existing infrastructure and property based on the established goals and objectives. These actions should consider the most cost effectiveandtechnicallyfeasible mannertoaddressrisk.
Actions to implement the Hazard Mitigation Strategy for the City of Hastings are presented in Table 11.1. The County and each participating municipality has its own mitigation strategy spelled out in the Adams County Appendix to the hazard mitigationplan.
Floodplains and Floodways
Flooding occurs as a general and temporary condition of inundation of normally dry land from flowing water, such as streams and rivers overflowing their banks, along with runoff from adjacent or surrounding slopes.
The floodplain contains generally three areas of concern the floodway, Regulatory Floodplain, andFloodFringe.
Floodway, the channel of a watercourse and those portions of the adjoining floodplains which are required to carry and discharge a flood of 1-percent chance with no significant increase in the base flood elevation.
Regulatory Floodplain, the low land near a watercourse which has been or may be covered by water from a flood event having a 1-percent chancein anygiven year. The 1-percent annual chance flood is also referred to as the base flood or 100-year
Figure 11.1: Flood Plain Cross Section
Source: National Wetlands Inventory
flood. The regulatory floodplain is identified on Flood Insurance Rate Maps (FIRMs) as the Special FloodHazardArea(SFHA).
Flood Fringe, the portion of a floodplain which can be inundated by floodwaters but is not within the regulated floodway. The flood fringe serves as temporary storage for slowmoving or standing floodwaters. The floodplain includes both the floodwayandthefloodfringe.
The floodplain area of greatest significance to land use is the 1% or 100-year floodplain, as the floodway is generally off limits to development. The floodplain is defined by the ground elevation in relation to water elevation experienced during a base flood event. The 1-percent or 100-year floodplain is calculated as the elevation level of flood water expected to be equaled or exceeded every 100 years on average. In other words, the 100 year flood has a 1% chance of being equaled or exceeded in anysingleyear.The 0.2%chance or 500-year floodplain is also commonly mapped as a caution, yet is not typically regulatory.
Preserving the floodway and flood fringe are critical to limiting the level of property damage which can occur as well as the risktolifeoftheoccupantsofthe area. These lands when not flooded may seem to be harmless,but it isthoserare times threatening life and property whichneedtobeanticipated.
Floodplain Administration
The City of Hastings participates in the National Flood Insurance
Program (“NFIP”). The Highway Superintendent is the City’s designated Floodplain Administrator. The Administrator would work with the Development Services Department, NRD, Nebraska DepartmentofNaturalResources (“NeDNR”), and FEMA to keep Hastings’ floodplain development regulations up to date with changing state and federalrequirements.
FEMA’s Community Status Book report the initial Flood Hazard Boundary Map for Hastings was identified on 5/10/1974. The Initial Flood Insurance Rate Map (FIRM) became effective 8/01/1980. The currently in effect map was dated 9/26/2008, subject to map amendments and revisions. The FEMA Flood Map Service Center reports seven amendments and one revalidations to the FIRM effectiveJuly5,2018.
As of February 29, 2024, in the municipal limits of Hastings there were 20 NFIP policies in force, with total coverage of $5.4 million. This is down from the 24 policies in force in November 2020, reported in the hazard mitigation plan. According to NeDNR as of February 2020 there wasoneundefinedrepetitiveloss propertyinthecity.
Higher Standards for Floodplain Management
NeDNR’s Floodplain Management Section is responsible for coordinating programs addressing the wise use of land which is subject to flooding. The Section provides floodplain management resources, NFIP resources, postdisaster information, and other references. Staff provide regular training opportunities, online and
in-person.
Every local floodplain management program is supported by a floodplain management ordinance. The ordinance establishes the requirements for development in the regulatory floodplain. Ordinances must meet the Nebraska Minimum Standards for Floodplain Management Programs as well as the requirements in 44 CFR Chapter 1, Part 60.3. NeDNR has developed model ordinances that communities can use for a template, provided community staff and boards review it for appropriate inclusion into the broadsetofordinances.
Nebraska’s minimum standards are higher than the federal minimum standards, including requiring one-foot of freeboard (elevation of the lowest floor above the base flood elevation orBFE),restricteddevelopmentin floodways, and prohibited storage of hazardous materials. t flood damages can be reduced further and citizens kept safer by enactingfurtherhigherstandards fordevelopmentinfloodplains.
• Freeboard: Some cities increasethissafetyfactorto2 or 3 feet above BFE. Higher elevations are safer, and floodinsurancecostslower.
• Substantial Improvement/ Damage: All substantially improved or damaged structureswithmorethan50% improvement or damage must be elevated. Some cities encourage safer rebuilding by lowering the benchmark to 30%, or by tracking cumulative improvements and/or damage.
• Enclosure Limitations/Non-
conversion: Many structures have an enclosed area below the lowest floor, such as a crawlspace or storage area. These enclosed areas are required to be wet floodproofed with vents. The City can prohibit all enclosed areas or set limitation on size or height. The benefit is to limit flood damage and protect against the loss of life orproperty.
• Critical Facilities: As noted in the Hazard Mitigation Plan, certain critical facilities are vulnerable to flooding. Ideally, critical facilities should be sited outside of both the 1% and 0.2% annual chance flood zones. Providing a requirement to elevate or floodproof critical facilities to a 0.2% annual chancefloodzonehelpkeep buildings safer. Doing so also requires providing an access roadthatissimilarlyelevated.
• Fill in the Floodplain: Fill placed in a floodplain displaces flood waters, inevitably impacting adjacentproperty.Fillcanbe prohibited or limited to reduce impacts on floodwater storage. Another option is a compensatory storage requirement for any fill the same amount of flood storage must be provided. The ordinance can also set standards for fill, including qualityandcompaction.
NeDNR also provides optional standards for community consideration:
• Appurtenant Structures: Some cities adopt specific standards for accessory structures, such as small backyard sheds. Appurtenant structures used
for storage can have their lowest floor below BFE if anchored, flood vented, and any electrical fixtures elevated.
• Letters of Map Revision: With a Letter of Map Revision Based on Fill (LOMR-F), a property is re-mapped to Zone X, nominally outside the regulatory floodplain. However, restrictions on basements below a certain elevation remain. Some cities set riders to their acknowledgement of the LOMR process, including referencing FEMA Technical Bulletin design and constructionstandards.
• CFM: Some cities require the designated floodplain administrator to become a Certified Floodplain Manager (CFM)fromthe Associationof State Floodplain Managers. The certification does require certain ongoing costs for training.
During the next update to the Hazard Mitigation Plan, the City should consider participation in FEMA’s Community Rating System (“CRS”). The Community Rating System (“CRS”) is a voluntary program that communities can join to get credit for floodplain management activities above the minimum standards. Communities receive points for those activities and based upon the number of points, flood insurance premiums are reduced for policyholders in the community. CRS is a "win-win" because it reduces a community's vulnerability to floods and also reduces the cost
offloodinsurancepremiums.
While there are significant administrative costs to track compliance, CRS offers policy holders substantial potential savings, likely just for activities andpoliciesalreadyinplace.
Land use and development are the primary focus of the Comprehensive Plan. The land use element does not regulate land use - it is a policy guide for future decision making for annexation and rezoning requests. The document also provides direction to City staff, its development partners, and the community for future projects, capital improvements, and small area plans. The Comprehensive Plan is not regulatory; however, thePlanreflectsthecommunity’s preferences to guide and plan for development and land use policy.
ThePlan,particularlythelanduse element, plays a fundamental role as the substantive basis for regulations implementing the plan such as zoning, subdivision, and floodplain management. A clear land use element provides a vision for the future and helps prevent, or at least minimize, conflicts between different uses ofland.
It is essential for the land use element to reflect the wants and needs of Hastings’ residents, businesses, and property owners, within the constraints of the landscape. This chapter addresses the statutory requirements of the land use element, describes existing land use, and presents the future land use plan. This chapter also discusses the community character of Hastings and action items for building on this unique character.
Land Use Element
This section is intended to meet the requirements in Nebraska Revised Statutes §19-903(1) that the Comprehensive Plan include: “A land-use element which designatestheproposed general distributions, general location, andextentoftheusesoflandfor agriculture, housing, commerce, industry, recreation, education, public buildings and lands, and other categories of public and
Thelanduseelementisbasedon an understanding of how Hastings’ citizens have built their community. All of the other elements presented so far in this plan, from demographics to hazard mitigation, inform the analysis of existing land use to determine recommendations for futurelanduse.
Existing Land Use
Land in Hastings and the surrounding area has been developed for many different purposes. Existing land use includesboththeuseofbuildings and parcels of land. The use of land is constantly changing - this plan presents a snapshot in time of existing land use. It is essential to have a solid understanding of existing land use at a point in time to carefully consider future landusepolicy.
Existing Land Use Categories
The utilization of land is best described in specific categories providing broad descriptions where numerous businesses, institutions,and structurescanbe grouped. For the purposes of the Comprehensive Plan, the following land use classifications areused:
• ResidentialEstates(RE);
• Single-Family Residential (SFR);
• Multi-FamilyResidential(MFR);
• Manufactured Housing (MHR);
• Commercial(C);
• Industrial(I);
• Quasi-Public/Public(Q-P/P);
• Parks&Recreation(P/R);
• Transportation/ROW(T/ROW);
• Lake/Water,and;
• Vacant/Agriculture (Vacant/ Ag)
In Tables 12.1 and 12.2, the existing land uses in the city are split between inside city limits and in the extraterritorial jurisdiction.
Land Use Constraints
While certain areas are well situated for different types of growth and development, they may also be subject to constraints discussed throughout this plan. These constraints may direct development elsewhere, or they may simply be issues to be improved and resolved. Constraintsmayinclude:
• Limited opportunities for in-fill development;
• Neighborhood impacts of existing commercial and industrialuses,includingvisual blight;
• Cost to extend infrastructure including streets, electricity, water,andsewerservice;
• Agriculturaluses;
Land Use and Development
Table 12.1: Existing Land Uses - In City Limits
Source: Marvin Planning Consultants
Table 12.2: Existing Land Uses - Extraterritorial Jurisdiction
Source: Marvin Planning Consultants
• Transportation such as highwaysandrailroads;
• The reach of the gravity-fed sewer system,without adding liftstations,and;
• Willingness of adjacent property owners to sell land at prices which the market willsupport
Extraterritorial Jurisdiction
The City of Hastings has planning and zoning jurisdiction over the unincorporated area of Adams County generally within two-mile of the city limits, known as the (extraterritorial jurisdiction or ETJ) The Future Land Use Plan also appliestothe ETJ,with or without annexationintothecitylimits.
Land Use and Development
Ready to Build Land
Future development would logically occur on vacant or agricultural land with access to sewer and water lines. As shown in Figure 12.1, there are multiple parcels surrounding the entire city (and within the city limits) identified as vacant or agricultural during the existing land use inventory. These parcels also have access to both sewer and water lines. In total, there are 1,784.02 acres available as “readytobuild”land.
Future Land Use
The Future Land Use Plan is intended to be a policy guide to future land uses balancing private sector development with the public interest, so the city can effectively and efficiently deliver public services. The future land use categories cover areas inside current city limits, future annexation areas, and the extraterritorialjurisdiction.
The flow charts to the right show how the existing land use categories fall into the future land use categories used in the Plan (note: the Hospital Environs does not fall into a new future land use category, as it is an overlay on top of future land uses). The blue box is the existing land use category, with the ensuing orange boxes being the futurelandusecategoryinwhich itfalls.
Existing Land Use Categories:
RE=ResidentialEstates
SFR=Single-FamilyResidential
MFR=Multi-FamilyResidential
MHR=ManufacturedHousing
C=Commercial
I=Industrial
Q-P/P=Quasi-Public/Public
P/R=Parks&Recreation
Vacant/Ag=Vacant/Agriculture
Future Land Use Categories:
TA=TransitionalAgriculture
RE=ResidentialEstates
LDR=LowDensityResidential
MDR=MediumDensityResidential
RVP=ResidentialVillagePark
HDR=HighDensityResidential
DC=DowntownCommercial
GC=GeneralCommercial
HC=HighwayCommercial
HE=HospitalEnvironsOverlay
F=Flex
I=Industrial
P/I=Public/Institutional P/R=Parks/Recreation
Page Intentionally Left Blank
Land Use and Development
TA - Transitional Agriculture
General Purpose
The Transitional Agriculture land use district encompasses the area where agriculture will likely continue; however, there may be urban scaledevelopmentwhencityutilitiescanbeextended.
Compatible Uses
1. Agriculturaluses
2. Commercial uses related to agriculture (such as grain storage, implementsalesandservice,equestrianstables,etc.)
2. Suitability for onsite wastewater treatment systems (“OWTS”)
3. Proximity to existing livestock confinements, mining, renewable energyfacilities,etc.
4. Floodhazardareas
5. Naturalamenitiessuchastrees,andwaterways
6. Sidewalksandmulti-modalaccessibility
Special Policies
1. Residential density should be average no more than four dwellingsperquartersection
2. Minimum lot size based upon adequate space for domestic well andOWTS
3. Cluster development of residential developments should be considered whenever soils, topography, natural amenities warrant
4. Developmentsofoneacreormoremayberequiredtomeetthe standards of National Pollutant Discharge Elimination System (“NPDES”)permitting
5. Developments which create more than a 5% increase in runoff mayberequiredtoconstructadetentionbasintocontrolrunoff.
RE - Residential Estates
General Purpose
Land Use and Development
The Residential Estates land use district represents areas where large lotresidentialdevelopmentmaybeappropriateoutsideofcitylimits. Theseareasaretypicallynotyetservedwithcitywaterand/orsewer butmaybeinthefuture.Theseareascouldbedesignedasclustered developmentstoconserveagriculturallandandopenspace.
Compatible Uses
1. Residentialsingle-familydwellings
2. Agriculturaluses(smallerscale)
3. Public facilities (such as fire stations, public utility substations, communitycenters,etc.)
4. Religiousandeducationalusesandstructures
5. On-Site renewable energy facilities, within performance standards
1. Residential density should be average approximately one dwellingperthreeacres
2. Density should range from two dwelling units to .33 dwelling units per acre depending upon the source of drinking water and OWTS/sewerservice
3. Accommodate for future streets and easements through proper subdivisionstandardsandpolicies
4. Cluster development should be considered whenever soils, topography,naturalamenitieswarrant
Source: Envisioning Better Communities; 2010 by Randall Arendt
Graphic by MPC Courtesy of the Lincoln/Lancaster Planning Department Original Plat by Olsson Associates
Land Use and Development
LDR - Low-Density Residential
General Purpose
Due to the mixture and blending of different residential uses and densities, the Hastings Future Land Use Plan recognizes this blending through a multi-level density approach. The Low Density Residential land use district includes both existing and new residential neighborhoods,includingtheMissingMiddleconcept.
Densities should be up to seven dwelling units per acre with city waterandsewerservices
Missing middle dwelling units need to be designed to match the architecturalcontextofneighborhood
MDR - Medium Density Residential
General Purpose
Land Use and Development
The Medium Density Residential land use district includes both existing and new residential neighborhoods with a mix of singlefamily,two-family,and multi-familydwellings on small tomoderatelysized lots with supporting community facilities. It is intended to encourage creative development patterns and adaptive reuse of existingstructures.Streetsarepavedwithsidewalks,curb,andgutter.
Compatible Uses
1. Residentialsingle-familydwellings
2. Missing Middle residential development (such as cottage court, townhouses,duplex,fourplex)
3. AccessoryDwellingUnits(ADUs)
4. Residentialcarefacilities
5. Small-scalemixed-usedevelopment
6. Public facilities (such as fire stations, public utility substations, communitycenters,etc.)
1. Densities should range between seven and 15 dwelling units per acre
2. Densitymaybeincreasedforsmalllotdevelopment
Land Use and Development
The High Density Residential land use district includes both existing and new residential neighborhoods with multi-family residential sized lots with supporting community facilities. It is intended to encourage creative development patterns. Streets are paved with sidewalks, curb, and gutter. This land use type is ideally located near intersections of arterial streets to act as a buffer between more high intensity uses andlowerdensityresidentialuses.
Missing Middle residential development (such as cottage court, townhouses,duplex,fourplex) familyresidentialdevelopment/apartmentcomplexes
The Residential Village Park (“RVP”) land use district accommodates manufactured, modular, tiny homes, and mobile home parks. These are typically land-lease communities where residents rent a lot for owner-occupied homes. However, some areas may have fee simple legal lots of record. The RVP land use district is intended to protect thisvaluablesourceofaffordablehousing.
3. Developments which create more than a 5% increase in runoff mayberequiredtoconstructadetentionbasintocontrolrunoff
4. Off-streetparkingshouldbeprovided
Land Use and Development
DC - Downtown Commercial
General Purpose
The Downtown Commercial land use district is focused on the traditional building pattern of Downtown Hastings as the community’s original center for trade, service, and civic life. Structures in this area are typically built with brick or stone at the sidewalk line, with parking and storage limited to alleys. In addition, upper-story residential units provides flexible and affordable housing choicesforHastingsresidents.
Compatible Uses
1. Commercialretailandservicesuses
2. Accommodationsandfood/beverageservices
3. Arts,entertainment,andrecreation
4. Publicart
5. Cottageindustries
6. Multi-family residential development (such as upper-floor apartmentsoverretail/services)
7. Mixed-usedevelopment
8. Public facilities (such as city hall, county courthouse, fire station, publicutilitysubstations,communitycenters,etc.)
9. ReligiousandEducationalusesandstructures
10. On-Site Renewable Energy facilities, within performance standards
Incompatible Uses
1. Ground level single-family residential development is discouragedunlessthereareuniquecircumstances
2. Drive-thru facilities and multiple driveways creating conflicts with pedestriansandon-streetparking-banksrequirespecialdesign
4. On-site parking should be minimized to encourage greater utilizationofdowntownlotsandon-streetparking
5. Design standards for infill or redevelopment, including historic preservationandactivationofthepublicrealm
GC - General Commercial
General Purpose
Land Use and Development
The General Commercial land use district provides for a variety of commercial uses, typically located along arterial and collector streets and roads. This designation includes the Hastings Theater Districtredevelopmentproject.
Compatible Uses
1. Commercialretailandservicesuses
2. Accommodationsandfood/beverageservices
3. Arts,entertainment,andrecreation
4. Autoserviceuses(suchasautosalesorrepairs)
5. Multi-familyresidentialdevelopment
6. Mixed-usedevelopment
7. Public facilities (such as fire stations, public utility substations, communitycenters,etc.)
5. Landscaping should be provided to limit impacts on surrounding neighborhood
Land Use and Development
F - Flex
General Purpose
The Flex land use district is intended to accommodate a flexible blend of commercial and industrial uses. These areas are typically located along arterial highway corridors such as US 6/34 or US 281
3. Developments which create more than a 5% increase in runoff mayberequiredtoconstructadetentionbasintocontrolrunoff
4. Screening should be provided between residential and commercial/industrialproperty
5. Landscaping should be provided along arterial and collector streetsandroads,andinparkinglots
6. Limitnewaccessalongarterialstreetsandroads
I - Industrial
General Purpose
Land Use and Development
The Industrial land use district is intended to provide for manufacturing and warehousing uses. These uses typically require larger tracts of ground and have multiple buildings on a site. Location of industrial uses needs to be sensitive to other uses, in particular to residential areas, which may require screening and mitigationofimpacts.
3. Developments which create more than a 5% increase in runoff mayberequiredtoconstructadetentionbasintocontrolrunoff
4. Outdoor storage should be protected by security fencing, and mayrequireasolidvisualbuffer
5. Datacentersneedtobelocatednearpowersupply
Land Use and Development
P/I - Public/Institutional
General Purpose
The Public/Institutional land use district provides for public and institutional facilities. These facilities are also located throughout the communityinotherlandusedistricts.
1. Public and non-profit land holdings may have long-term impacts onpropertytaxrevenues
2. Limitnewaccessalongarterialstreetsandroads
P/R - Parks and Recreation
General Purpose
The Parks and Recreation land use district provides for parks and recreation sites. Parks should also be provided in all areas with new residentialneighborhoods.
Compatible Uses
1. LocalandCountyparksandrecreationareas
2. Golfcoursesandaccessoryuses
3. Non-profitconservationlands
Incompatible Uses
1. Industrialdevelopment
2. Livestockoperationswhichcannotmitigateimpacts
Issues
1. Naturalamenitiessuchastrees,andwaterways
2. Sidewalksandmulti-modalaccessibility
Special Policies
1. For major regional recreation facilities, new access along arterial streetsandroadsshouldbelimited
Page Intentionally Left Blank
Land Use and Development
Community Character
Every community has a unique character distinguishing a specific place from every other place. Character encompasses many aspects of the community, from the street grid, lots and blocks, to the brick storefronts downtown and homes in treelined neighborhoods, to the extensive prairie stretching from thecityintothecountryside.
Community character includes a combination of physical and psychological experiences. Residents and visitors learn to “read” a place based on formal andinformalclues.
Community Entrances
There is only one chance to make a first impression on visitors, and potential new residents and employers. Community entrances are a statement welcoming new and returning people to town. A well-designed monument sign conveys a message more than mere words. Entrance signs should reinforce the community brand with curbside appeal. Landscaping improvesthisappeal.
Wayfinding
Wayfinding refers to how people find their way around the community. Appropriate signage helps people walk and/or drive to specific locations in the community. Wayfinding would more easily direct visitors to downtown, public facilities, and cityparks.
Aunified wayfinding system does not need to be elaborate, but it does need to easily convey a message as well as be legible to driversaswellaspedestrians.
Signage
Signs are an important form of communication. Sign control - or the lack of sign control - can have a significant impact on the community’s appearance and economiccompetitiveness.
The image of a community is fundamentally important to its economic vitality and the signs along a community’s streets can greatly affect the image of a place. Sign clutter is ugly, costly, andineffective;“Wheneveryone shouts,noonecanbeheard.”
Commercial signage on the street and building front helps people get where they need to go. A good sign code is probusiness because an attractive businessdistrictwillalwaysattract more customers than an ugly one. Signs can be well designed at a human scale, or they can create visual clutter and distracted driving as pedestrians and motorists search for their
destination.
On city streets, ground-mounted monument signs are an effective form of commercial signage. They can also be designed to fit into the overall architectural character of a specific building ordevelopment.
Landscaping
Landscaping is critical to creating a positive community character. It also filters drainages (such as bio-swales) and provides buffers; Landscaping makes a particular impression in areassuchas:
• Along streets, especially majorthoroughfares;
• Alongparkingbarriers;
• Near commercial and public buildings,and;
• Inpublicspaces
Landscaping should include a variety of organic and hardscape materials, appropriate to Hastings’
environment.Thesemayinclude:
• Xeriscaping
• Grassandgroundcover;
• Shrubsandtrees,and;
• Streetfurniture
Streettrees,forexample,notonly improve the appearance of the community, but also provide erosion control and drainage as well as breaking up large expanses of concrete and asphalt.
As new development and redevelopment occurs in Hastings, the City should work closely with developers and property owners to ensure there is appropriate landscaping installed and maintained to improve the appearanceofthecommunity.
Land Use and Development
Photo12.2:StreettreeinDowntownHastings
Source:MarvinPlanningConsultants
Photo12.3:LandscapinginDowntownHastings
Source:MarvinPlanningConsultants
Land Use and Development
Goals and Actions
Goal 12.1: Future growth and development has adequate land available while avoiding land use conflicts.
As cities grow in population, employment, and services, the municipal limits will need to expand to provide infrastructure tonewdevelopment.
Annexation Element
This section is intended to meet the requirements in Neb. Rev. Stat. §19-903(5)(a) that the Comprehensive Plan include: “ an identification of sanitary and improvement districts, subdivisions, industrial tracts, commercial tracts, and other discrete developed areas which are or in the future may be appropriate subjects for annexation and (b) a general review of the standards and qualifications that should be met to enable the municipality to undertake annexation of such areas.”
corporate limits into contiguous areas, provided the criteria for such action is justified. An important consideration of annexation is the property in question may not be further than 500 feet from the corporate limits of the municipality in order to be considered adjacent and contiguous.
There are two methods for annexinglandintothecorporate limits:
• Voluntary-Landrequestedto be annexed by the property owner(s),or;
• Involuntary - Any contiguous or adjacent lands,lots,tracts, streets,orhighwayswhichare urban or suburban in character and annexation is initiatedbythemunicipality
Annexation Process
The State of Nebraska has established a process for municipalities to extend their
To ensure that annexation of land into the City of Hastings is done consistently to promote appropriate community and economic development growth, the following Annexation Policy hasbeencreated.
City of Hastings
Annexation Policy
Annexation of land adjacent to the City limits is important and necessary to the future growth and health of Hastings. Developers and landowners routinely ask to be voluntarily annexed into the City as part of the regular development process. This allows these properties to be supplied with Cityservicesastheyare needed, and the City benefits from property taxes, utilities,and other fees that City residents and businesses pay, as well as the overall comprehensive growth of thecommunity.
Policy: The City will encourage annexation of land adjacent to the City limits, as it prepares to be developed.
Some property owners at the edge of the City may not want to develop in the foreseeable future, nor want to be within Hastings City limits. However, in certain circumstances, it makes sense for the City to initiate annexationofadjacentlandthat is already developed and requires minimal public investment to provide public infrastructureandservices.
Policy: The City may initiate annexation of adjacent land for the following reasons:
• Equity for taxpayers. Properties at the edge of the City limits benefit from many of the City’s services, including streets, parks, trails,
the library, snow removal on nearby streets, some or all public utilities, and in some cases emergency services, without paying City taxes and fees. Annexation balances providing appropriate and reliable services with the “fair share” paymentforthoseservices.
• Clarity of service areas for maintenance of roads and providing emergency services.
• Allowing Hastings to continually grow in an efficientandorderlymanner.
• The City of Hastings will require that properties receiving public infrastructure be located within the City limits, as allowed for by State Statute. Annexation should occur before any property is provided with water or sanitarysewer.
• Annexation must occur before a property receives an urban zoning designation or is prepared for development.
The character of existing residential areas should be respected as much as possible during the annexation process. When low-density residential areas are proposed for annexation due to the City’s annexation policy, additional steps should be taken to ease the transition as much as possible. In general, many aspects of the low-density residential areas may remain unchanged, such as zoning or covenants. However, any annexation of existing land will result in some costs to the propertyowners.
Additionally, the City-initiated annexation process should take
additional steps to inform those proposed to be annexed, including City-hosted public meetings,advanced notice,and written explanations of potential changes as a result of the annexation.
Chapter 14 Transportation Transportation
Transportation is a prime determinant of land use. The City, County, and State transportation network, combined with railroads, defines access to land and much of its potential for development. Land Use and transportation create the pattern for future development.
This section is intended to meet the requirements for a transportation element in Neb. Rev. Stat. §19-903(2): “The general location, character, and extent of existing and proposed major roads, streets, and highways, and air and other transportation routes and facilities”.
Streets and Roads
The city’s primary road network includes State highways, county roads, city streets, and adjacent county roads. Maintenance and construction of the road network isacooperativeeffort.
Functional Classification
The street and road network is classifiedbyfunction:
• Expressway - major roadway forstateorregionalaccess
• Arterial-majorroadwithhigh volumes of traffic, primarily connecting places to each other
• Collector - street with less traffic, connecting local traffictoarterialroads
• Local - street with low traffic volumes and slow design speeds, primarily uses for directaccesstoproperty
These streets can be seen in Figure 14.1, courtesy of the Nebraska Department of Transportation.
One and Six Year Plans
The City Street Superintendent develops the One and Six-Year Road Plan for the city, which is adoptedbytheCityCouncil.The current plan, as of 2025, listed six projects in progress or having beencompletedin2024.
Theseprojectswereasfollows:
• M Street Paving DistrictBaltimore Avenue to 815 feet east,and;
• Resurfacing/repairprojects
These activities represented City expenditures for the 2023-2024 fiscalyear,totaling$1,264,899.
Activities planned for 2025-2030 include arterial and residential street improvements, pursuit of grant funding for pedestrian improvements, and moving forward with the Quiet Zone projects. Construction for all seven Quiet Zone crossings is expectedin2026.
Source: cityofhastings.org
NDOT
Hastings is located in the Nebraska Department of Transportation (“NDOT”) District Four,headquarteredinKenesaw. NDOT’s Surface Transportation Program Book for 2024-2029 (the “five-year plan”) includes six projects in the Hastings region, to
be completed between 2024 and2029.Theseinclude:
• Resurfacing and bridge maintenance from Kearney/ Adams County line east ($14,075,000);
• Bridge maintenance on the Hastings Regional Center SpurBridge($7,468,000);
• Resurfacing and bridge maintenance on the Kenesaw Spur east and west ($6,974,000);
• Resurfacing and bridge maintenanceinwestHastings ($8,209,000);
• Resurfacing in east Hastings ($1,872,000);
• Resurfacing US Highway 34 in Hastings($1,808,000)
The Program Book includes a capital improvement project for Southeast Hastings, a 3-Lane Urban project, which will cost an estimated$35,902.
Source: Nebraska Department of Transportation
Transit
RYDE Transit
Reach Your Destination Easily, or RYDE, Transit operates buses in Buffalo, Adams, Dawson, Franklin, Hamilton, Kearney, and Gosper counties and in the City of Ravenna. RYDE provides public transportation to medical appointments, shopping areas, congregate dinners, and social activities. All 12-passenger buses areliftequipped.
RYDE is operated by the Community Action Partnership of Mid-Nebraska based out of Kearney.
(Note: text modified from website.)
Source: communityactionmidne.com
Multi-Modal
Multi-modal transportation planning creates communities where it is possible to get around by walking, bicycling, and public transportation. Many State and countyhighwaysaredesignedto favor high-speed motorized traffic, without consideration of thoseonfootoronabicycle.
For young people and older residents, building streets for multiple modes of transportation becomes all the more important. Young people need to be able to go places without relying on drivers. As well, many older people may prefer not to drive, or may become unable to drive. Trail development is also becoming an economic development attraction as young families consider options for where to live. The National Association of Realtors has reported on recent studies which show living near trails and greenways will likely raise property value an average of 35% and sometimes even as high as15%.
Community Trails
Multi-user trails are becoming a popular piece of infrastructure for everyday transportation as well as exercise and recreation. As noted in Chapter Six, the Pioneer Spirit Hike/Bike Trail is the city’s only community-wide trail. The trail provides a route between Libs Park, Heartwell Park, Lake Hastings, Hastings College, and the Downtown Central Business District. Expansion of the trail was identified in the Hastings Walkability and Connectivity Study, completed in 2022. Trail expansion will be funded by FederalFundsandlocalmatch.
Source: cityofhastings.org
Accessibility
The Americans with Disabilities Act (“ADA”) was signed by President George H.W. Bush in 1990. The ADA is intended to makesurepeoplewithdisabilities have the same rights and opportunitiesaseveryoneelse.
The NDOT Roadway Design Manual (May 2022) provides guidance for design of pedestrian and bicycle facilities in conformance with ADA. This includes having a transition plan when structural modificationsare required to provide accessibility, includingcurbramps.
Sidewalks on rights-of-way and bridgesmust be at leastfour-feet wide, provided there are larger passing spaces every 200 feet (driveways may be considered as passing spaces). A shared-use path must be a minimum 10 feet wide, with 11-14 feet preferred in certainsituations.
Walkability and Connectivity Study
Written to examine the current state of pedestrian access in the city, this study provided Hastings with a four part plan for addressing walkability and connectivity issues. The study providedthecitywith:
• Aprofileofcurrentwalkability issues;
• Communityinputonissues;
• Anidentificationofwherethe citycanimprove,and;
• How to implement said improvements
The proposed projects which emerged from this study were trail expansions, improved connections between amenities and schools, and improved ADA accessacrossthecity.
Source: Hastings Walkability and Connectivity Study
Transportation
Railroads
Hastings was founded because of the railroad, and still benefits from its presence today. The Burlington Northern Santa Fe (“BNSF”) line runs through the central portion of the city, with the historic train station still being used today as an Amtrak station. TheUnionPacificlinerunswestto eastthroughthenorthernportion ofthecity.
The City of Hastings has worked to complete “quiet zone” projects along the BNSF railroad. Quiet zones reduce the frequency of the horns coming from the railroad, improving the quality of life for the residents and those conducting business near the at-grade crossings. Quiet zones are a series of atgrade crossings where improvements have been made totheroadway,crossinggatesor other options making it possible for the train to pass without sounding its horn. The Hastings Ave and Pine Ave crossings were completedinNovemberof2023. Five other crossings at Lincoln, Denver, California, Elm, and Colorado avenues will be completedinthefuture.
The Hastings Municipal Airport (“KHSI”)islocatedat3300W12th StwithinthecitylimitsofHastings. The site is owned and operated by the City with fixed base operator (“FBO”) services providedbyHastingsAir.TheFBO building offers a renovated pilot lounge, conference room, and crew car. The Terminal Building
also features a pilot lounge and meetingroom.
(Note: modified slightly from website.)
Source: cityofhastings.org
Regional Air Travel
The Central Nebraska Regional Airport (“KGRI”) is a major aviation facility located in Grand Island. This facility is owned by the Hall County Airport Authority and maintains four runways that service an average of 69 aircraft perday.
Goal 14.4: The City’s airport is maintained and improved to meet current and future needs.
Actions
14.4.1: Coordinate development review in the vicinity of the Airport with Adams County and the Airport AdvisoryBoard.
Chapter 15 Implementation
Implementation
Successful community plans have the same key ingredients: "2% inspiration and 98% perspiration." This section of the plan contains the inspiration of the many city officials and residents who have participated in the planning process. However, the ultimate success of this plan remains in the dedication offered by each and everyresident.
Evaluation of Development Proposals
Implementation Action Items
There are numerous goals and action items in this plan. These items should inform annual workplans and budget-setting to assure progress continues to bringtheplantolife.
Action Plan
The Comprehensive Plan is not intended to sit on a shelf. The plan is intended to be put into action. Goals and action items specific to each plan element are included in the relevant chapter.
Development proposal applications should be carefully reviewed against the goals and policies of the Comprehensive Plan as well as the specific requirements of the development regulations. This plan is not regulatory; however, the underlying regulations are based on compatibility with this plan. Each development application should address how the specific proposal meets the goalsofthecomprehensiveplan.
In cases in which a proposal is not clearly supported by the plan, the developer should be encouraged to improve the project tomeet thecommunity’s goals. On the other hand, approval of a proposal not in conformance with the comprehensive plan would point to the need to review and update the plan to better serve thecitizensofHastings.
This plan recommends several implementable action items which can be undertaken immediately.Theseinclude:
• ZoningRegulations;
• SubdivisionRegulations;
• Floodplain Regulations & Mapping;
• Capital Improvement Program,and;
• PlanMaintenance
The City Council will have a critical role in implementation of this plan through the annual budgeting process. Elected officials, staff, and volunteers take the primary role in implementation of the comprehensiveplan.
Other action items are referencedinsupportofactivities by other entities which support implementationofthisplan.
Future Planning Efforts
Two studies completed recently, the Transportation and Parking Master Plan (“TPMP”) and Walkability and Connectivity Study, identified future planning efforts the City should consider alongside implementation of the ComprehensivePlan.
Transportation and Parking Master Plan
TPMPisastrategicplanwrittento guide city-wide transportation and parking policy and investments. The TPMP defined the City’s transportation vision and addressed mobility challenges. The TPMP also identified future planning studies the city should undertake, including:
• A Downtown Pedestrian Mall Study;
• ARailroadViaductStudy;
• A Hastings Local Transit FeasibilityStudy,and;
• ANetworkConnectivityStudy
See the TPMP for further information on conducting these studies.
Universal Mobility Study
The Universal Mobility Study was written to identify existing barriers to mobility in Hastings. Barriers to universal mobility are defined as physical impediments that prevent individuals from accessing public places and hinder the ability to move from place to place within the City. The Study was written to augment the Walkability and Connectivity Study also completed in 2019. The Study identified future planning studies the city should undertake, including:
• A Central Hastings Core StreetPlan;
• APublicBuildingsandSpaces TransitionPlan;
• Design Standard Development;
• Sidewalk and Parking Enforcement,and;
• ADA/VanAccessibleParking
See the Universal Mobility Study for more information on these studies.
Funding Sources for Future Planning Efforts
Funding sources for the projects outlined above, the Housing Affordability Plan, and the Comprehensive Plan, include the following:
• AmericaRescuePlan;
• Rural Workforce Housing Fund;
• Community Development AssistanceAct;
• GeneralObligationBond;
• Land and Water ConservationFund;
• Transportation Alternatives Program;
• Charitable foundations such as the Hastings Community Foundation;
• RecreationalTrailsProgram;
• SpecialAssessmentDistricts;
• Little Blue Natural Resources District’s Urban Conservation Program
• LocalOptionSalesTax;
• TaxIncrementFinancing;
• Community Development BlockGrant;
• Civic and Community Center FinancingFund,and;
• The USDA Rural Development grants
Comprehensive Plan Maintenance
Annual Review of the Plan
A relevant, up to date plan is critical to the on-going planning success. To maintain both public
Implementation
and private sector confidence; evaluate the effectiveness of planning activities; and, most importantly, make mid-plan corrections on the use of city resources, the plan must remain current.Theannualreviewshould be performed each January to begin the calendar year. This review should result in a report from the Planning Commission and Staff tothe CityCouncil and thecitizensofHastings.
Unanticipated Opportunities
If any innovative development and/or redevelopment opportunities arise which impact any elements of the plan and which are determined to be of importance, a plan amendment may by proposed and considered separate from the Annual Review and other proposed Comprehensive Plan amendments.
The Comprehensive Plan amendment process should adhere to the adoption process specified by Nebraska law and provide for the organized participation and involvement of citizens.
Five Year Review
As discussed in the Introduction, the comprehensive plan is a 20yearplan.However,thePlanning Commission should review the plan annually and update the document at least every five years (2030), or when major, unanticipated opportunity arises. Completing updates every five years or so will allow the City to incorporate ideas and developments not known at the timeofthisplanningprocess.
Survey Results
#1: How long have you lived in Hastings?
• Lessthan1year:1.40%
• 1to5years:4.20%
• 6to10years:7.88%
• 11to15years:7.53%
• 16to20years:11.03%
• 21to30years:16.99%
Appendix A Survey Results
#5: My children live:
• Athome:41.01%
• Atschool/College:4.45%
• Grown - Living in Hastings: 14.51%
• Grown - Living in Nebraska: 26.89%
• Grown - Living out-of-state: 13.15%
#8: Which of the following industries is your primary income? The following are based upon US Census categories.
• Other services (except public administration):3.68%
• Publicadministration:4.56%
• Retired:19.30%
• Disabled:1.75%
• Other (please specify): 6.49%; commentsbelow
• Retired andfinance
• Manage and own real estate in my retirement
• Goodwill day site
• It [sic]
• Retired teacher & disabled
• Engineer and Teacher
• Hair Dresser
• Custom fabrication
• Lawenforcement
• Biz Consultant
• Hairdresser
• Sales
• Trucker
• Non-profit
• Medical
• Legal
• Corrections
• Homemaker (husband works)
• State of Nebraska
• Medical
• Licensed daycare
• Mlmh [sic]
• Energy production
• Security
• Petroleum
• Legal
• Radio
• Auctioneer/Re Broker
• Retired orthodontist
• Government
• Childcare Center Owner/ Director
• Good sales and distribution
• Custodial
• Public works
• Hastings Utilities
• Marketing
• Public Utilities and City Services
#9: How far is your commute to work:
• Work from home (telecommute):2.46%
• Workathome:5.09%
• Lessthan10minutes:43.33%
• 10to14minutes:11.58%
• 15to19minutes:3.51%
• 20to29minutes:4.56%
• 30to44minutes:2.46%
• 45to59minutes:1.05%
• 60minutesormore:1.05%
• Retired:22.46%
• Other (please specify): 2.46% commentsbelow
• Retired and work from home
• I don’t know [sic]
• at customers current place of services needed.
• Two miles to one job, 100 to the other.
• Disability
• Homemaker
• Homemaker
• Homemaker
• One of us is 4 min from work and the other is 50 min from work
• Service Area within 65 miles
• Not working
Appendix A - Survey Results
• Currently unemployed due to disability; would be working if employers could be more accommodating
• Not employed
• Disabled
#10: Highest level of education completed?
• Grade/MiddleSchool:0.18%
• HighSchool:21.09%
• GED:2.11%
• Community/Technical/ Vocational:30.93%
• 4-year College/University: 28.47%
• Graduate/Advanced Degree:19.51%
#11: What brought you to Hastings?
• Family:25.17%
• Work:27.80%
• Retirement:0.35%
• Retirementandfamily:0.70%
• Alwayslivedhere:35.14%
• Other (please specify): 10.84%;commentsbelow
• Married
• I lived Hear [sic] all my Life
• College
• School
• love this town
• Returned after leaving for Air Force October 1971
• College
• College
• Education CCC
• College
• school
• Lower cost of living & small town living (from AZ)
• Bigger city
• Work
• College
• CCC and never left
• College (CCC Hastings)
• Growup there
• School
• Moved away for 20 years returned when our kids were
in high school
• Left large city due to crime & violence
• Married someone from here
• Born in Hastings. Come and go a bit. Presently here. Own a homein Hastings.
• Fiancé
• College
• Hastings College
• Quality of life
• College
• My husband lived here-I moved here after we got married.
• Born here
• School for self
• Had to move in with grandparents
• Moved to Hastings in 1060 [sic] with family, left in 2015
• Friend was sick and needed help
• Death of husband
• Husband
• Cost of living
• College
• Stayed after college
• Lived here my entire life
• School
• College
• College
• College
• Small town values. Small town life
• family and work
• Wife's work
• College
• Was born and raised here. After marriage moved to Trumbull for 42 years. Husband farmed
• College
• College
• Was raised here. Moved back approx [sic] 30 yes ago from a metro area to raise familyin smaller community w family values
• Lived in area
• Work but I could have chosen other places
• I came here for college and
Appendix A - Survey Results
stayed after graduating.
• College
• Got married and moved here for work
• Family and work
• College
• We attended college here and loved the community so found work in the area.
• College
• Group home
#12: All of us have different experiences with where we live. We want to know how YOU feel about Hastings. Is Hastings a quality place to live?
• Veryhighquality:5.59%
• Highquality: 37.41%
• Neither high nor low quality: 41.26%
• Lowquality:9.79%
• Verylowquality:3.15%
• Other (please specify): 2.80%;commentsbelow
• corthouse [sic] and city hall is a Eye Shore [sic] and no brick roads and side warks [sic] must come back
• City/County/Utility officials ruined our chance to grow for 50 yearars [sic].
• Not able to get housing for low to middle income or first time home buyer
• Quality in spite of high taxes. 25% increase on property tax in one year isinsane.
• Improving quality
• While there are aspects of Hastings that make it a high quality place to live, such as the parks and outdoor space, there are other aspects that are poor quality. The difference between the “haves” and “have nots” is vast.
• I love this community, however I wish we could successfully keep new
businesses here.
• Dropping more and more everyday
• Slightly high with great potential never taken advantage of
• Wonderful place to grow up, work and serve the community, but the town has experienced a serious decline in quality in the last fewyears. We moved in 2015, as have many others
• I used to say high quality but I don't love the direction hastings [sic] seems to be going
• unfortunately its stale there is no growth or desire to grow hopfully [sic] the theatre district helps this
• Was good - trending bad with newcitizen chat stuff
• If you live south of 1st Street, it is as if we do not exist or even count anymore to our government. Out [sic] voices and lives mean nothing to Hastings anymore.
• It's OK but lots of problems living under surface not addressed
• Quiet but no places to eat or live especially for handicapped people plus not putting elevator in 55 plus apartments
#13: I plan to retire in Hastings.
• Yes:65.60%
• No:34.40%
#14: I am confident in Hastings’ future.
• Yes:32.11%
• No:49.12%
• NoneoftheAbove:18.77%
Appendix A - Survey Results
#16: Please tell us where the majority of the following activities take place.
#17: Which of the following services and/or businesses should be the focus of economic development activities in the future?
Appendix A - Survey Results
#18: Access to quality goods and services is important. How available are these to you?
#19: What is/will be your plan for retirement?
• Noneoftheabove:4.37%
• StayinHastings:45.32%
• Seek a nearby location: 2.91%
• StayinNebraska:14.55%
• Movetoanotherstate:5.56%
• Other: 18.71%; comments below
• Kearney, Ne
• I don't know.
• Due to family I'm committed to stay in Hastings, otherwise.
• Moved to Hastings for continuing retirement.
• Hastings and west coast
• Travel for warm weather
• Absolutely no ideas!
• May move to where ever [sic] statemy daughter moves
• Stay until the property taxes prohibit my living here. Then move to another state!!!
• I’m 30 years old. I don’t think I can afford to retire here. This town and survey is too focused on retirement. You need youth to grow and take care of the elderly. WE NEED AFFORDABLE HOUSING
• Undecided, but not Hastings
• Iowa
• Unsure
• Split time with another state when cold here
• Not sure at this time
• At this point, I have no specific place picked out to live in retirement. I do not desire to continue living in Hastings.
• Hastings does not have enough to offer. Property tax is high.
• Undecided
• Taxes are too high to stay in Nebraska
• Undecided
• Too far off to contemplate
• Unsure. Depends where my kids are
• Move back to Hastings
• Undecided
• Where my kids go
• Possibly winterin the south
• Move to a tax friendly, conservative area within equal distance of children and near relevant healthcare
• Not sure
• Travel in our rv [sic]
• I would prefer somewhere with some options to not have to leave town as I age.
• I guess I stay in Adams
County...until I can't afford the taxation anymore!
• Teavel [sic]
• Move where not everything is taxed hard
• Likely leave NE. Taxes are too high from local to state
• Depends on where kids settle
• Not sure
• Ocean Living
• Likely stay close to family
• Move to Lincoln or another state - especially now with a Racino comin [sic] totown.
• Depends what my kids do
• part of the year elsewhere
• I was planning on staying in Hastings, in my house till I was old. But the City wants to put a Casino in my backyard. Now considering moving even as far as Grand Island.
• Undecided
• unknown
• We do not yet know
• With second home in CO mountains
• Move to a cheaper tax state
• School year in Kearney, Summer in South Dakota
• Undecided. Taxes will be a factor
• Depends on where children live
• Hope to stay in Hastings but if crime rising and property values crash with new casino may have to leave
• Winter in the south - summer in Hastings
• Part time in Hastings. Part time out of state.
• There is not a plan at this point.
• Stay in Hastings & Travel out of state
• Snowbird in Texas or AZ.
• Unknown at thistime
• Possibly move out of state
• Unsure
• Not totally sure yet
• Would love to move to the country away from higher taxes or maybe even out of state where Social Security isn’t taxed
• I do think I want to stay and “retire” here, but it will become more and more difficult, as there isn’t enough housing (apartments) for a disabled person like me (as I live on an extremely fixed income). I can’t even afford to move out of my current situation, which I’ll likely need to in the very near future.
• Not sure at this time
Town Hall Meetings
Community Facilities
Strengths
• Pickleballcourts
Appendix B Community Engagement
subdivisions
• Hastings Lake - public entertainment for families and water sports (fishing, boating,swimming)
• Renovation of YMCA, Accessible YWCA, Museum and Library adding outside classrooms
• Hastings Lake - Community, family,churchactivities
• Community will rally around fundraising
• Good parks and recreation for the young people and trails available for joggers andbikers
• Public schools have all been renovated and are good for theyouthofthecommunity Weaknesses
• Lack of Activities to keep youngerpopulationaround.
• Nocommunitycenter
• Library parking is not convenient especially for disabled and elderly. Not enoughaccessibleparking.
• HastingsLake-maintenance
• Have aging buildings owned bycity
• We have no place for homeless in the daytime hours(asidefromthelibrary)
• Need facilities for the homeless
• City building is old. Council always wants new facilities instead of renovating what we have. Other facilitiesface samechallenge.
Opportunities
• Multiculturalcenter
• Improvement to the current seniorcenter
• Ready to expand our sports venues
• Communitychildcarecenter
• More child care facilities/golf simulation,axethrowing
• Addacommunitycenter
• Green Space, Parks (neighborhood) in new
Threats
• Lackofrevenue
• Physicaldeterioration
• How to afford repairs on city buildings
Communications and Utilities
Strengths
• Alloisfantastic
• Strong city owned utility system
• Recent addition of public informationofficertocity
• Cityowned
• Ok in the communication reception area, Utilities don’t failoften.Noflooding!
• Publiclyownedutilities
• Utilities are good, they fix problems (outages, etc.) quickly and the price is reasonable and affordable. Alsoitspublic-owned!Good. Weaknesses
• Lack of communications with city
• Lackofpublictransparency
• Streetsareterrible
• Need affordable internet access for those on fixed incomes. I cant receive local channel4oranyoranyother thenetworksonmydigitalTV.
• Difficult for residents to commentonpublicitems.10day notice or min. comment period. Electricity is generated with coal. CO2 emissions are bad, cause climatechange!
• Declining days coverage, declineinsubscriptions
• Lack of High-Speed internet outsidecitylimits
• Response on utilitiescould be better. Alot of un-safe power polesintown.
• Providing info to people in a variety of ways; now the computer illiterate (or poor) do not need equal access; languages need attention also
• Lack of communication and transparencyforcitizens
• Oftenothertownsknowmore aboutusthanwedo
• Concerned about water qualityandquantity
• Impact from nitrates and pesticides
Opportunities
• High paying public jobs –utilities
• I want solar panels on every home and conical windmills on each roof so I’d want excess energy to be sold or funneled to the utilities as a credit. Also, we need more SOLARANDWINDhere.
• MorefromHarvestFreePress
• More options for High Speed internetoutsidecitylimits...
• Newcityadministrator
• Our city should be divided between to [sic] NRD Natural ResourceDistricts
• Need solar panels on each house rooftop, better batteries for storage, also small conical wind - catchers (that I read about - not noisy likesmallwindmills)
• Solar panels would at least power the refrigerator, the one thing we need all year. Also each resident would be part of their own energy production. Helps climate change.
Threats
• Rateskeepgoingup
• Utilities should be as independent as can be. So far no threat from hacking that I’d heard of but it could be happen [sic]. More home generation from solar panels mightbegoodinsurance.
Economic Development Strengths
• Pretty Good Networking with other Community Groups. CRA,etc.Developers
• Workforce development throughCCC
• Downtown is lovely and thriving with a variety of businesses
• Starting to see business development North. Business developmentdowntown.
• Some new developers doing innovativethings.
• Continuous development of downtown area as retail and livingspaces
• Retentionofouryouth Weaknesses
• Not bringing enough JOBS to thearea
• Variety of grocery storesand their geographic locations make access challengingtonon-drivers
• Lackofrestaurants(notbars)
• Lack of activities for young individuals
• Hastings has been historically reluctant to encourage new businesses. Fearful of competition for current businesses,fearful ofstepping ontoesoftherichand“good oldboysclub”.Consequently minimal growth in the 40 yrs I havebeenhere.
• Collegegradsleavetown
• Return something like Herbergers [sic], Penneys [sic],Sears Opportunities
• RecruitingBusinesstoHastings
• Populationgrowth
• Morerestaurants
• More activities/businesses that are geared to attract youngerpopulation.
• Transportation of people as wellasgoodsontherailroads (especially with regional travel)wouldbehelpful.
Appendix B - Community Engagement
• Gettingmorepeopletohave gardens, not depend on food shipped in, be more independent and aware of nature. Give them something to do and share with children. Would do better if there were more local gardeners.
• A bike culture in Hastingsgrowthof.Currentlywedon’t have anyone in town to make repairs. None currently. Needfinancing.
Threats
• Climatechange
• We haven't allowed national chains/other businesses to cometoHastings
Education Strengths
• HastingsCollege
• CommunityCollege
• PublicSchoolSystem
• PrivateSchools
Energy Strengths
• We do have the opportunity tobuyintothesolargrid
• Varietyofsources
• 2 ethanol plants, no chance oflackingasupplyofit.
• Utility employees working to develop alternative energy sources. Working to be innovative and still keeping environment concerns in front.
• Interest and commitment to using solar, wind, etc., make itaffordable
• Bettertrainedemployees Weaknesses
• Not much easy access to information about accessing/ installingresidentialsolar
• Overdependence on fossil fuels
• Too bright at night - light pollution. Also adds CO2 emissions to the atmosphere
= more climate change. Also they have farmers growing corn for them instead of properly growing FOOD for us.
• Need more solar and wind energy
• Place to have more utilities underground
• Strong reliability on coal (which has recently been a strength)
• Geo-thermal focus for facilities large enough to use it
• 120 employees lost last 2 years
• Cost. Cloudy and or not windy days. Not reliable due to weather (in regards to windandsolar).
Opportunities
• City leaders have a last chance to present many solutions that affect whole population and should do it. Need to convince us to stop using fossil fuel and change how we live. Federal govt. wont do enough. Must be on local level, every US town andcity.
• Largersolargrid
• Moresolarandwindpower
• Newmfg/industry
• Rebatesonsolar
• Solar panels and conical wind-catchersonrooftops.
• Additional focus on solar fields
• Highlight expand, share use ofcleancoal
• Weownourownutilities.Can position ourselves an energy and environmental leader and make Hastings a hub for new energy sources to marketacrossthecountry.
• GoodPay
• Would like to see opportunities for solar on individual homes as well as solarfields
Appendix B - Community Engagement
• Make more power for households without using fossilfuel Threats
• Environment
• Threat to environment with CO2 emissions
• Weird opposition to anything that has “environmental” attached to it. Denial of global warming and manmade destruction of environment.
• Bettermanagement
• People who don’t believe in climatechange
Hazards
Strengths
• Climate change - the fact that we recognize it and have addressed it here in the past(notcomprehensively)
• Think the community is very wellsetinthisarea!
• Amount of agro-chemicals in air,water,soil
Weaknesses
• Air quality monitoring needs to be communicated regularly Opportunities
• Notenough Threats
• Re: Air quality - concerns relating to air-quality threats with new bio-diesel plant beingbuiltnexttotheenergy centerandCCC
Housing
Strengths
• DowntownRenovations
• NorthParkCommons
• TheaterDistrict
• Great variety of housing reflecting the History of Hastings
• Landisavailabletodevelop
• Some developers working on affordablehousing
• Qualityrentalproperty
• Massive energy census of all
Hastings homes to determine energy efficiency, and starting with least efficient homes, make improvements in homes - fix holes in foundation, put insulation in roofs, plant tree on southern exposure,etc.etc.
Weaknesses
• Need more affordable housing for young working families and older fixed incomepeople
• Too often is said we don’t have enough housing… impossible to believe… maybe not enough affordable housing… taxes are too high - insurance too high maybe - supply and demand - as a landowner I don’tseerentalspaceinthat highofademand
• Trailerparksneedcleanedup and made safe for the occupants.
• Need subdivision retention and detention cells where needed.
• Maintenance of private homesinoldareas
• Clean,safe,rentals-lackof
• Lack of housing to support workforce
• Lack of affordable housing to getastrong#available
• Verybadlydesignedprevious plandealingwithhousing!No contact with landlords which blows the valid [sic] and presents slanted information. Makes me question the validity of this survey and its impactonthecompplan
• Neglected
• We need an option for homelesspeoplewhoarenot able to go to crossroads. (short and long term). Also need housing opportunities
for median and low income peopleandfamily[sic]
• Plans for homeless that are mentally ill or substance abusesissuesdoesnotexist.
• Expense Opportunities
• Need more affordable housing
• Intentional senior communitieswithamenities
• More opportunities to age in place
• Education of residents to benefits of being in hist. dist. City would provide incentives forappropriaterepairs
• Moresinglefamilyhouses
• Funding to improve blighted properties
• More multi purpose areas like downtown apartments aboveretailspace
• Build more housing; can provide others (renters) to purchase/renovate older homes
• Mixed housing in precincts to avoidhigh/lowpropertygaps
• Grant funding through fed and state for affordable housing. Partnerships between private developers andgovernment
• Energy efficiency helps climate change problem, owners need less electricity withheatandcoal-cheaper Threats
• Neglected houses affect neighbors, diminish tax base. Complaints of lack of houses could be better addressed. (For example there are 2 houses vacant in 1000 blocks of N. Denver and have been foryears)
• Difficult to build housing that is affordable. Difficult for developers to make a profit onaffordablehousing
• Land owners don’t check properties
• Housingshortages
• Competition in available and affordable housing in surroundingcommunities.
Land Uses
Strengths
• #ofparks,greenspace,lake
• Greenspace downtown, parks
• Zoningisstable
• Oldmallredevelopment
• Development in city of series of tiny homes for 1-2 homeless people in each, withsmallyardforgarden.
• Community gardensseveral, organized and fundedbycityprovidefood. Weaknesses
• Createslarge amountofCO2 and methane emissions, very bad for climate change problem. Also noise pollution that most of east and south Hastingscanhear.(inregards to industrial uses on Highway 6)
• Takes money for seed, tools, and time to donate to planting, seeding, etc. (in regardstohomegardens)
• Factories nighttime cooling fans cause problems for surrounding properties - noise pollution
• Negligent plan south of the tracks, plan community facilitiesandinfrastructure
• Adopt industrial noise ordinance again - to alleviateissues.
• City owns too much property maybe as much as 1,000? Or they have too much interest in property. Much of downtown property is controlled by say CRA, BID, DowntownAssociation.
• 11 years ago, Kearney owned 6 properties, Hastings owned600.Thisisataxissue.
• Not enough maintenance on
Appendix B - Community Engagement
our“old”properties.
• Harassment to owner of old JuniorHighSchool
• Casino
• Polluted,silted
• Lack of natural/wild spaces andnativeplantings
• City/planning and zoning/ permits make it difficult to make changes. Re-zoning is verydifficult
• Develop spots for industry andjobs
• Tookto[sic]long
• City would have to underwrite costs (in regards totinyhomes)
• Cost. Security from theft. City would have to fence it, provide water source, tools, shed for tools, apportion out plots (in regards to communitygardens).
Opportunities
• Prepare more land to be ready for Developers Vision andAction
• More food at less cost. No need for all our produce to beshippedin.Waytointerest the kids in biology. Food that hasn't been sprayed with pesticide, herbicide. Interest in home gardens night encourage more farmers to growveggies!
• Hastings yards are large enough for home gardens. Thisshouldbeencouraged!
• Not just beautify/manicure spaces but rewild for local species of plants, birds, insects
• Improve safety of dog parksso that leaching doesn't happen
• Morebusinesstoopen
• Get homeless off streets with own small home and neighbors (in regards to tiny homes).
• Way to provide food to poor, teach gardening, give hope (in regards community garden).
• Close this and instantly help air be cleaner. (in regards to industrialusesonHighway6)
Threats
• Whatisthe land useproposal for the tract of land north of Walmart and east of Baltimore Ave. Proposed casino - is this in keeping with comprehensiveplan?
• Only threat would be to grocery stores, but not everyone would be gardening, so they’d still sell produce (in regards to home gardens)
• Lack of development/lack of bringing in business will stunt growth
• Contribute to Climate Change. Should be closed down.(inregardstoindustrial usesonHighway6)
Natural Resources
Weaknesses
• Using too much water on lawns
Opportunities
• More native plants less water use
Threats
• We have about 5 years to make a difference before climate change becomes self-sustaining and unstoppable
Parks and Recreation
Strengths
• Crosier Park - new facilitygreat
• Splashpad-great
• Manygreatparks
• Bikepath
• Current parks and playgroundequipment
• Bikepath/pickleballcourts
Appendix B - Community Engagement
• WehaveLakeHastingswhich provides a smallish opportunityforwatersports.
• The parks are wonderful. The new playground equipment paid with the 1/2% sales tax are great especially the handicapaccessible.Thetrail isgreatandgrowing
• The Car Race Track on Hwy6 -verypopularwithsome
• Parksarewellmaintained
• Park playgrounds are being updated and attractive to all children
• Parks look great - Parks and Rec department works hard to provide activities for wide varietyofcitizens
• Softballcomplex-looksgreat and brings lots of visitors to community
• Greattrailsystem
• Beautiful parks showcase our city. Out-of-town visitors are alwaysimpressed
• We have beautiful parks and playgrounds that are well maintained.
Weaknesses
• Lack of staff at water park duringsummer
• More events promoted at BrickyardPark
• Lack of sport leagues. YMCA istoocrowded.
• HastingsLakeisverydirty.
• Bike path is mainly recreational but not for actual transportation through Hastings
• Poor judgement in management
• Tearing down warming house, ugly new bathrooms, ugly playground equipment should have been made to blend in to its environmentspending money we don’t have - should be spent on streets
• Boats might be too expensive. (in regards to watersports)
• Highland Park needs improvements.
• Dealing with problems in slow fashion - need to be proactive
• Need to assertive [sic] with summer employment opportunities - pool guardsstaff
• Main improvement to parks and trails have been funded through grants and 1/2 cent sales tax. Not a budget priority for parks maintenance.
• Trails non-existent on south side
Opportunities
• Encourage More Community andAreaUse
• Indoor Football/Soccer facility.
• CleanupHastingsLake.
• MorefacilitiesoutsideYMCA
• Connect the college and the Middle School to other parts oftown
• We need walking bike path toconnectareanorthof26th east of Spady for new residents to connect with the walking trail. Without walking on26thStr.
• The City could provide a energy-free recreation if they bought 6-8 small 8-foot sail boats, hired a sailor, who could give sailing lessons to kids in the summer, maintain the boats, rent boats to new sailor kids. This is a quiet type of fun (unlike motorized craft) andagoodskilltohave.
• The nice parks are attractive to new families and people whoenjoytheoutdoors
• Elm Tree Borer - Dealing with Activate Plan - Over 100 elm treesinHeartwellPark
• Plan for using diseased elm treesbesideslandscapebark
• Lack of funding for trail expansion. Apathy among citizens to walk or bike places. Difficulty with trail on south west sides because of older neighborhoodsdifficulttoimplementtrails
Public Health
Strengths
• Community Covid Response with multiple specialty providers
• Walking/bike path and for publichealth
• Qualityhealthcareproviders
• MLMH
• South Heartland District HealthDepartment
• SHDHD,greatjobthruCOVID
• MaryLanningHospital
• Morethanoneclinic
• So. Heartland District Health Dept - well run, excellent resource
• SHDHD - Partnerships with local Healthcare and nonprofits
• South Heartland is effective andnecessary
• SHDHD - good resource for community
Weaknesses
• Comprehensive mental healthaccesstoservice
• Need to strongly consider Direct Provider Agreements. ReducetoCostofTotalCare
• Lack of mental healthcare providers in general and specifically for low income/ slidingscale
• Food security for low income families
• No free dental for emergencies
• Understaffed-sadly
• Communication between agencies(isthereduplication ofservices)
• Needquickerresponses
• Understaffed.
• Need more mental health providers for adults and children Opportunities
• More community-based mentalhealthcare
• Strong partnerships between “healthcare”agencies
• Retentionofyoungpeople
• Needmorevolunteers Threats
• Resistance to adhere to public health standards. “Me” mentally rather than “We”
Public Safety
Strengths
• Welllitstreets/biketrails
• Lowcrimerate
• Generally a safe community. Ifeelsafehere. Weaknesses
• To [sic] much Drug use and Sex Traffic. Just now learning ofthis.
• Uncontrolled intersection near grade school (i.e. - 2 intersections north of Longfellow on N. Denver. Drivers speed between 9th and 12th St and seem not to know to yield to driver on the right)
• Needmorepoliceofficers
• Need more or better drug enforcement
• I see frequent disregard for stopsigns.
• We have lots of homeless people
Appendix
• Inconsistent walking pathwaysinneighborhoods
• Some neighborhoods have sidewalksnexttothestreet
• Are the police department and fire department at full staff-non-voluntaryovertime
• Neighborhoodpolicing
• Risky drivers going through yellowlights
• Many drivers may not legally insured
• CDL license are not required of all truck driver especially farmvehicles
• Drivers ignoring crosswalks and the children standing in them.
• In town speeding. Speed limitsnotenforced.
• Wehavepeoplewhoneeda safe place to go during the daybesidesthelibrary. Opportunities
• Moredefensivedrivertraining foralldrivers
• Increasepublicsafetyofficers
• Install yield or STOP Signs on E/WStreets Threats
• PoliceDepartmentstaffing
• Burglaries
• Decrease in people wanting to be in law enforcement/ fire/EMT
• Burnout among out public safety officers because of lackofstaff
Transportation Strengths
• Walk/bikepaths
• Good traffic flow, increasing bikepaths
• Roadsrepairsarefairlygood
• Rydeisgreat
• Some bike paths in north Hastings.Needmore.
• Lots of young people on motorcycle skateboards and people in motorized wheelchairs riding the streets instead of sidewalks - not carrierfree
• Somegoodcement(smooth) streets
• Many old durable brick streets,butcoveredup.
• Flat terrain - good for bikes, trailtakers,trolleysystem.
• Bicycles-cheaperthancars. Weaknesses
• Potholes
• Need turn lanes with turn signalsat7thand9th
• Train spur from Highway 6 often blocks crossings South ofAStreet
• Clearing of snow on roadways is extremely subpar compared toother cities. Don’t get close enough to theground.
• Publictransportation
• No Lyft, Uber, Ride bus not usefulforimmediateneeds
• Speed limits are too slow. (wayslowerthanothercities). Flow of traffic in this town is poorconsideringpopulation.
• Could use another 2nd option for people to go to doctors appts shopping etc [sic]
• South Baltimore: 281 and Highway 6 needs signage to direct through truck traffic on Hwy 6/281 - not through personal area. Enforce truck routes,keepoutofresidential areas, loud traffic. Need to enforce speed limits on South Baltimore.
• ClosedSouthStreet
• State of Nebraska - working withCity
• Need to complete walking trails
• Need transportation from South to North parts of town for families or persons without transportation
• Railroads need to be cooperative
• Properties don’t have sidewalks that should have
Appendix B - Community Engagement
them. Snow removable from sidewalks is not enforced making it veryhard to walk in thewinter.
• School crossings are not protected for students in somehightrafficareas.
• Impropermaintenance
• Narrow streets, bike lanes don’tfitinwell.
• No bike lanes along streets. Needsomeeverywhere.
• Bike paths don’t exist in south Hastings.
• Trolley system very expensive. Hard to sell to residents. Peoplearesoaccustomedto instant gratification, getting into car and driving somewherequickly.
• Bicycles - no bike stores. Not goodinwinter.
• Snow and rain and wind hinderbiking.
• Runsonfossilfuel.
• Getting the RR to build it. Having to wait for trains to pass.
• Trail system doesn't run through whole community and doesn't connect to manythings
• Many sidewalks in poor condition
• Lack of transportation for people needing rides to doctors appointments grocerieserrandsetc.
• Not much in public transportation - taxi, uber, etc.
Opportunities
• Build out more trails to connect other areas (Westbrrok,Lochland)
• Improve South side infrastructure - sidewalks, bikingpaths
• Could use bridge/overpass overtraintracksonBaltimore. Could use more turn signal lights
• Federalinfrastructuremoney
proper training - both in and aroundcommunity.
• Lack of updating infrastructures.
• All that cement is bad for environment(CO2 emission).
• Trolleys running on electricity might soon be powered by solar or wind. Good for those without bikes, the elderly, infirmed,handicapped.
• Children biking to school would enable less CO2 production by their parents’ cars.
• A bus system would provide transportation for many at once.
• Railroad (RR) crossing where old viaduct used to bewould allow cars, bikes, pedestrians to cross easer and faster. Direct route for northeastquadrantoftown.
• Bike paths provide fast direct travel without worry about vehicleshittingcyclist.
• Comprehensive change to bikes would help us reduce climatechangeinsmallway.
• Trolleys on railroad tracks around town and running on electric wires would provide instanttransportation
• Bikes don’t run on fossil fuels. Cleaner air. Roads last longer.Goodexercise.
• Good exercise. Great way to lessenclimatechange.
• Getting a population to accept slower means of travel
• Avoiding the 2 bridges over the railroad which are far from most of northeast Hastings, slope hard to pedal up. Advantage to residents of area near Menards who want to get south faster (bike tohospital).
Threats
• Farmers driving semis without
• If there is no better and affordable public transportation for those without there [sic] own vehicle they can get to the hospital, shopping, and schools.
• Trolleys would take over half every street they’re on. Preventparkingcarsthere.
• Carsarebigthreattobikes.
• People who love fast cards [sic] wouldn't like hoards of bikes,
• Pollution. Doesn’t help stop climatechange.
• Peoplegethitbytrain?
• Highway 281 - Burlington handles turbine traffic and which impacts traffic safety throughthecity.
• Combinecaravans
Miscellaneous Comments
• I would like to see more recreational activities such as Top Golf, golfing, pickle ballcourts,oraxethrowing.
• There is no place for men to shop aside from Gary Michaels
• Recyclingislimited
• Speed limits should be raised both inside and outside of city limits, especially under theBurlingtonoverpass
• We need a community center such as the City Block project
• A bar with outside space would be a great amenityfor downtown. Event space is lackingdowntown
• This survey and your whole effort seems to be focused mainly on economics and the assumption that life will continue much as it has done. It soon won’t. You’re ignoring the proverbial “elephant in the room”, namelyclimatechange.Your effortsmustincludetheeffect of climate change on social,
cultural, educational, healthful, and economic life. Otherwise it will soon be immaterial. You should be asking some different questions. This town and everyone of its citizens on families needs to be thinking how to respond individually toclimatechangeinorderto lessen its looming impact. Every community should be doing this across the USA! How willing are we to stop burning fossil fuel - that’s the overriding question and how can Hastings city govt help us do it? What are the ways individuals and businesses can accomplish this? What changes should the city impose? How willing are we to begin living lives of less convenience, less reliance on energy (electricity generate by coal, gasoline, diesel, propane, etc.). Federal policies and regulations help, but slowing down climate change now (we don’t have 20 years, or even 10) is truly up to us, the people, and their local governmentsandleaders.