Use of LIDAR
Scanning and BIM in Quality Control in Modular
Construction
Z-Modular, Zekelman Industries.
by
Angel Damian Chalan Jumbo
2B Architectural Engineering
September 2021
200 University Avenue West
Waterloo ON N2L 3G1
September 21, 2021
Dr. Brush
Associate Chair, Undergraduate Studies
Department of Civil and Environmental Engineering
University of Waterloo Waterloo, ON N2L 3G1
Dear Dr. Brush
This report, entitled "Use of LiDAR Scanning and BIM for Quality Control in Manufacturing," was prepared as my 2B work term report for WKRPT 200, for the Department of Civil and Environmental Engineering. The purpose of this report is to provide insight into the integration of these practices and their role in modular construction in the pursuit of quality control optimization
This technical report was prepared based on my co-op term at Z Modular, Zekelman Industries. My responsibilities included the coordination of the architectural and shop drawing production using the software Autodesk Revit for creating BIM models, coordinating with MEP design, collaborated with numerous engineering and architecture firms and teams in the integration of modular detailing, and helping into the automation process of the scan analysis inspections at the manufacturing facility.
This report performs an analysis insight regarding the use of these technologies in the construction ecosystem and how Quality Control can be optimized using automotive design. I would love to thank Chris Rausch, software manager at Z-Modular who helped me through the scanning process and its backend engineering, as well as David Warne, Vice President of Z modular, who gave me the opportunity to become involved in this process and allow me to discuss this implementation as part of my technical report.
This report was written entirely by me and has not received no help other than the mentioned above. I confirm that this report has not received any previous academic credit at this or any other academic institution. All photographs and models presented were taken or modelled by me unless noted.
Sincerely,
Damian Chalan ID# 20794892
Use of LIDAR Scanning and BIM in Quality Control in Modular Construction
Z-Modular, Zekelman Industries.
by Angel Damian Chalan Jumbo
2B Architectural Engineering
September 2021
Executive Summary
The following report discusses the integration of two new growing technologies in themanufacturingofsteelpipechassisformodularconstructionprojects.Thisprocesshas been automated by Z Modular and it allows to predict any anomaly regarding the dimensional and geometry variability into the module production. As with any other manufacturingprocess,theroboticsandautomationdesignallowafasterproductdelivery andbetter-qualityassessment.
BIM isagrowingfactor in theArchitecture, Engineeringand Construction Industry (AEC) provides an accurate 3D Model building representation. This methodology largely opens the integration of several other disciplines, and it allows constant iterations of the whole structure while not suffering any integration damage toits other dimensional data, such as detailing and shop drawing production. LiDAR is a sensing method that allows capturinga3Dimagefromanalreadybuiltobjectoranyreal-worldobjectthatpresentsa surface. Combined, this relation can give us an approach in how to control tolerancing in manufacturingproductsbysharingtheirinformationonapointdatacloud.
Throughout this report, each of the stages for a particular steel pipe chassis is analyzed during its scan phases in the manufacturing factory. Several profound analyses related to the risk associated with tolerancing problems are explained, as well as the current framework that manages it. Insight regarding these technologies is also explained asitisusefulforunderstandingitsimplementationinmodularconstruction
Finally, the report concludes the used methods and analyses the software automated output that is generated, where the respective tolerance framework can be outlined for further action items. Like other technologies, it allows space for optimization andfutureimprovementbyiterationsandroboticsimplementation.
List of Figures
List of Tables
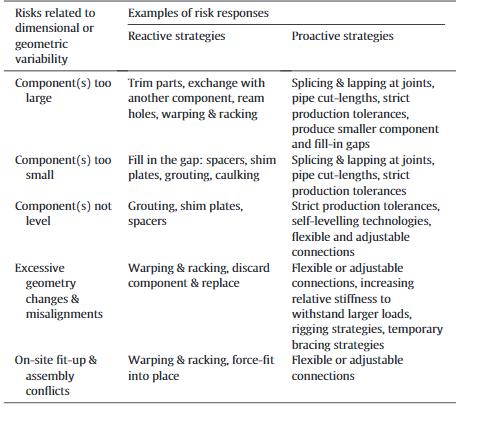
Table 1. Corresponding risk responses and strategies (Shahtaheri, Rausch, West, Haas, & Nahangi, 2017) 7
List of Appendices
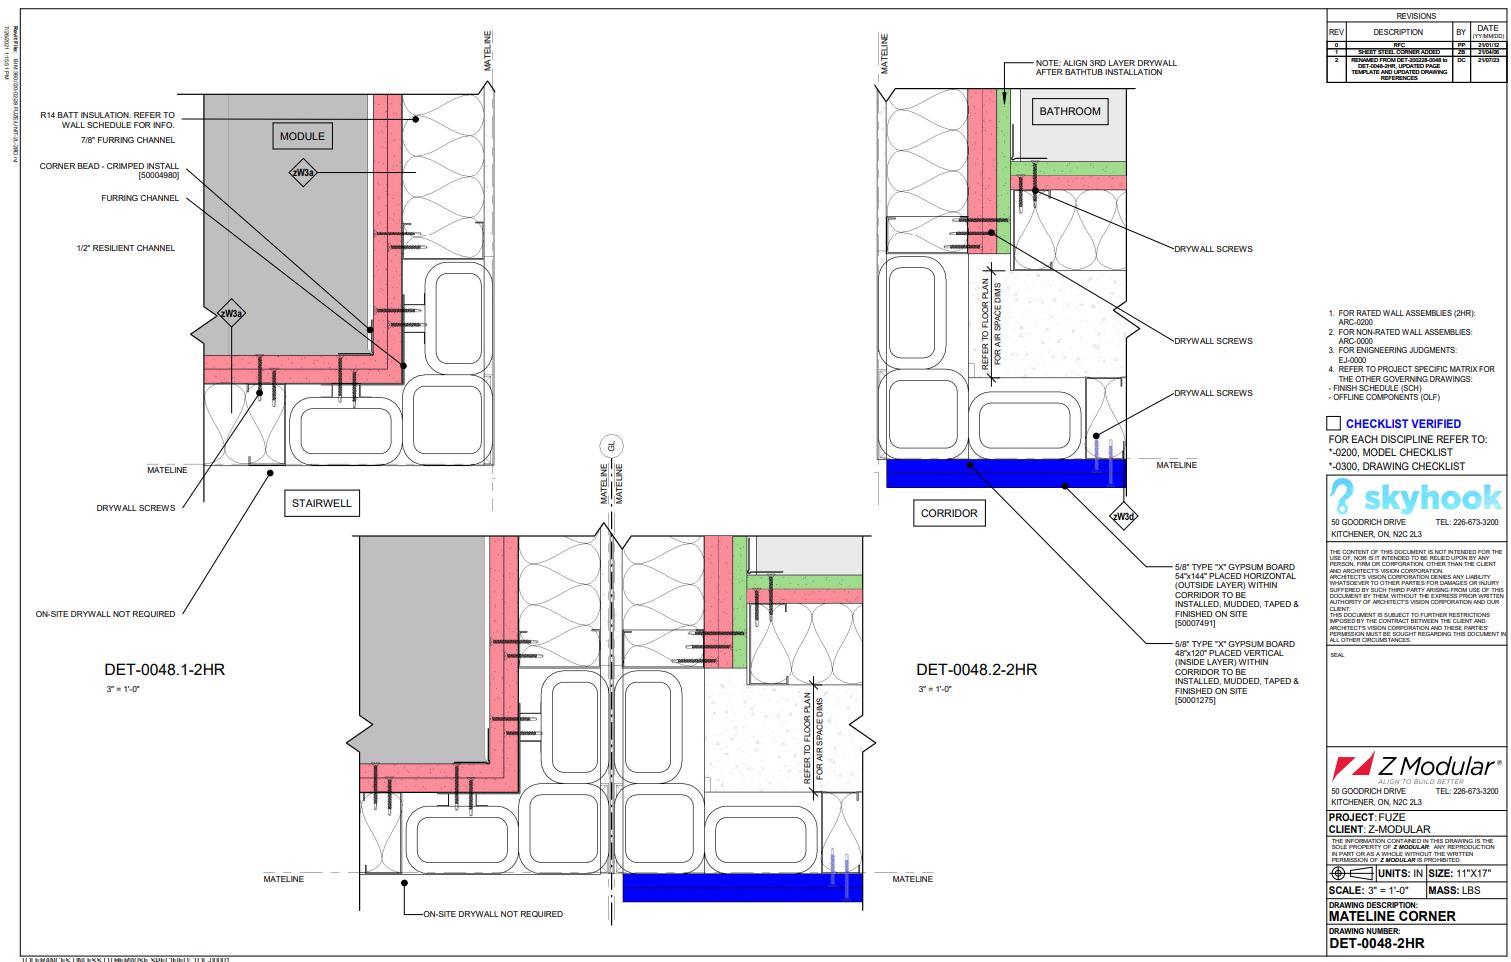
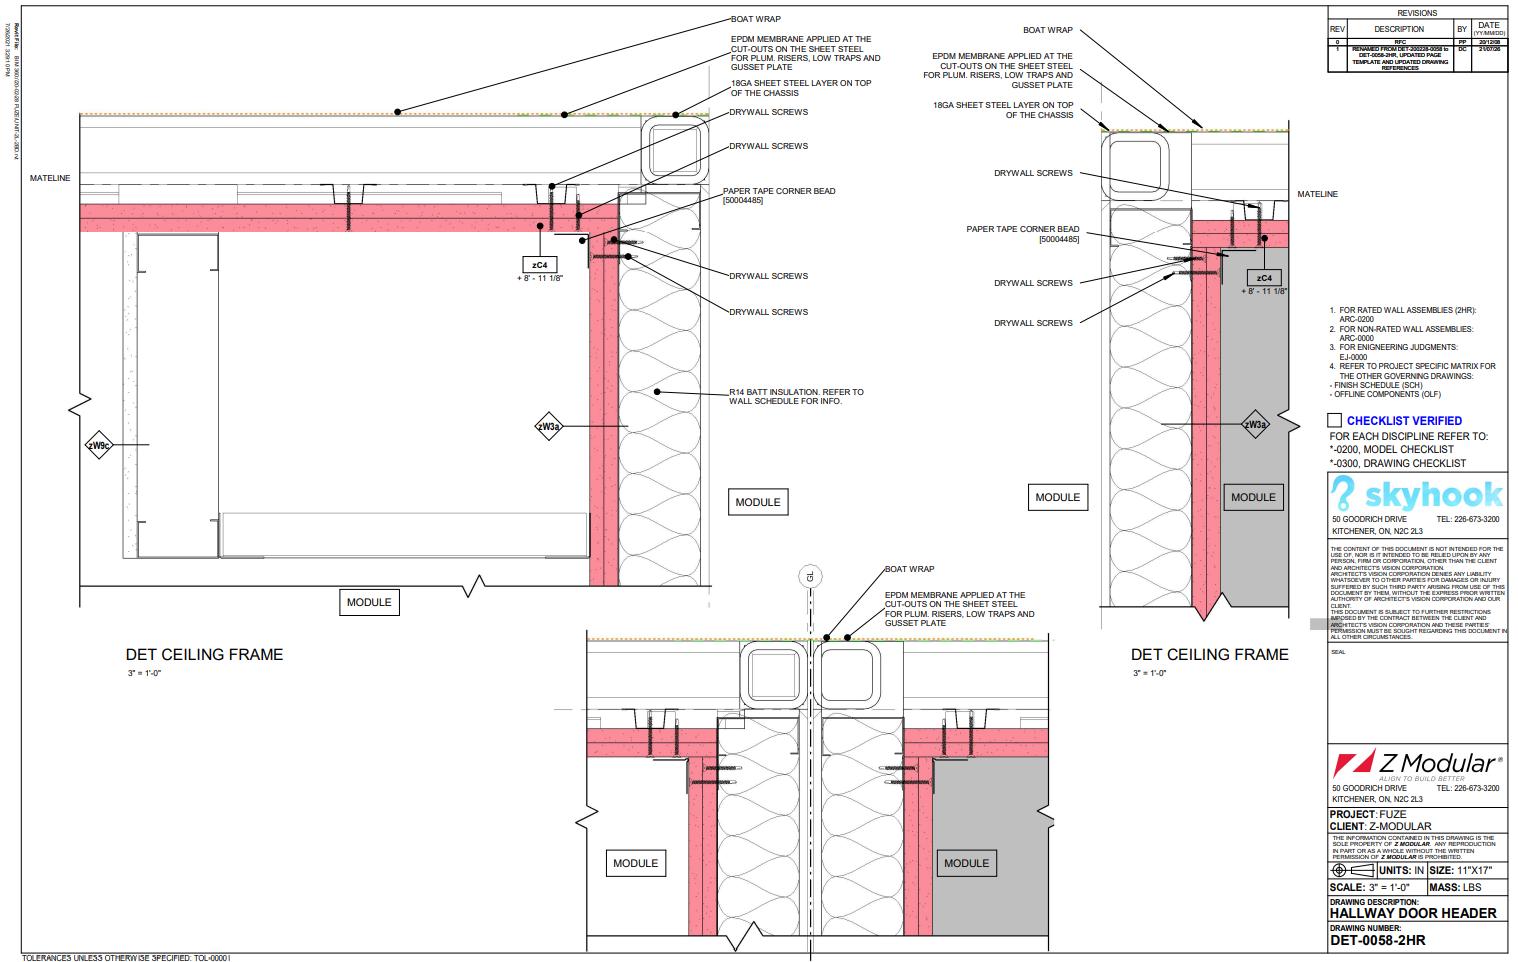
Appendix A: Chassis Shop Drawings........................................................................................... 18
Appendix B: Module Detail Drawings 19
1. Introduction
Urban growth and rapid planning and development for cities have pushed the constructionindustrytobecomeasectorwithoptimizationand automationopportunities Many practices were born from that demand of progress, like the use of different new materials and implementation of technologies, but one of the strategies that has grown is prefabricated construction, more specifically modular construction. Prefabricated construction is a process where the parts or components of any infrastructure have been already constructed off-site (Ng, 2006). In modular construction these parts are being separatedasrepeatablebuildingcomponents,alsocalledmodules,withslightbutessential variations that are assembled in a plant and transported to the designated site for their stackingandinstallation
This practice transforms the traditional onsite labour work into a manufacturing process, which has been considered a cleaner approach as it can improve construction productivity,decreasehealthandsafetyhazardsforworkers,labourdemand,construction timeandmitigateconstructionwaste(Enshassi,Walbridge,Jeffrey,&Haas,2019).Overall, this provides a large cost savings framework for the project and a significant impact on future construction industrialization in the AEC industry. Despite all the benefits that this manufacturing approach has been implemented, there are still several inside sectors that can be optimized and improved by taking advantage of the controlled environment that modularconstructionoffers.Oneoftheintroducedchallengesthatcanbemitigatedinsuch an environment is the quality control of the dimensional variability in the module production In modular projects, this variability aspect could compromise the entire building structure as it leads to bigger and cumulative dimensional changes at its on-site installation.
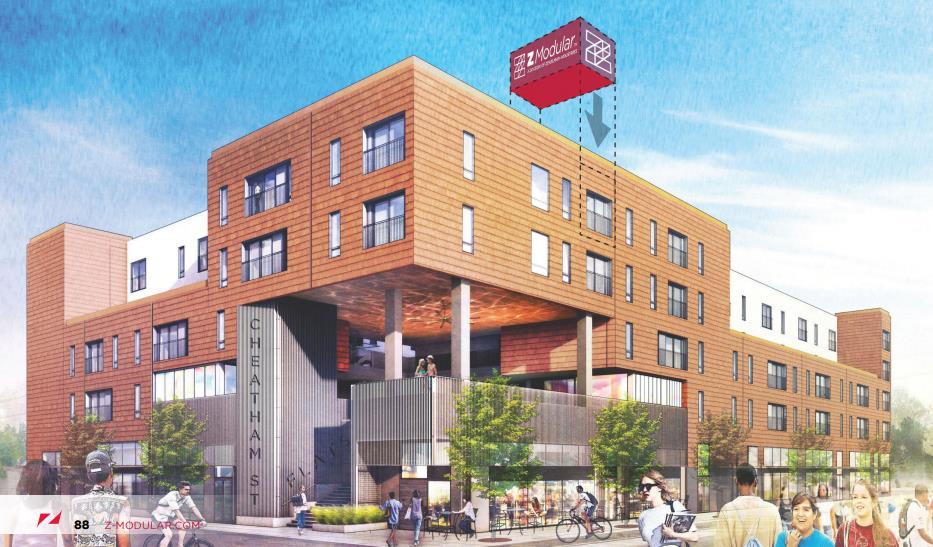
1 Modular project illustration of a housing development in Texas, USA (Z Modular, Zekelman Industries, 2021)
1.1. Risks Associated with Tolerancing
In engineering, dimensional accuracy is the key factor in the further development of newtechnologies.Inthesamemanner,themanufacturingproductcomponentscanlargely affect the final product. In modular construction, the quality of each module is highly importantinthepursuitofachievingbetterandmoreefficientbuildings Consequencesofa poorly arranged tolerance management can lead to misalignments, for instance, in joints andfaçadecomponents.Thiscanpotentiallyincreasetheoverallprojectcostoverrunsand the probability of building installation damage, such as water leaks which are a common problem.Otherissuesrelatetotheprecisionofthebuilding’ ssystems,structuralandMEP module to module connection, where the accuracy and site stacking are significant influencingfactors
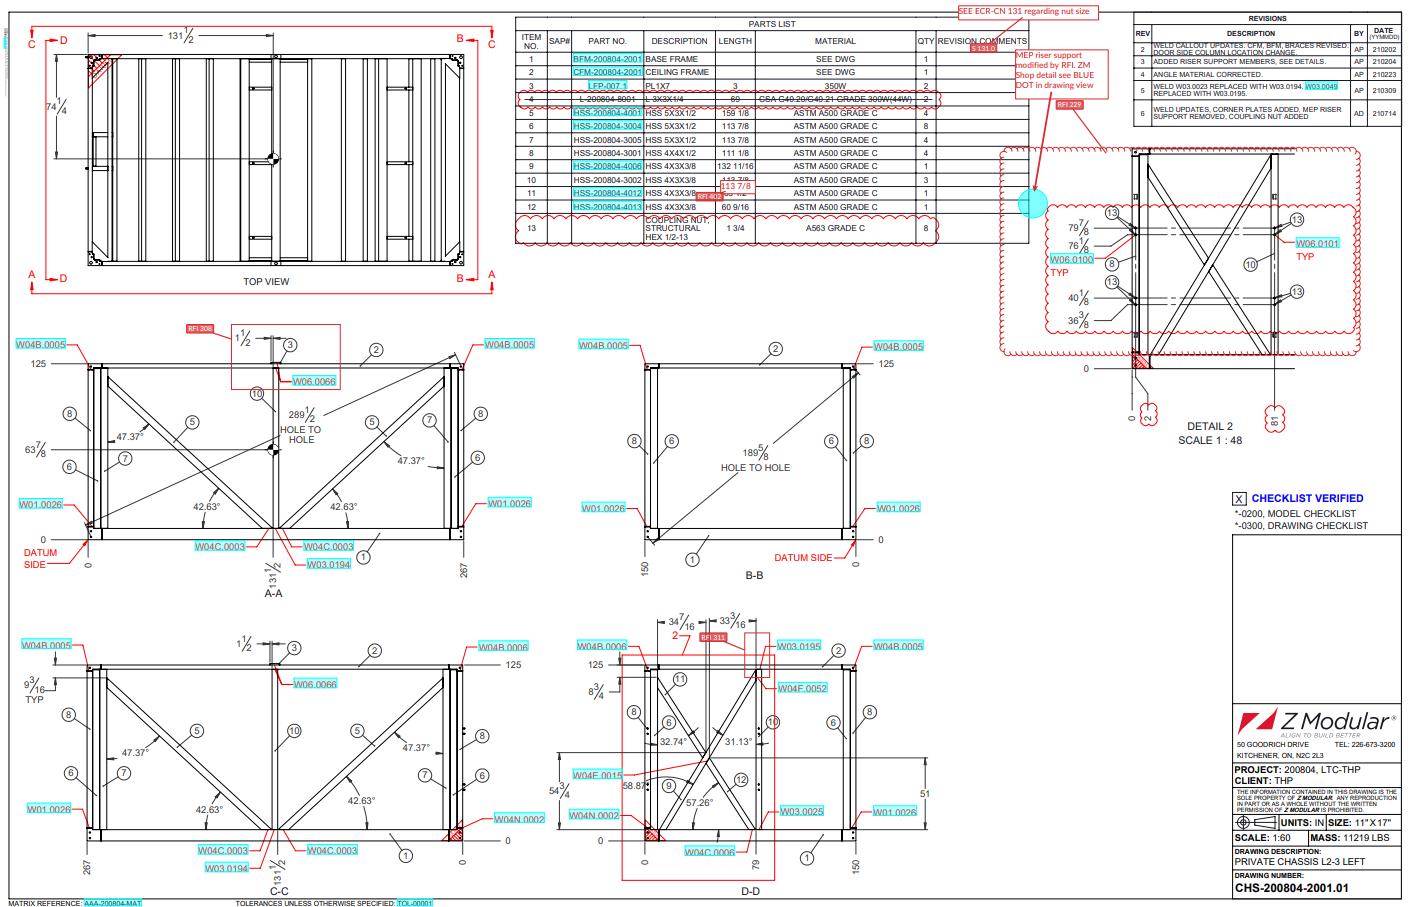
Figure
2. Example shop drawing that displays the Module-to-Module connection in a plan view section.
2. Quality Control in Modular Construction
Early troubleshooting of deficiencies is to beidentified by the quality control methods that the off-site facility is implementing. This stage is crucial as it helps to avoid project costsandscheduledelays In2009,forinstance,itwasfoundinaninvestigationbyJohnson and Meiling that from quality audits of 17 modular housing projects, between 45% and 50% of the audits were reported during the manufacturing process (Johnsson & Meiling, 2009).Thismeansthathalfofthedefectsregardingqualitycanbetroubleshotintheshop. Commonly, this process is run by the company’s personnel that can be limited in the way thatitrequiresconstantinspectionvisitsoffandonsite,gatheringofdata,thehumanerror thatisaproductofthatdatacollection,andcommunicationwithdesigners,andengineers foractionplansandtroubleshootingthatisnotalwayspromptlyidentified.
Figure
2.1. Tolerance Framework
With the variability challenge that comes into place in manufacturing and, more specifically, modular construction, the term of tolerances is introduced. Tolerances are definedastherangeofallowancethatavaluecanvaryfromitsnominaltoitsoriginalsetof data(Lawson,2014).Inmodularconstruction,thistoleranceiscommonlyassociatedwith twodifferentdivisionsthatarethemainfactorsofthedimensionalvariation.Thesearethe manufacturing tolerance, caused by the production and assembly of the prefabricated components in the off-site manufacturing facility, and site tolerance, associated with the on-site stick-built construction and module stacking alignment (Li, Zhang, & Song, 2020).
This is only a generalization and a common association in the modular construction industry and the tolerance categorization can be handled differently depending on the construction resources. For instance, the Steel Construction Institute classifies its own tolerancesinmaterials,fabrication,erection,andfinalconstructionquality
Similarly, the British Standards of the execution of steel and aluminum structures divide the tolerances into essential tolerances, related to the group strength and stability,
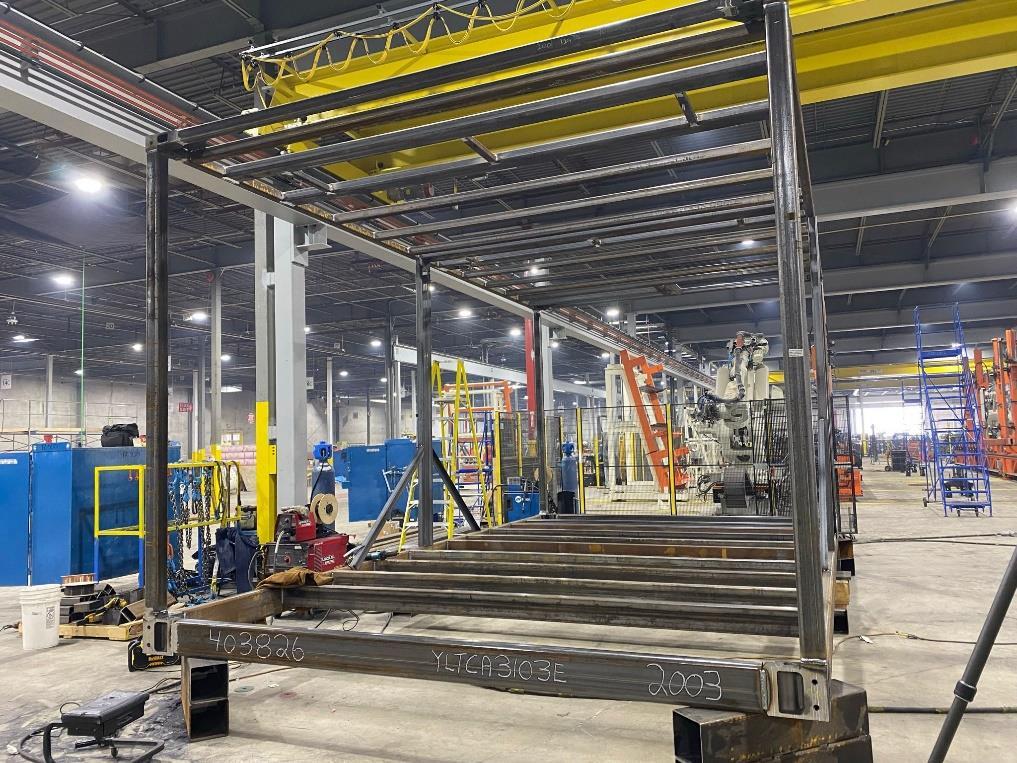
Figure 3 Module chassis at its first welding stage by the robotics jigs assemblers
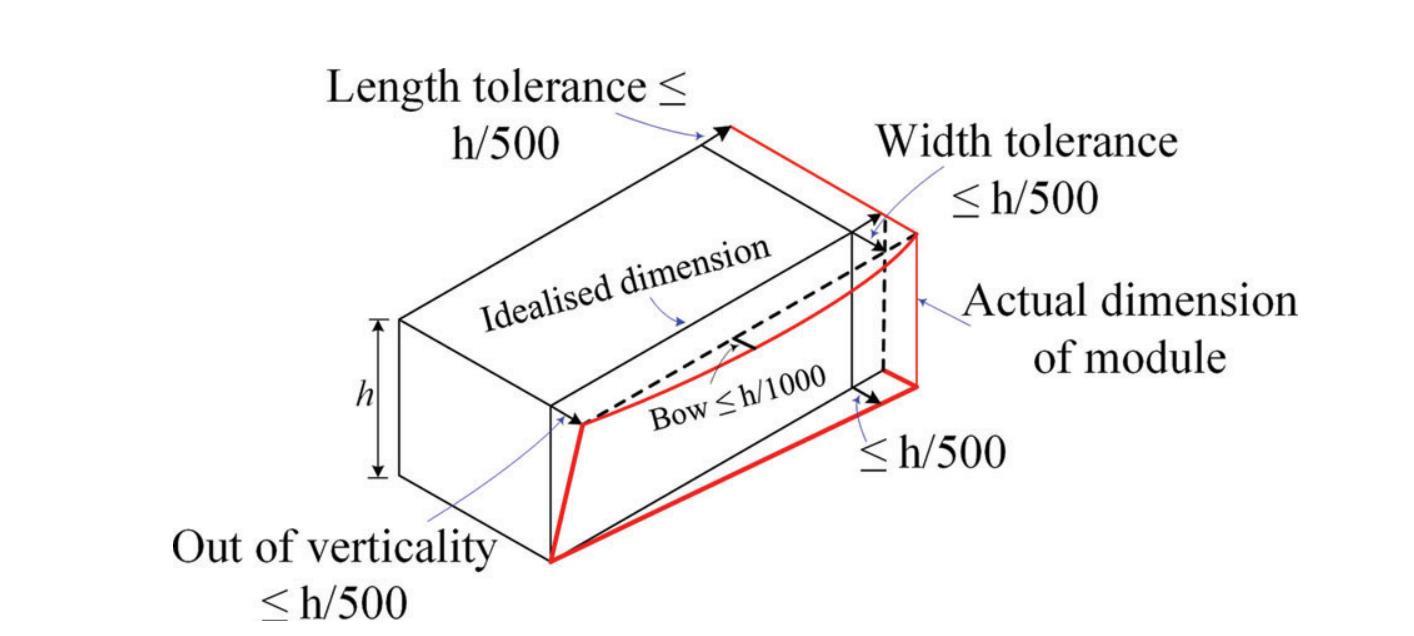
and functional tolerances, more related to fit-up (BSEN1090-2-2011, 2011). Inside the manufacturingtolerances,wecanfindthedimensionaltolerancethatreferstotheamount ofdeviation in termsof distance, linear, angular, or radial, and wealsofind thegeometric tolerance that includes straightness, flatness, perpendicularity and parallelism (AISC, 2016).Allthesecategoriescommonlysharematerialsasstandardandthisisbecausethere are many prefabricated components that are widely used and not necessarily part of the modularindustrysuchastheprecastconcretecomponents.Steelpipeisalsoanincreasing commonmaterialfortheuseofthemodulestructure,alsocalledthechassisandthatisthe one that Zekelman Industries is mainly using for its module fabrication. Figure 4 shows how tolerance allowance is illustrated for module fabrication and assembly that can use severalofthementionedtolerancecategorizations.
In modular construction, there have been many ways of finding properly management methods for tolerances as it opens more opportunities for optimization. Not only tolerances can be better managed, but also factors that contribute to the same or larger scale manner to overall project output. For instance, Figure 5, shows one of the commonworkflowsthatwillleadtobetterefficiencyinthemanagementoftolerancesand
Figure 4 Tolerance Range of allowance illustration in the module fabrication (Lawson, 2014)
the steps to promptly identify and foresee large variability factors in the modular fabrication.
2017)
Some current approaches on geometric variability can be represented in the followingformula
Where P= Probability and A= event.
Depending on the type of event, it can be either reactive or active. Reactive strategieswouldrefertotheresponseoftheeventthatoccurredalready.Activestrategies refer to the prediction of potential problems when purposing solutions. These two approachescanbesummarizedinTable1.
Figure 5. Risk Management example of response plan and management (Shahtaheri, Rausch, West, Haas, & Nahangi,
Table 1 Corresponding risk responses and strategies (Shahtaheri, Rausch, West, Haas, & Nahangi, 2017)
3. BIM and LiDAR Integration
The system of these two technologies in quality control and their relationship with real-time quality control in construction is not generally new. As current methods for quality control require repetitive data collection and onsite inspection, these approaches aim for a more computer-aided process that uses this data for easier visualization. Aside from manufacturing in construction, these practices are also combined for collecting historical data, or existing building projects. This means that their approach can not only be for targeting potential risks, but can also identify them in the post-construction environment In the following points, more profound relation is presented for each approach and how its connection can be optimized and be part of the future automated stage for the AEC community.
3.1. BIM Environment
BIM stands for Building Information Modelling and it had been a changing factor for the AEC industry as it provides a standarized 3D and 2D geometry model that contains all the information and facilities in an accurate modelling of structures, building systems, drafting, detailing and analysis. This computer-integrated method largely eases the building design and enhances the collaborations between engineering teams and firms, and it is because BIM richly
displays the information of a building using the same data from its 3D model representation (Hasan, Torky, & F.Rashed, 2019).
BIM is a multidimensional tool that facilitates design coordination. Every change that modifies the 3D Model representation can also be modelled and its impact will be replaced in all its respective 3D, 2D representations This precision in visualizing 3D modellingfabrication on a largescale setstheoriginal points ofdimensionaldatathat are referencedwhenperformingqualitycontrolandtolerancemanagement.
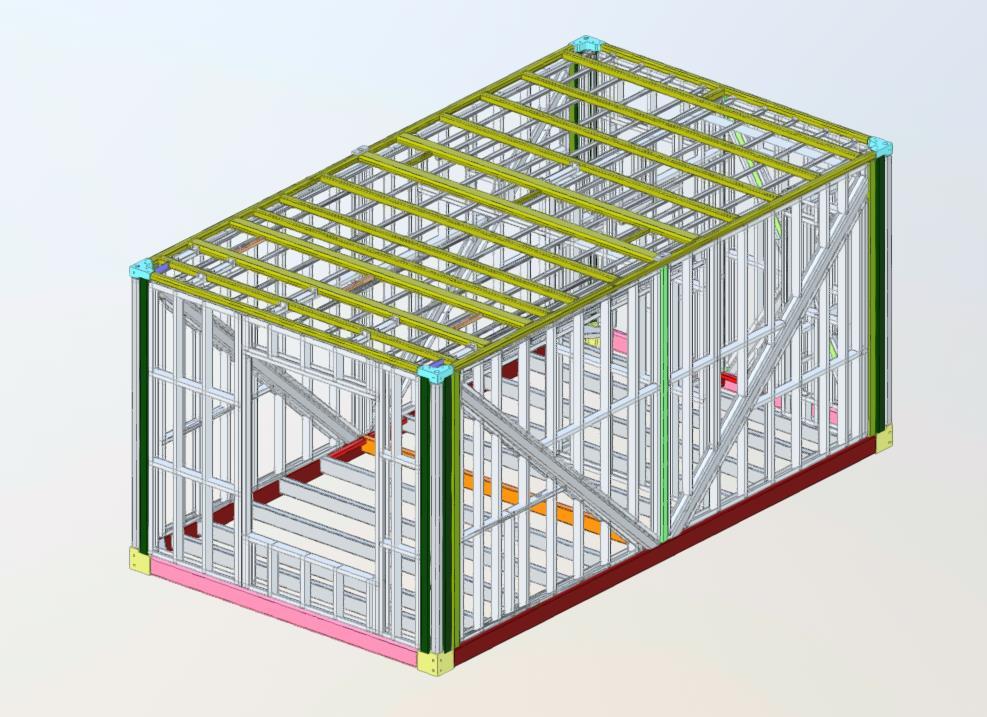
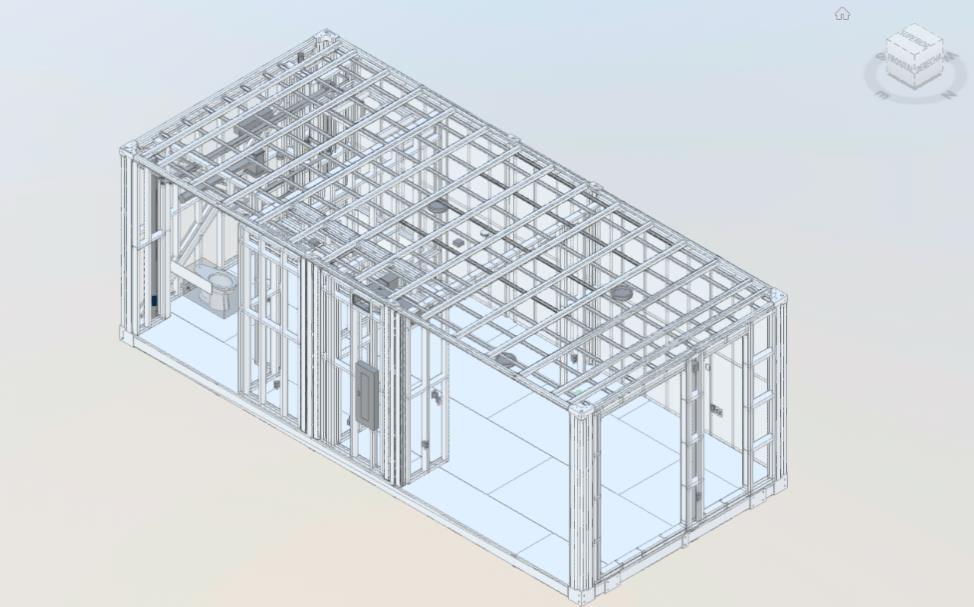
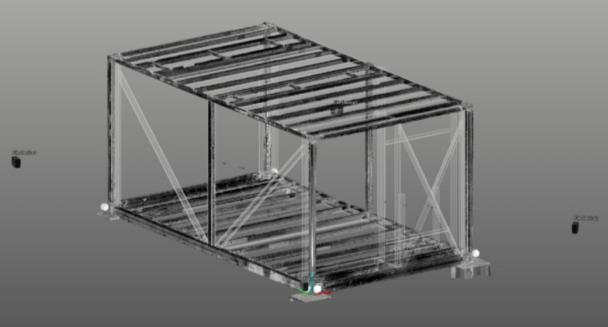
Figure 6. BIM model of a base module chassis conformed by HSS
Figure 7 BIM model of the module integrating framing and MEP components
Figure6illustratesthe3Dmodelledsteelpipechassisthatwasalreadyassembledin the shop Particularly, this stage represents the quality control inspection before the implementationofothertradesrough-inthat canbeseenin Figure7. Allthe3Dmodelled objects present in this visualization were accurately coordinated and modelled for high precisionwheninstalling Forinstance,thestudframingthatispresentinFigure7hasits 2Ddrawingsandinstallationprocessthatistobefollowed accordingtotheBIMmodel.In the same manner other changes made required coordination of other design lead teams, suchasMEPdesign,cementboard,façade,andbuildingenclosuredrawings.Theeaseofa BIM-oriented software like Autodesk Revit allows the integration of other software like Solidworks Software that facilitates the process of modelling, especially when designing steelpipechassisandsteelmoduleconnectionsandjoints.
3.2. LiDAR in Construction
TheuseofBIMtechnologyinconstructionopensthepossibilitiesofhavingother3D visualization technologies implemented into the same computed integrated ecosystem. LiDAR,whichstandsforLightDetectionandRanging,isasensingtechnologythathelpsto measurethedistancebetweenthesurfacedataandthesensor,inthiscaseascanner.This scannerwillcollectextensiveamountsofX,Y,andZcoordinatesandgenerateanaccurate 3D image of the scanned area or object. There are several types of scanning that vary according to the scanner placement, for example SLS (Satellite Laser Scanning), ALS, (AirborneLaserScanning,takeninaplane),MLS,(MobileLaserScanning),andTLSthatis taken by a Terrestrial Lases Scanning, commonly on a tripod. The latter one is most commonlyused asit allowsmorecontrolin termsofprecisionand qualityofdata. Allthe data collected by the scanners is also known as a point cloud, and the efficiency of its collectioniskeywhencomparingittoother3DmodelsliketheBIMgeneratedone.
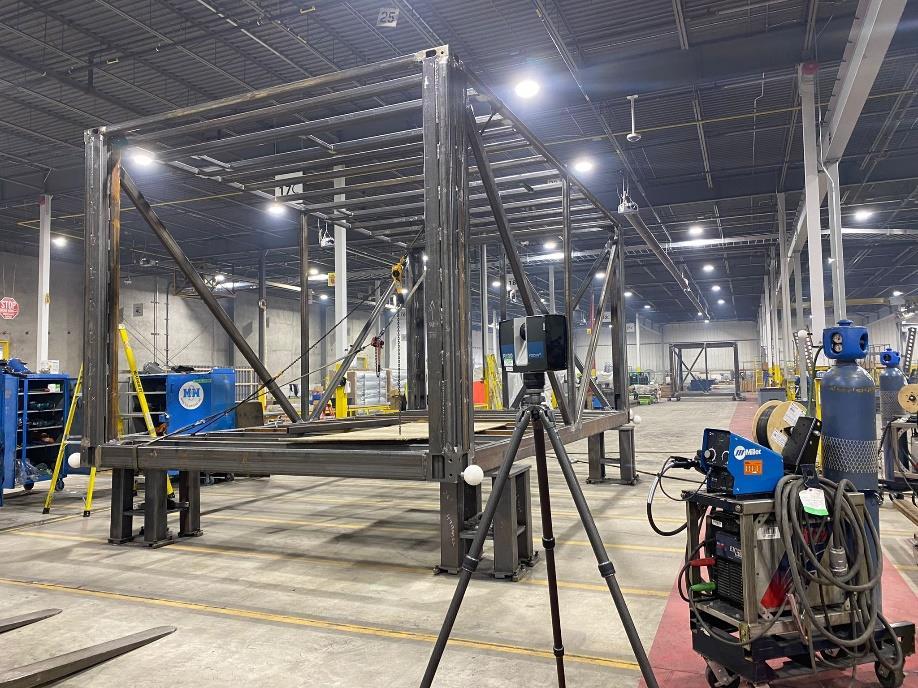
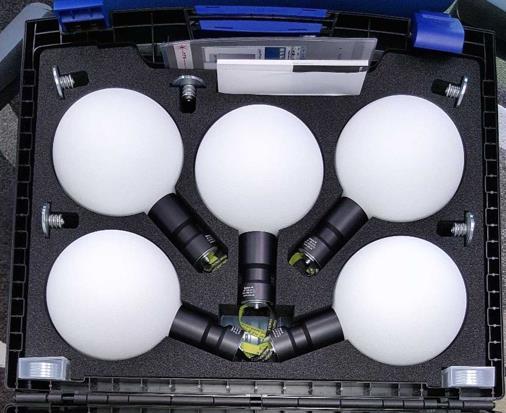
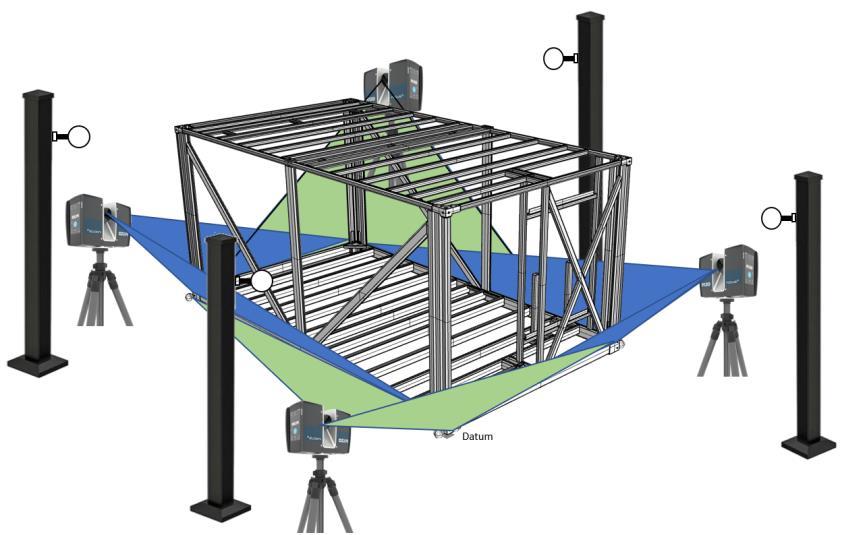
UsingthesamechassismodelinFigure8,theLiDARscannersaresupportedbythe tripodsandplacedaroundthe module.Dependingonthescannermodeleachofthemcan collect a different amount of data. For this practice, the series FARO Focus scanners M70, S70 and Z150 are most commonly used, and they collect an estimated 25,000,000 points during a 5-minute scan, with a tolerance of +/- 1.6 mm Custom tooling is also implanted for improving the accuracy of the scanning and involves the use of spherical ‘’targets’’ shown in Figure 9. These targets are used as points of dimensional reference to allow a bettercontrolandautomationinthedeviationanalysis.
Figure 8. Module and TLS LiDAR scanner placement relation in space
Figure 9 Spherical targets that are part of the scanning equipment kit
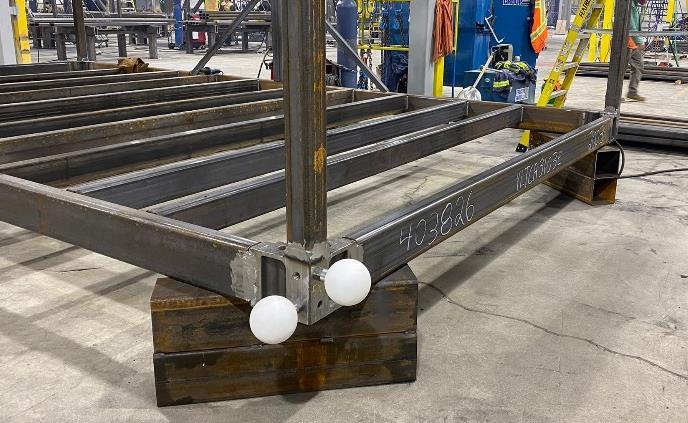
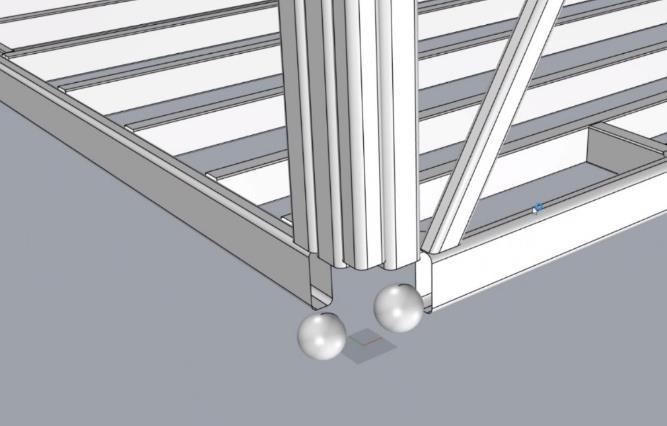
The target placements are based on the pre-established 3D representation of its data. For instance, in Figure 10, we can see that this module corner has been set as the datumoftheclouddata,anditcorrelatestothesamemodelledplacementasthesoftware BIMmodel.Thisisimportantsinceithelpsustoensuresafestartdatathateliminatesthe tolerancesoftherestofthescanningdata.
Therestofthetargetsarealsoplacedinapredeterminedlocationalongthemodule contour. Additionally, extra targets are placed nearby the module at a higher altitude. Thesetargetswillprovidemorereferencedataregardingtheupperpartofthemoduleand its roof assembly since the LiDAR scanner somewhat limited in collecting data from the moduletopduetothetripodplacement.Ideally,mitigatingall these datavariationsinthe pointdatacloudisdonebyautomationanddiscardingout-of-rangepointsbasedontheset tolerance.Thescannerisrunbythefourmodule'scornersand eachoneneedstocoverat least 3 targets in its scanning area, that way the quality data keeps consistent. This placementsetupisshowninFigure11.
Figure 10. Target placement in the datum showed on the chassis (left) and modelled in its 3D model (right)
3.3. Point Cloud Data and Automation
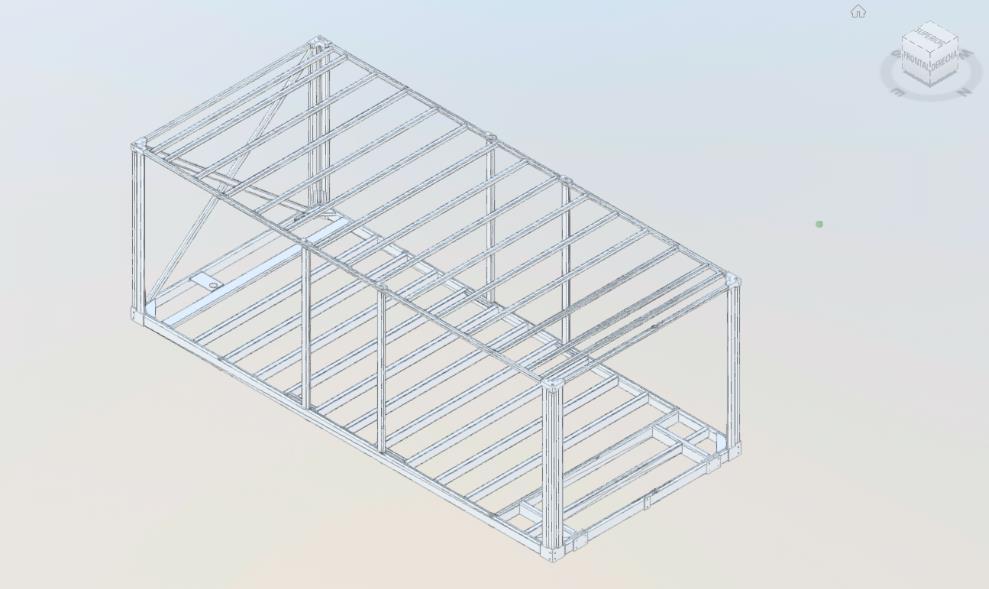
As the scanners only collect data related to the measurement from the sensor and only the surface data of the module chassis, using the exact BIM-generated module may causesomedataoverlapandinterference.This isbecausetheBIMmodelwasintendedto project 2D shop drawings on sections and elevations, which means that their inner geometryispresentfordisplayingthisinformation.Forqualitycontrolpurposesregarding deviation in outside geometries, these inner geometries are not necessary and are discarded, leaving themodel as a hollowed structured model. In the analyzed chassis, the columns and beams are made of HSS, and the model has been modified to not have their innerradius.
Thisnewmodelwillbethereferencedatatocompare withthedatafromthescan, tosetparametersanddisplaydiscrepanciesingeometry.Asexplainedbefore,thescanner onlycollects X, Yand Zpoint coordinates, andmanyof thepointsneed tobediscarded in order to create the clearest scanned version of the module. The data is then merged and providestheirbestaveragedatafromallthescans, whichusuallyisfourorfivescans per chassis.
After this stage, the point data needs to be associated with the modified reference 3D Model. This association takes the distance from the reference model and represents it as negative or positive taking the 3D model as the original surface plane. The distance of these points is the normal vectors produced with this surface place. Whenever the value is positive, it means that the data is outside of the model reference, and when the normal vectorisnegative,itrepresents thedatainsidethemodel.
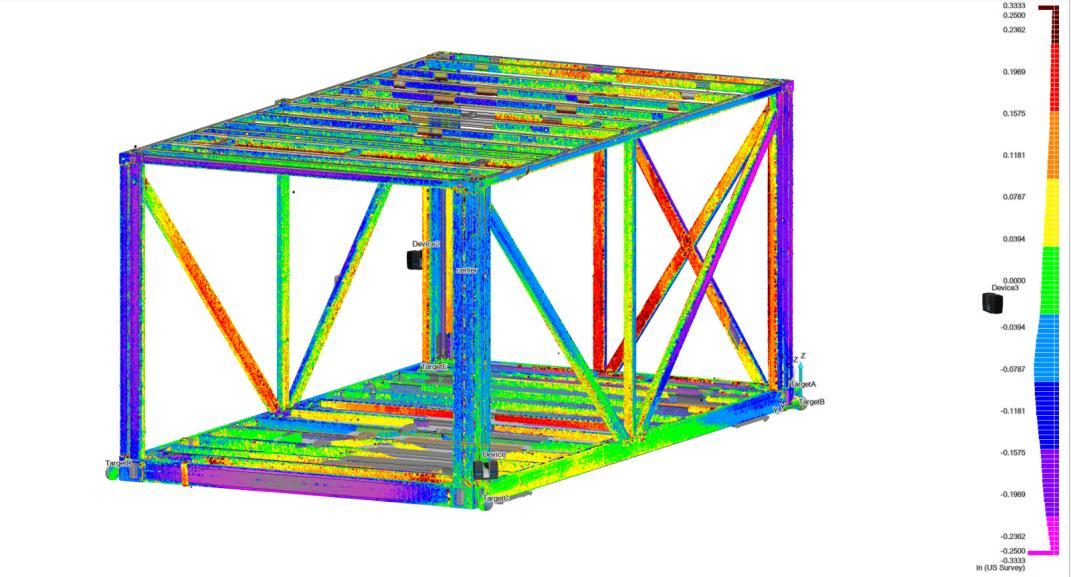
4. Deviation Results
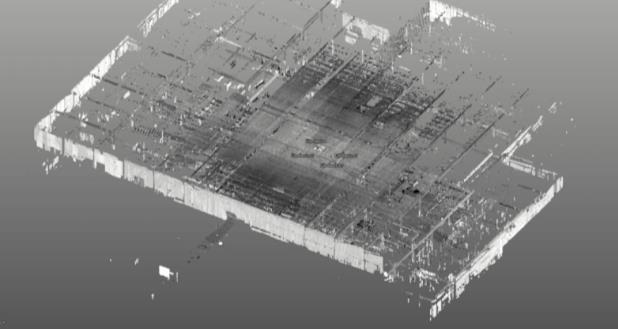
Finally, FARO BuidIT software records the scanning data and projects the results using a colour scheme that is labelled by the dimensional variation. The data range is set from 0.5000 inches, represented as intense red, to negative 0.5000 inches displayed as light purple. From the selected module, we can easily visualize the variability of several members that present some deviation
Figure 12 Point Cloud Data collected from the scanner (Left). Cropping data result in relation to the module (Right)
Figure 13. Normal Vector Representation of the color scheme data correlation the surface planes of the chassis
problems. In Figure 14, the most important members in context of manufacturing are the lateral deviations found in the back columns. These present an outwards deviation of around 0.2000 inches and can be fixed at the shop by compressing the columns inwards usingapullingmechanism.
Inwards deviations do not present higher risk than deviations that are outside the chassis. This is because the alignment between the modules introduces more risk when their shared columns form a concave line between each other, and present gaps at the lowerandupperends.Inwardsdeviationsaretobetroubleshotwhentheybecomelargely excessive and may require in some rework and more intense pushing mechanisms to correctthemthantheprocessofcompressingtheminwards
Figure 14 Resulted Isometric view of from the cloud data association with BuildIT software
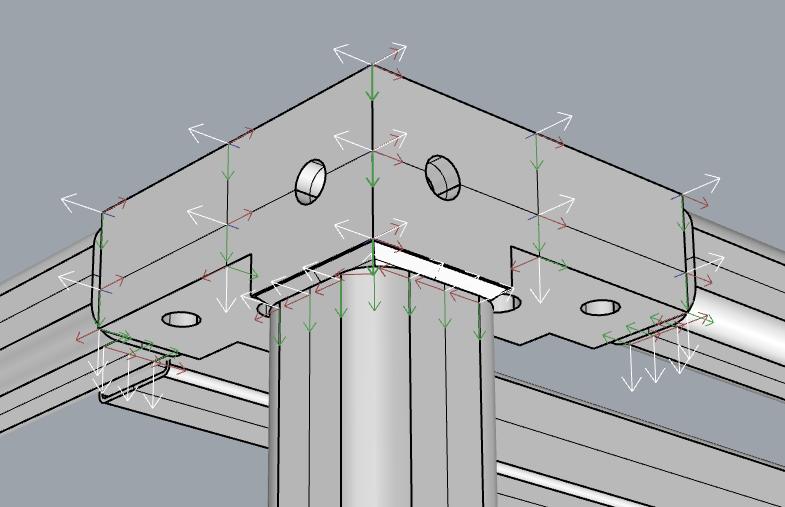
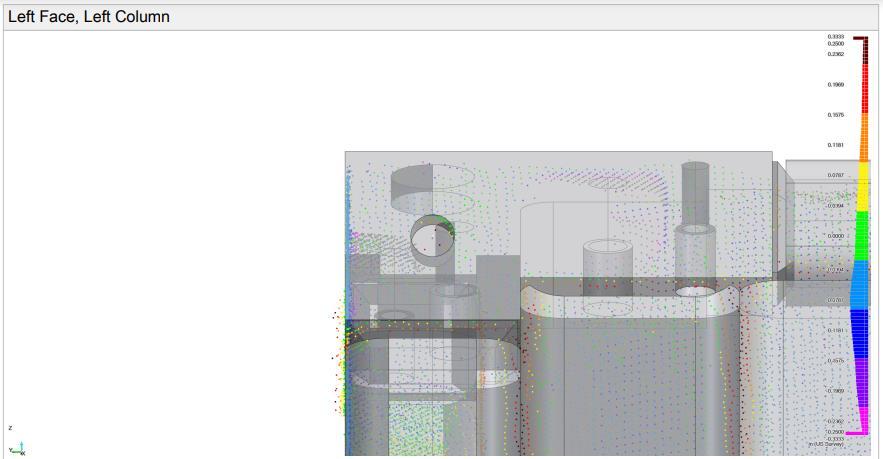
Corner and module joints are also the scope of the analysis as their alignment is fundamental when stacking. The joint connection must intercept accurately when placed on top, below, or beside, and its functionality is what makes modular construction a versatile process, more controlled and better inspected at a shop-level detail view. In Figure 15 for instance, a potential dimension can be identified in the left corner column corner,thatpresentadeviationof0.2500inchesor¼’’.Thisisapotentialmisalignmentin themodulejointconnectionfortheuppermodulethatwillbestackedontop,sothechassis needstobeadjustedtoreducethisdimensionalgap.
Figure 15 Close look to the Left Column upper corner result from the BuildIT generation
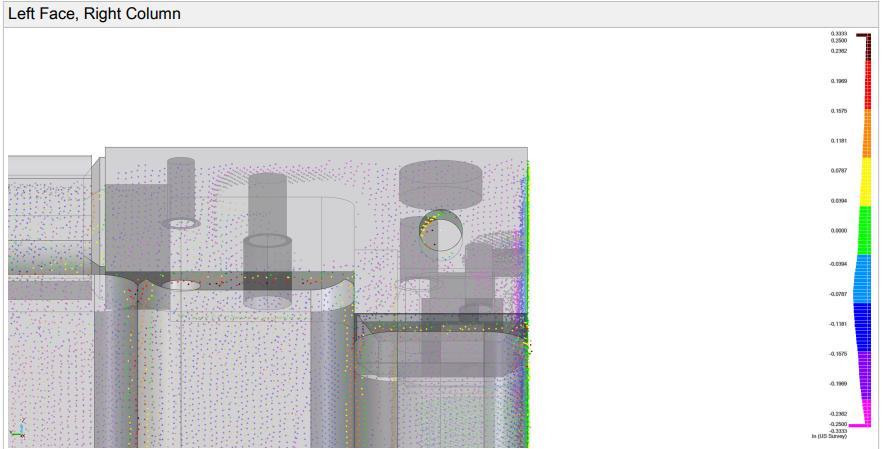
Figure 16 Close look to the Right Column upper corner result from the BuildIT generation
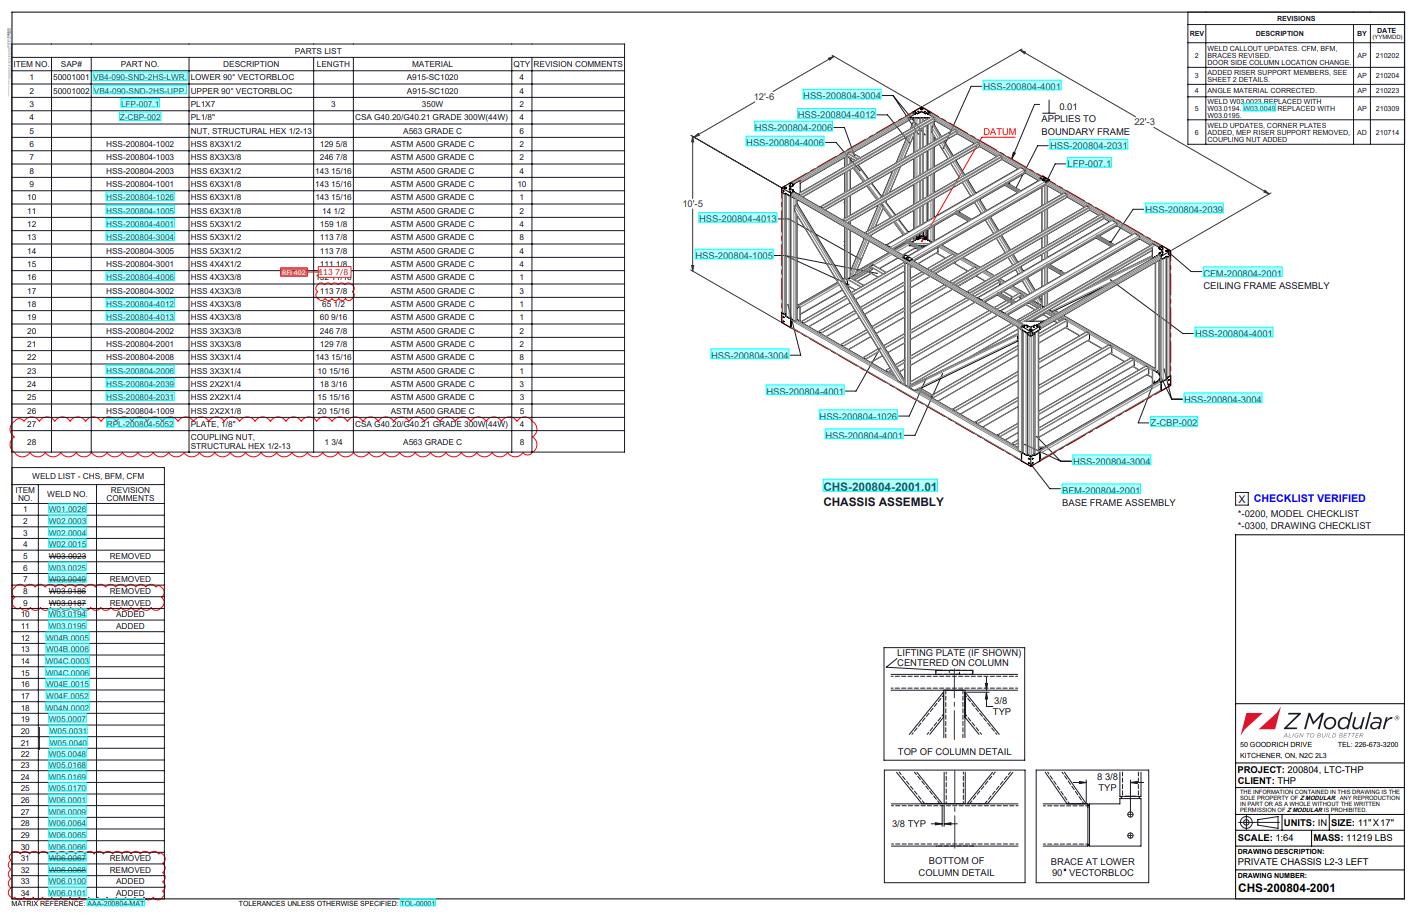
The assembly of the chassis consists of two stages. The first one involves the standardized basis chassis which is welded and constructed by automated robotic jigs At theendofthisstageafirstscanisrequiredtotroubleshootanydeviationproblemwiththe manufactured module using the explained approach and steps. After this check, the additionalandcustomcolumnsandbeamsthatcannottobeautomatedbytheroboticarms are welded by the staff. After the end of this final stage, a second scan takes place to address any final modification and chassis quality after direct human intervention. Later, thenextassemblycantakeplacesuchtheMEPrough-in,wallsorcementboards
5. Conclusions
As the results show, the dimensional variability can be addressed can predict stacking problems with the erection of modularized projects. Using the BIM and LiDAR integration significantly improves the quality control process and can represent the data accurately and visually identifiable. In order to increase the efficiency of quality control methods, the space for optimization is critical especially in a world with growing technologies. This integration can also be presented as part of any tolerance management methodology that carefully plans the action flow needed and responses according to the shop quality inspections. It is also recommended that the manual placements of sensors for the scan sessions be automated inside the same engineering coordination intervention as a new stage. This means that a proposed methodology can be implemented where robotics jibs, can be fixed sensors that represent a new standard module stage inside the shop. This will not only facilitate the overall scan process, but also save overall production costs in labour and potential human error risks.
References
AISC. (2016). Code of standard practice for steel buildings and bridges. Chicago.
BSEN1090-2-2011. (2011). Execution of Steel Structurs and Aluminum Structures. British Standard. Retrieved from https://kupdf.net/download/bs-en-1090-22011_58bac63fe12e89e931add374_pdf
Enshassi, M. S., Walbridge, S., J. S., & Haas, C. T. (2019). Integrated Risk Management Framework for. Journal of Management in Engineering. doi:10.1061/(ASCE)CO.19437862.0001747
Hasan, A. M., Torky, A. A., & F.Rashed, Y. (2019). Geometrically accurate structural analysis models in BIM-centered software. Automation in Construction.
Johnsson, H., & Meiling, J. H. (2009). Defects in offsite construction: timer module prefabrication. Construction Managment and Economics.
Lawson, M. O. (2014). Design in modular construction. Design in modular construction
Li, H., Zhang, C., & Song, S. (2020). Improving Tolerance Control on Modular. Applied Sciences. doi:10.3390/app10238680
Ng, V. W. (2006). Towards adoption of prefabrication in construction. Building and Environment.
Shahtaheri, Y., Rausch, C., West, J., Haas, C., & Nahangi, M. (2017). Managing risk in modular construction using dimensional and geometrictolerance strategies Automation in Construction
Z Modular, Zekelman Industries. (2021). Z Modular. Retrieved from https://www.zmodular.com/projects/cheatham-street-flats/.