UNIVERSITYOFWATERLOO
Civil&Environmental EngineeringFaculty
DamianChalan
Contents
CIVE422–PostmortemReport–PredictionReport
ME567–FireSpreadModellinginBuildingEnclosures
AE405–BuildingPerformanceReport
AE400–CanopyStudy–Works2022

Civil&Environmental EngineeringFaculty
DamianChalan
Contents
CIVE422–PostmortemReport–PredictionReport
ME567–FireSpreadModellinginBuildingEnclosures
AE405–BuildingPerformanceReport
AE400–CanopyStudy–Works2022
Group Member Names and Student numbers
Name Last Name Number
Damian Chalan 20794892
Javier Fierro 20744566
Yueming Cai 20850432
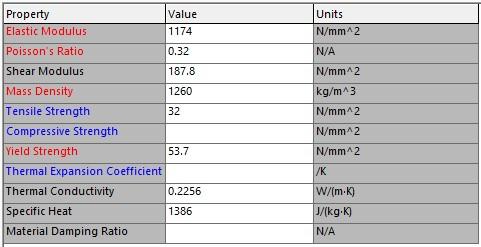
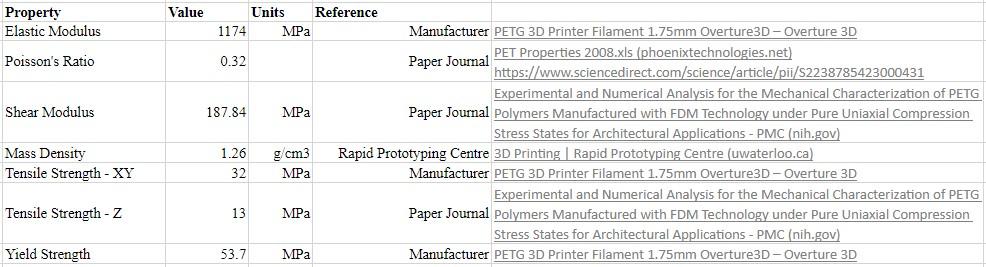
Material Input
Individual Design #2:


Part 2 -
Part 3 -
illustration
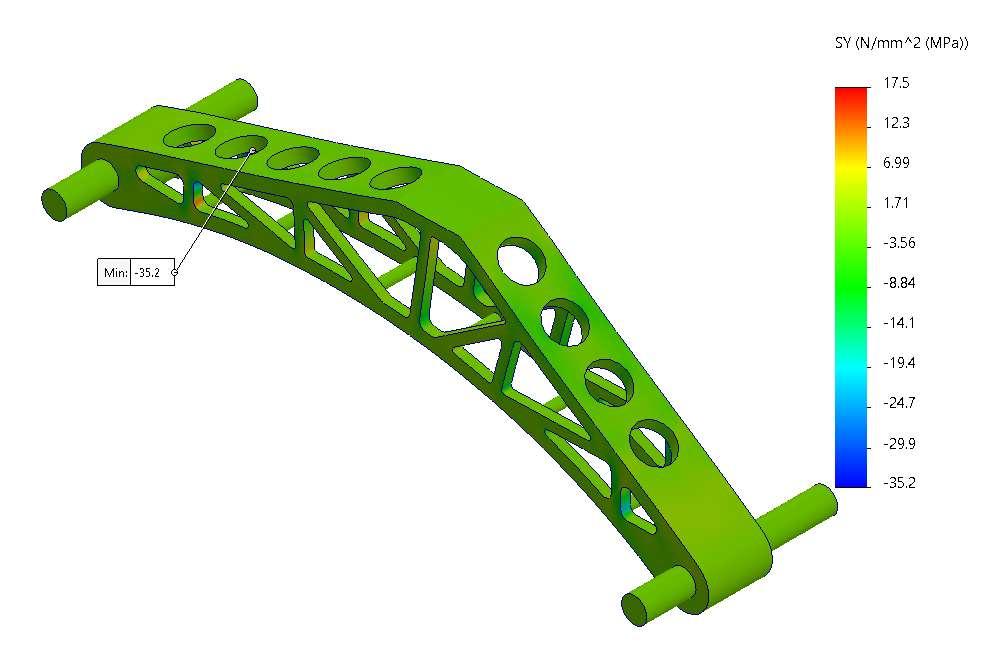
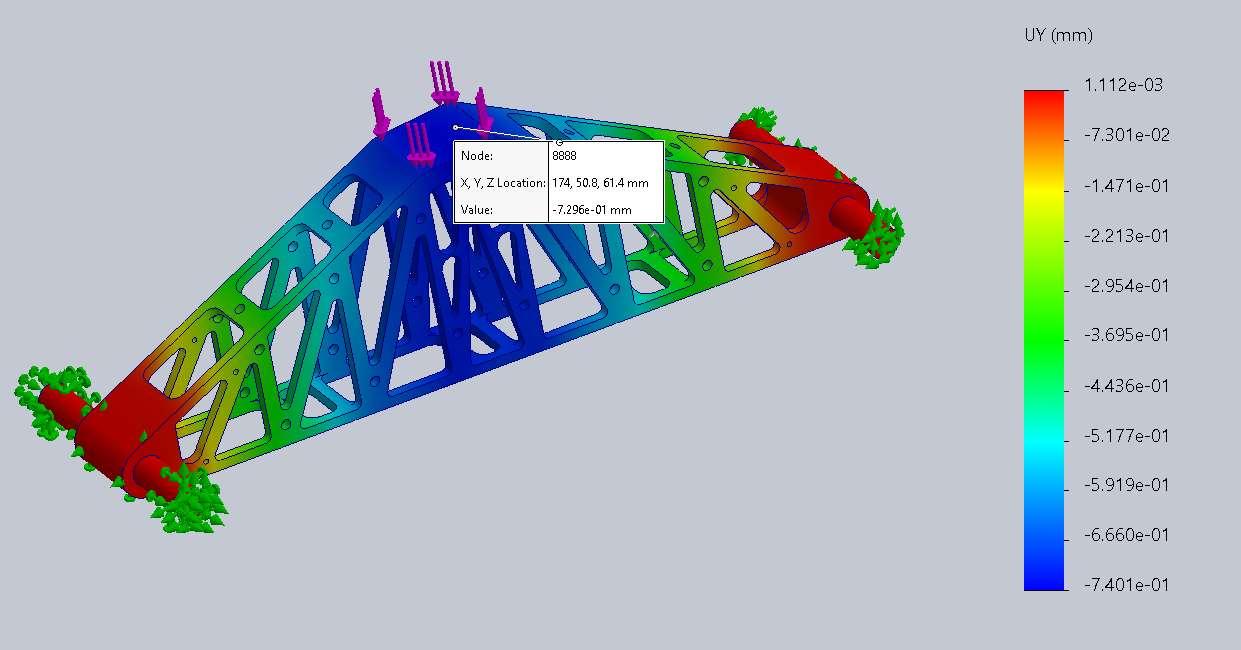
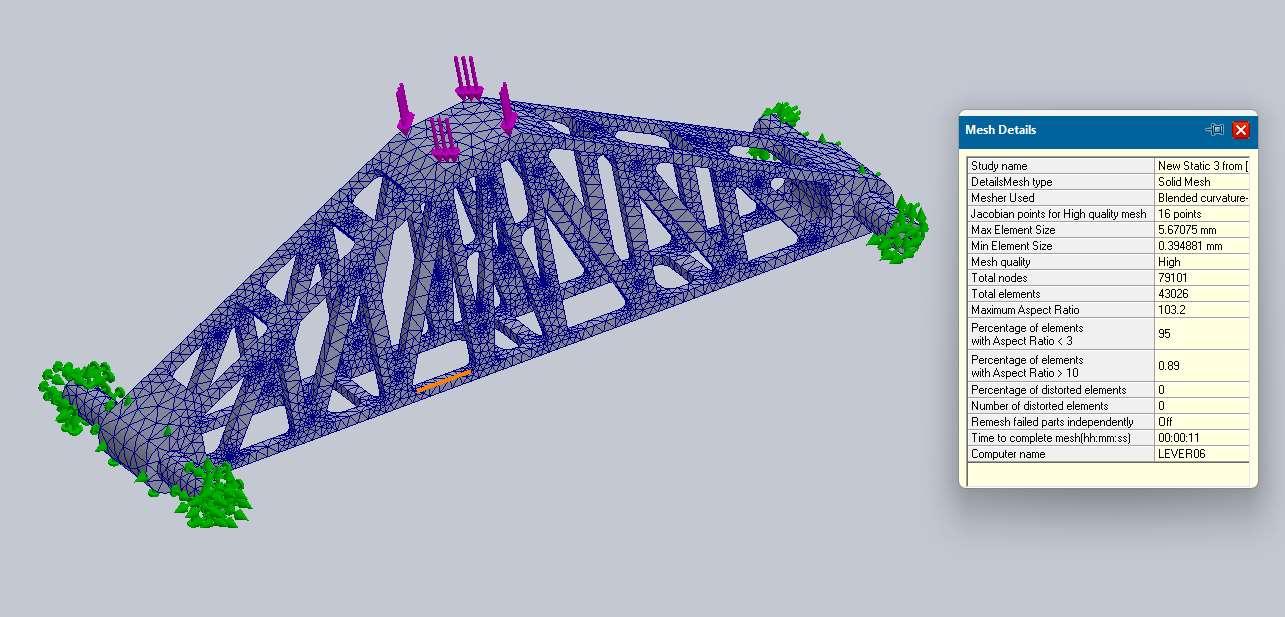
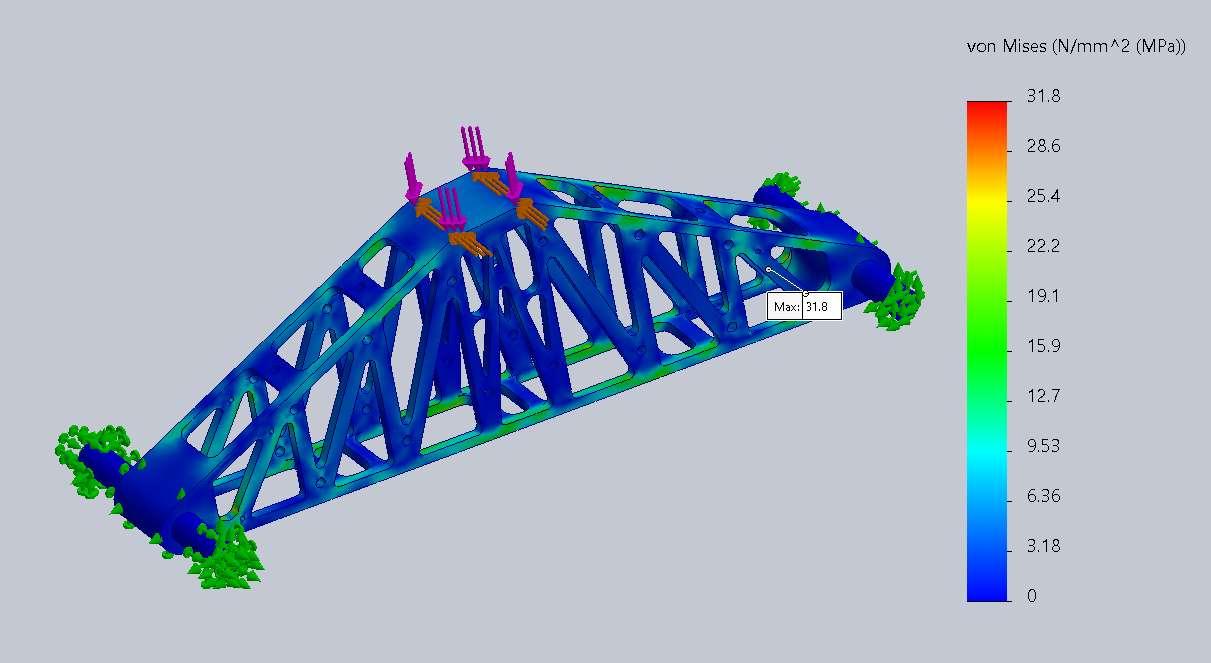
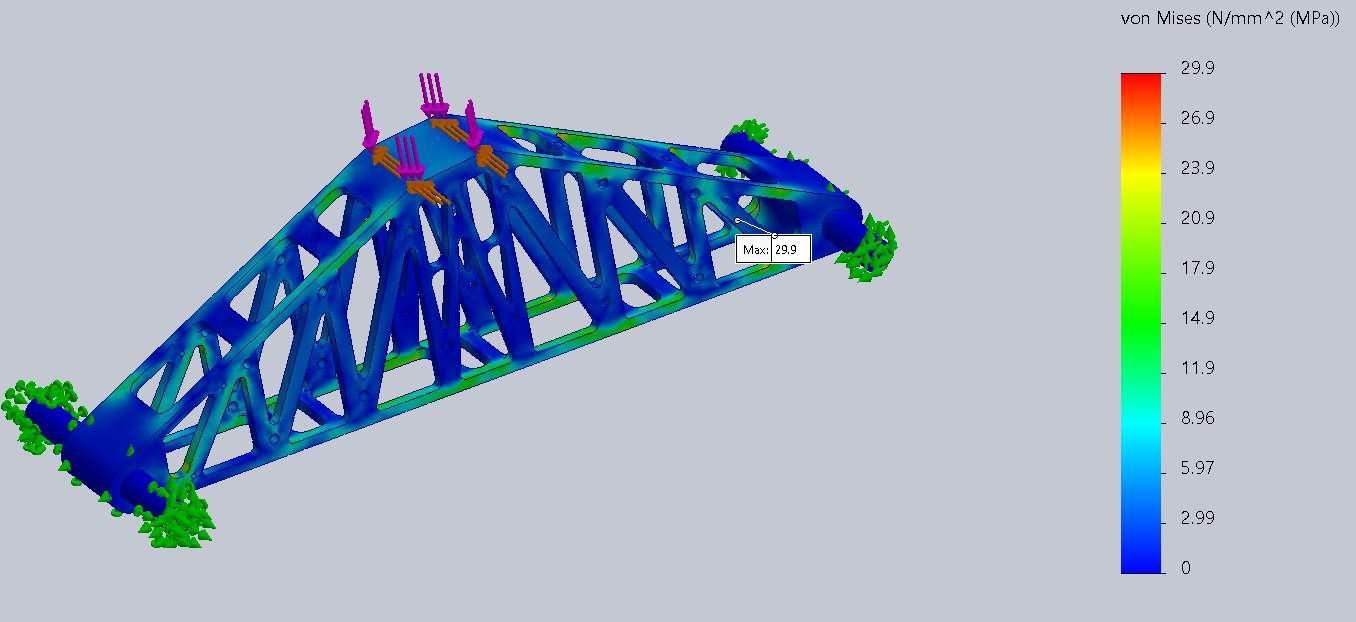
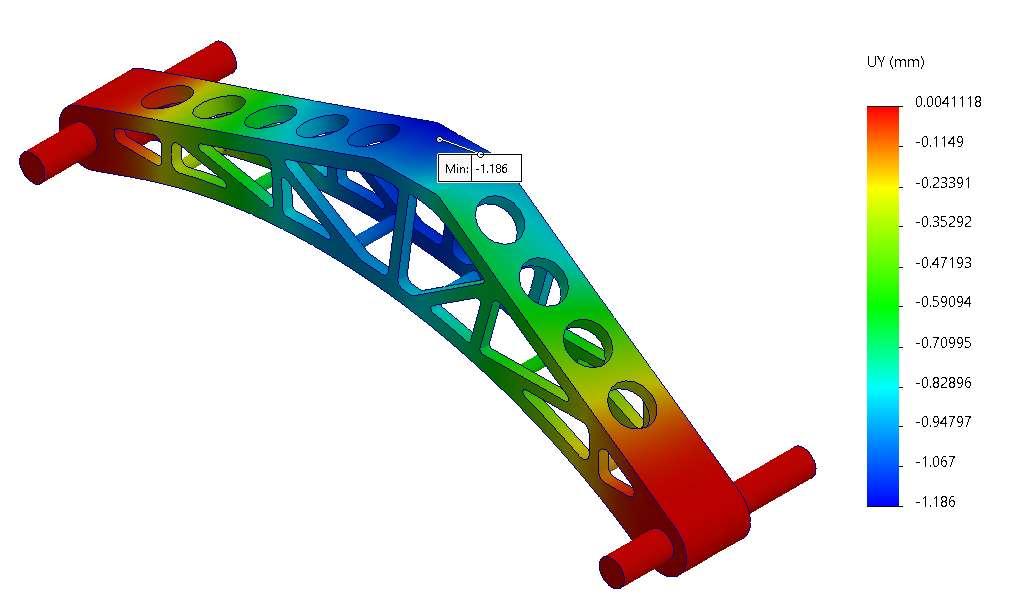
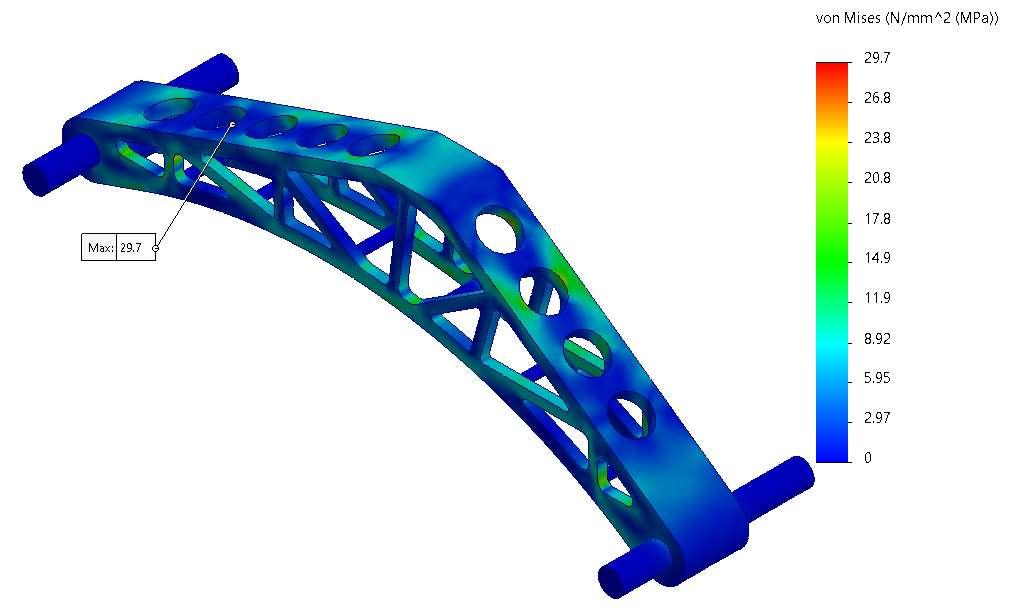
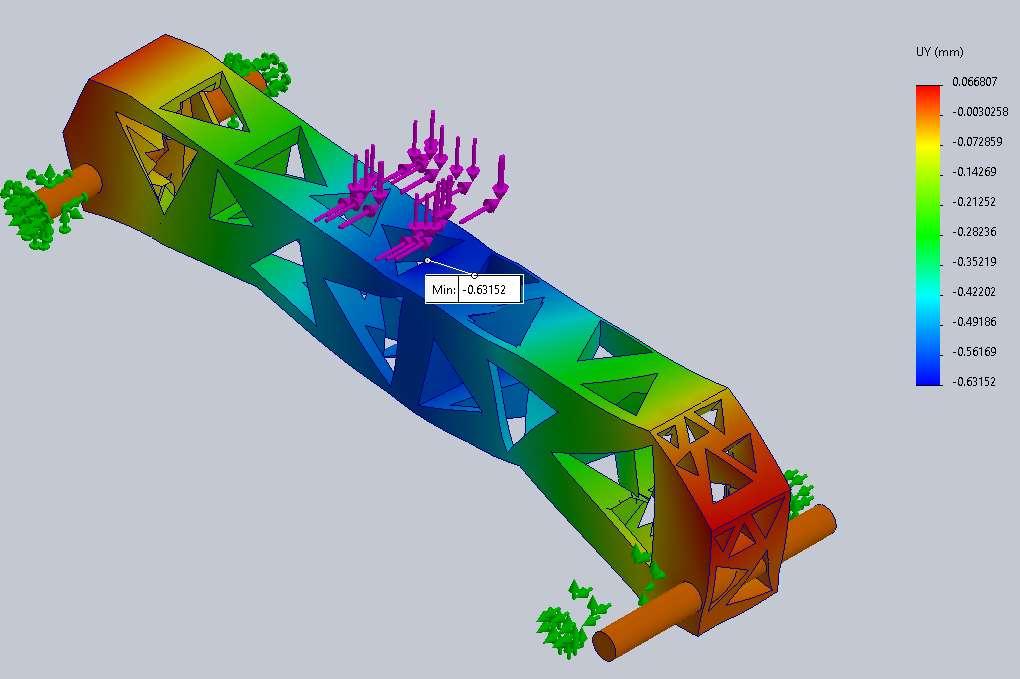
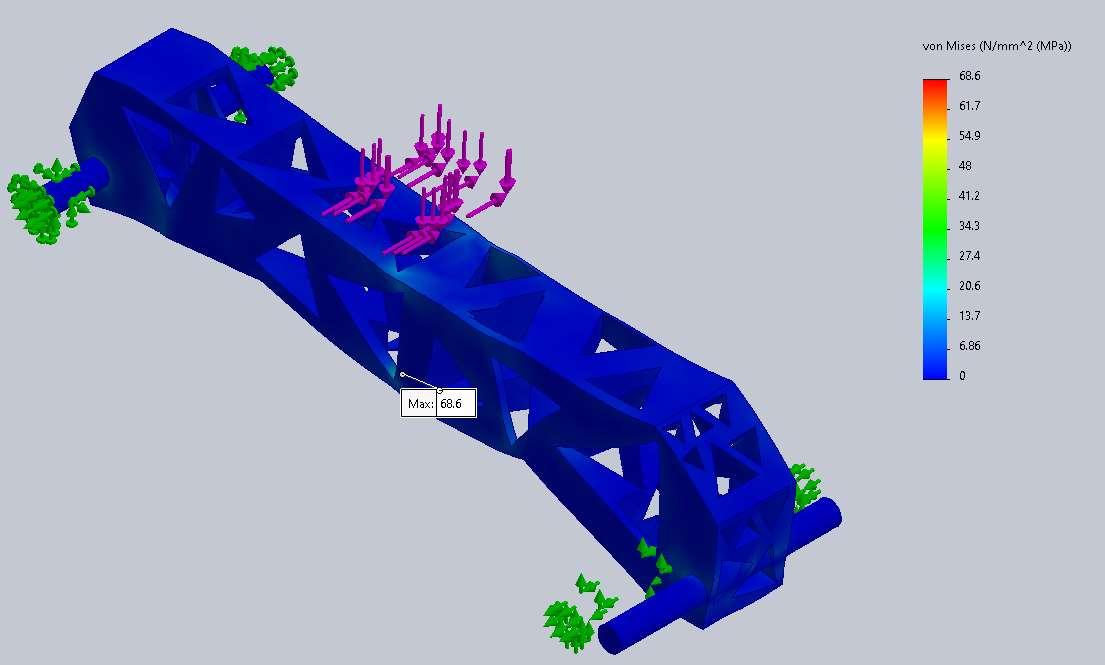
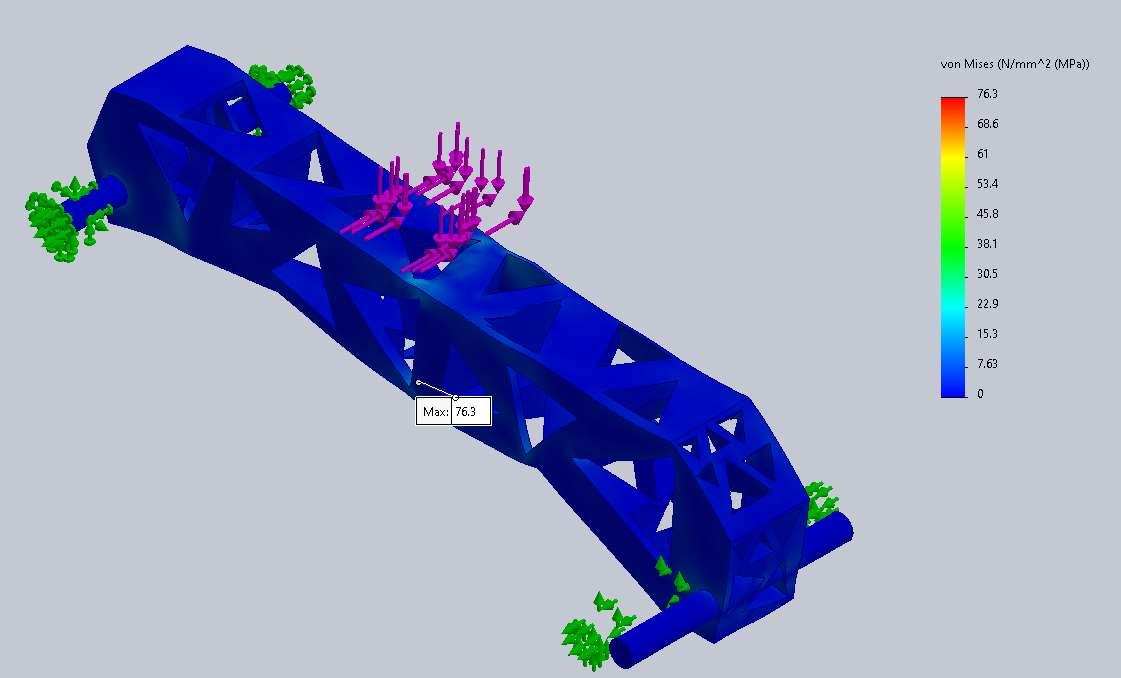
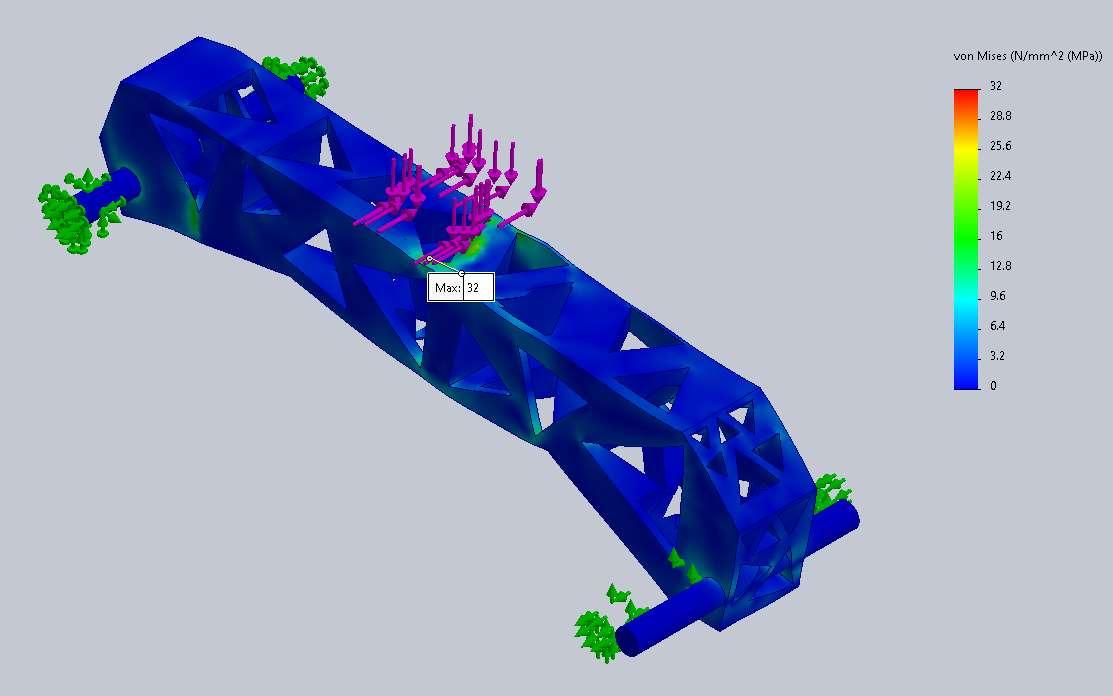
- It is predicted that the structure will fail at the connection between the top member and the vertical chord near the left support. This can be seen in the first graph shown below. The maximum average stress surpases the yield strength value provided by the manufacturer (32 MPa).
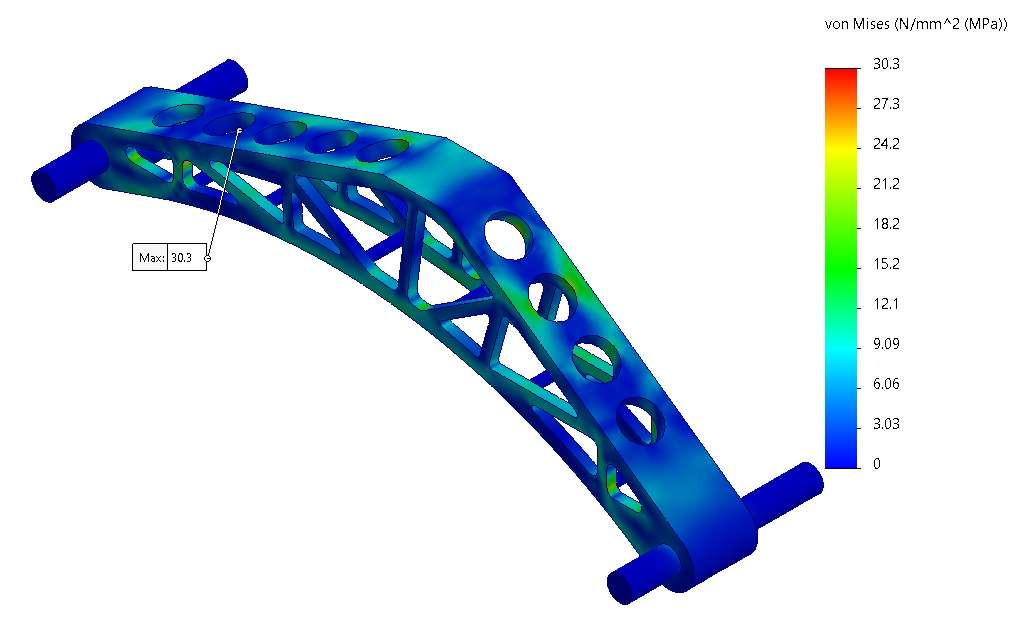
- The stress in the Y-axis shown in the second graph provided depicts that the maximum stress in this axis is located at the same connection.
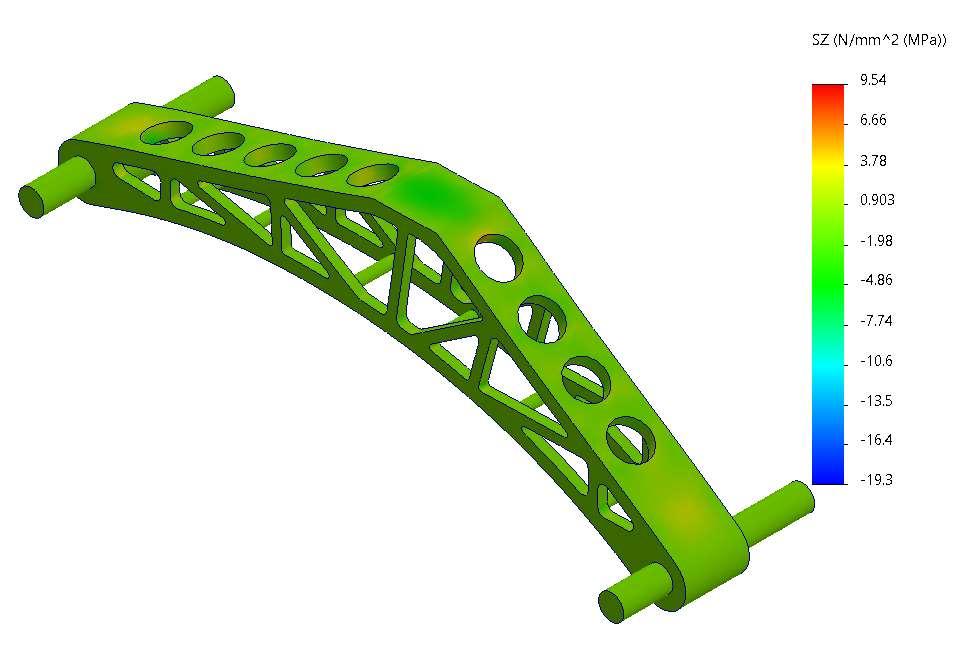
- It was also evaluated the Z-axis stess given that this is the direction perpendicular to the printing plane; thus, its tensile resistance is less which was approximated around 13 MPa. The stress in this direction (+ve value) does not pass the estimated limit.

Part 6 - structure weight (g)
Part 7 - structure weight to failure load ratio (g/kg) Predicted
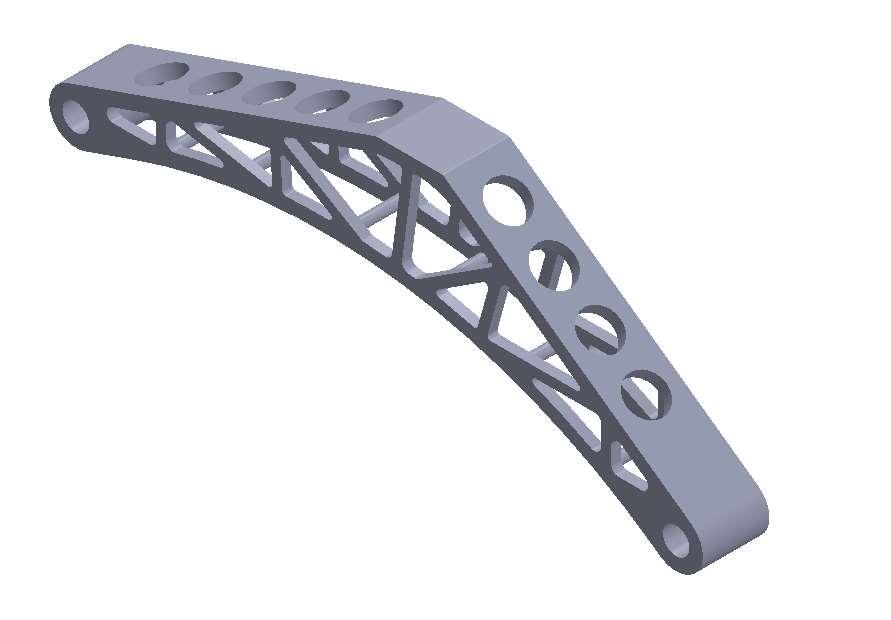
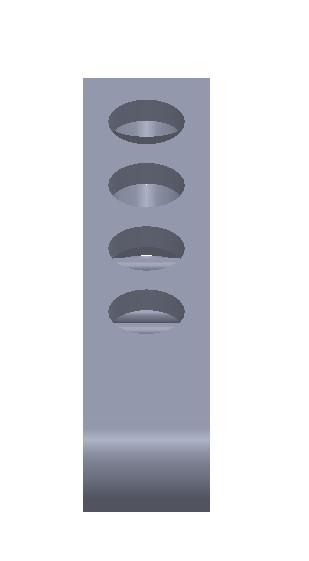
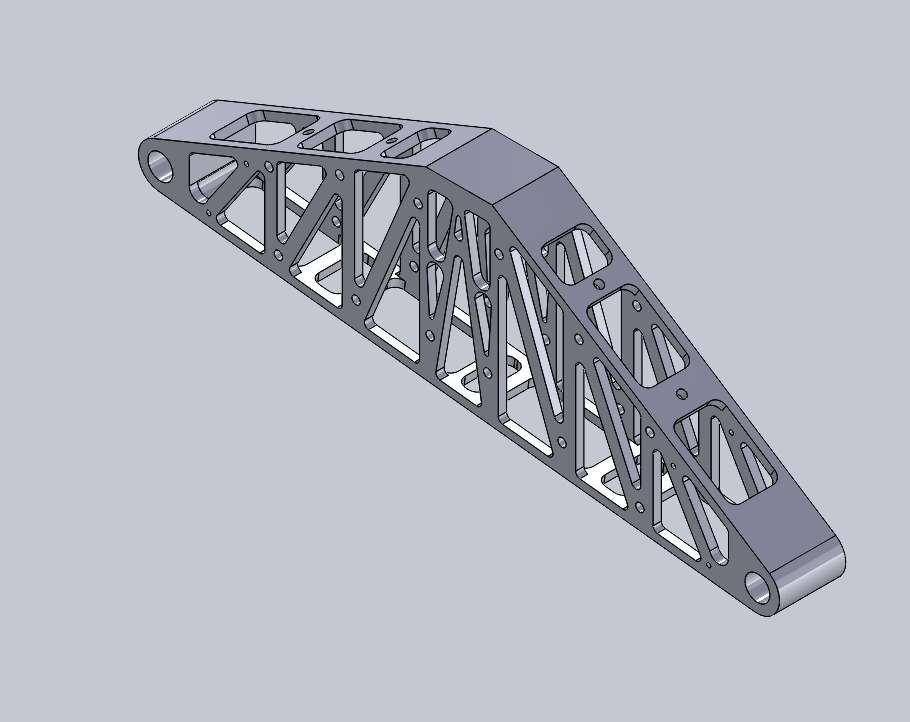
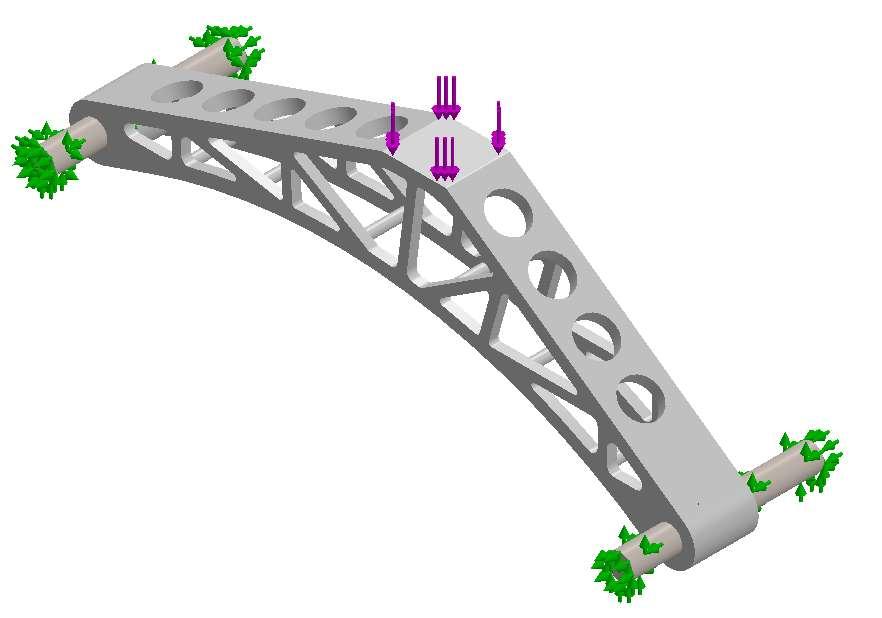
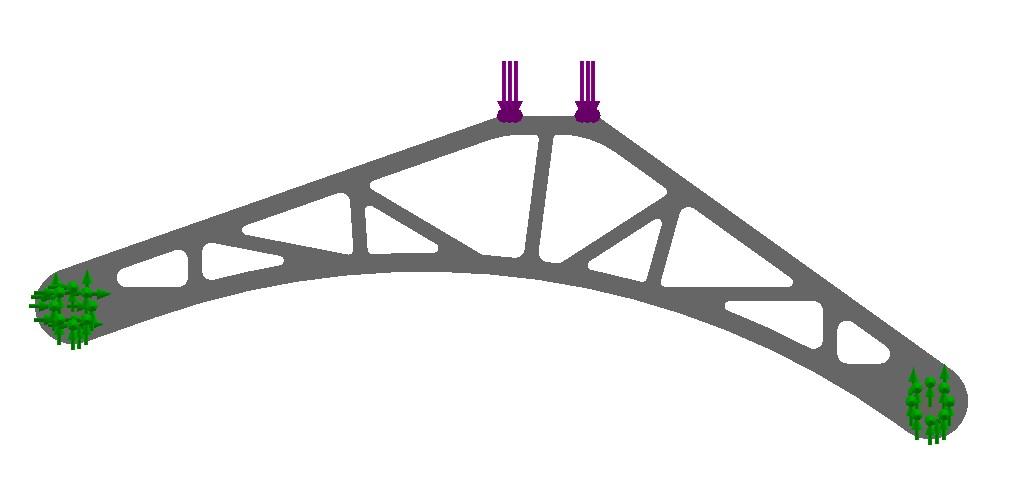
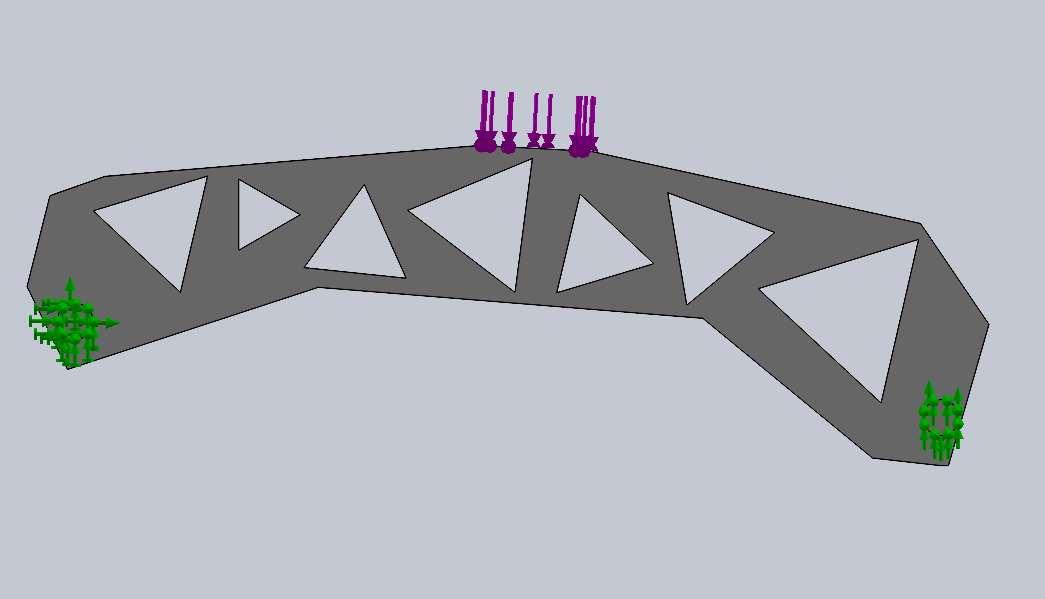
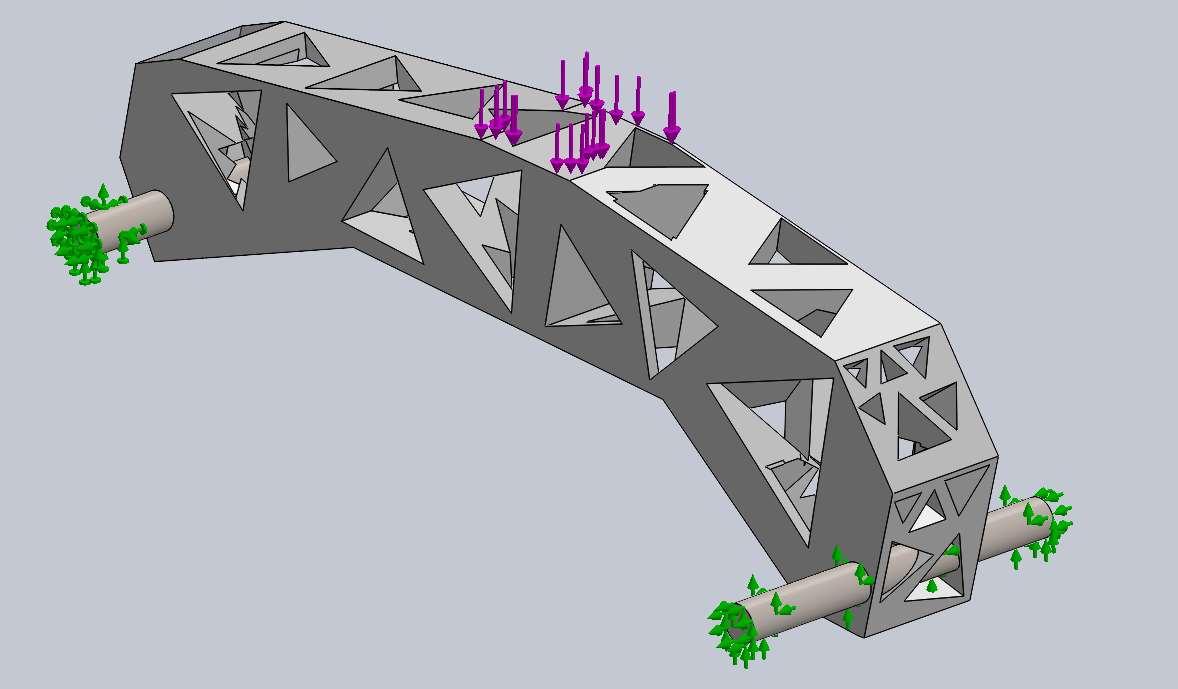
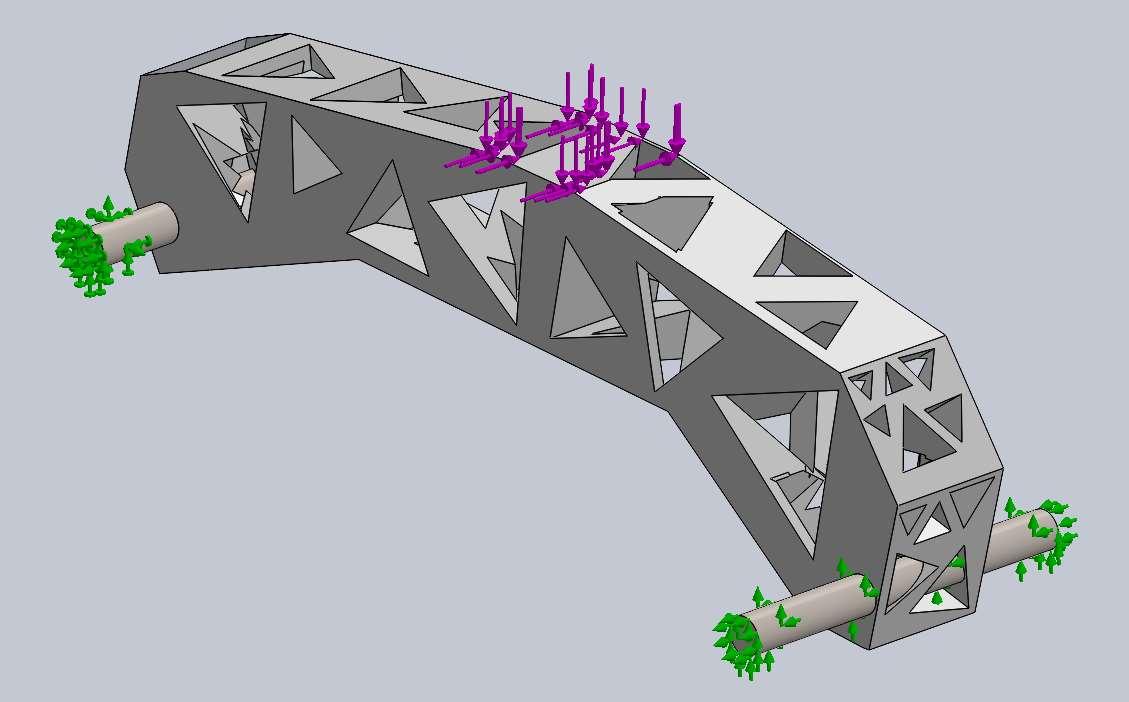
Part 1 - Structure Geometry
Damian Chalan, 20794892 March 30th, 2024

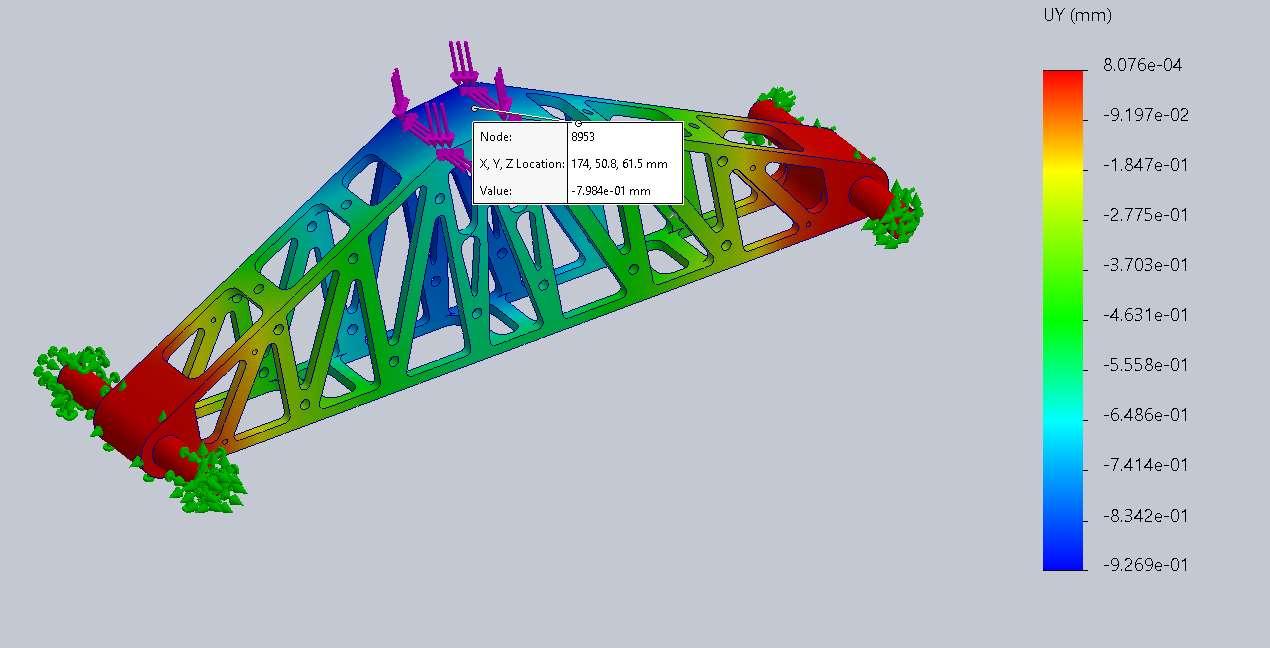
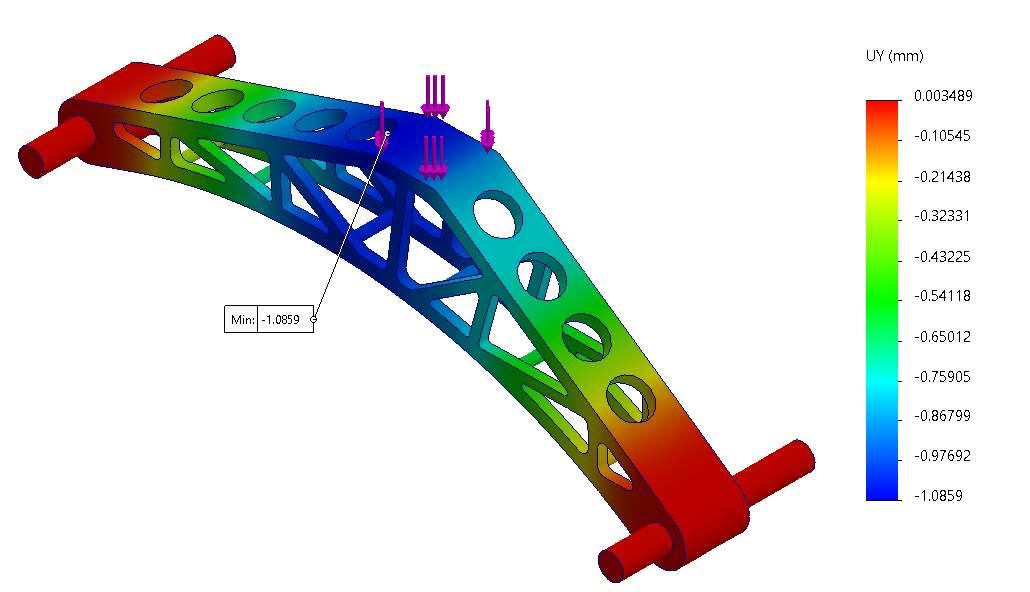
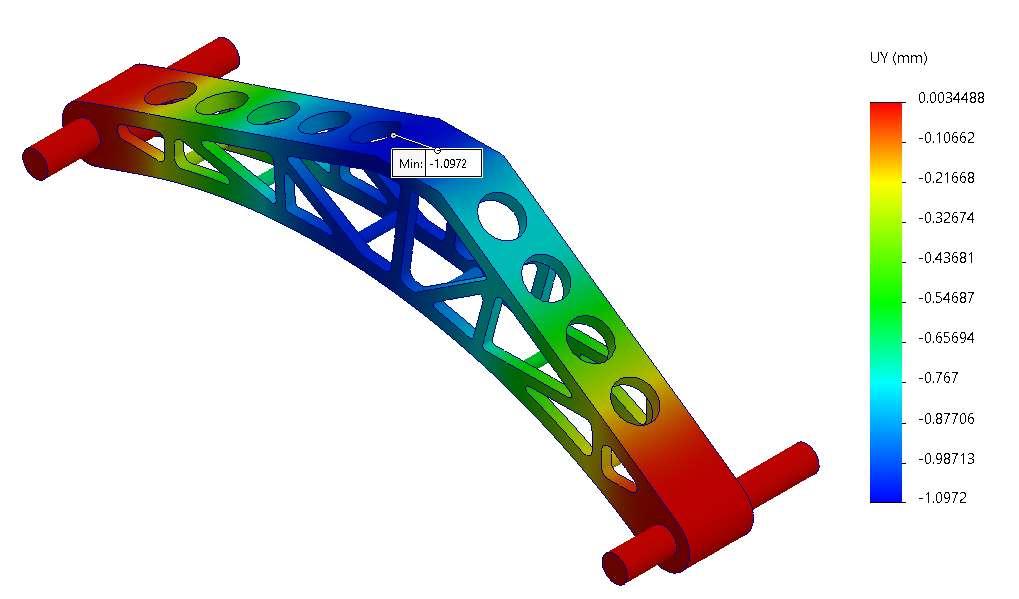
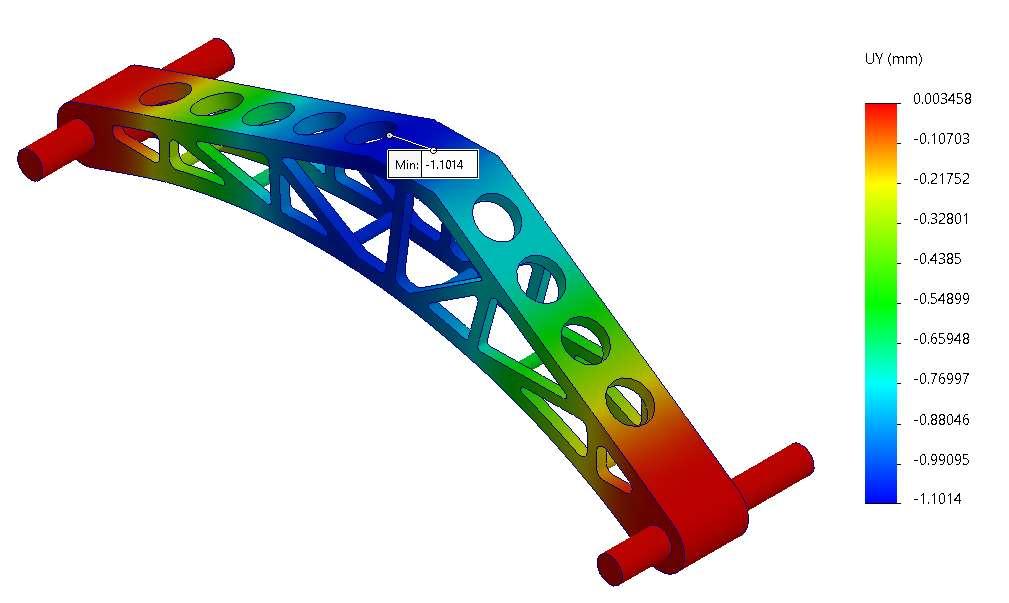
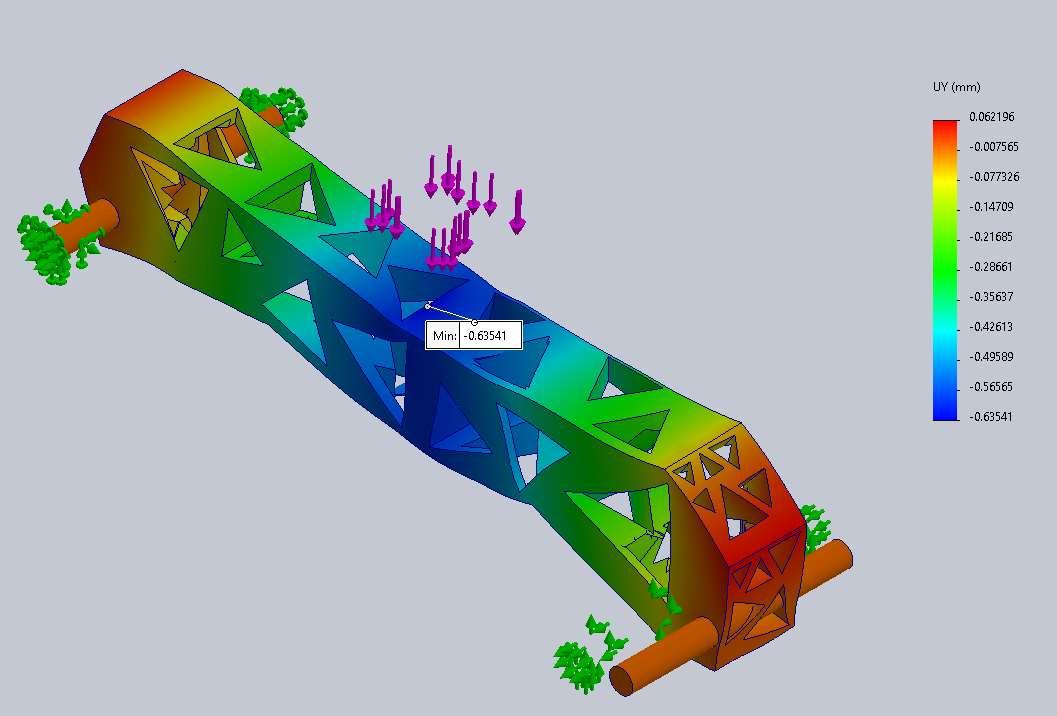
Part 2 - Force-displacement predictions (vertical
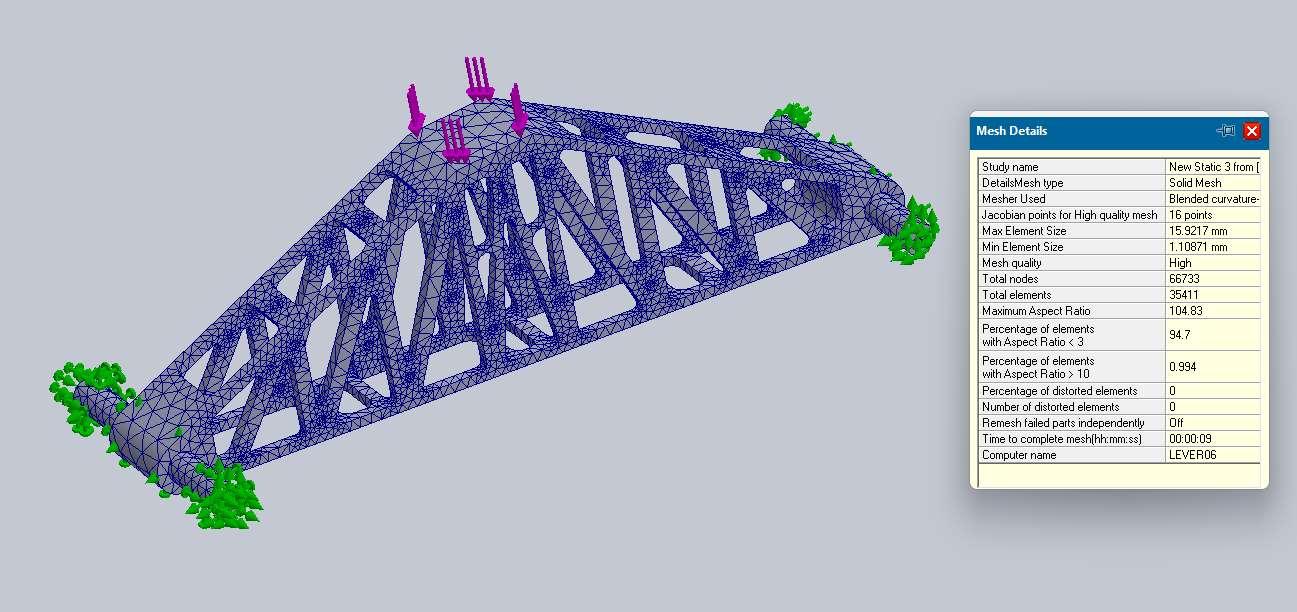
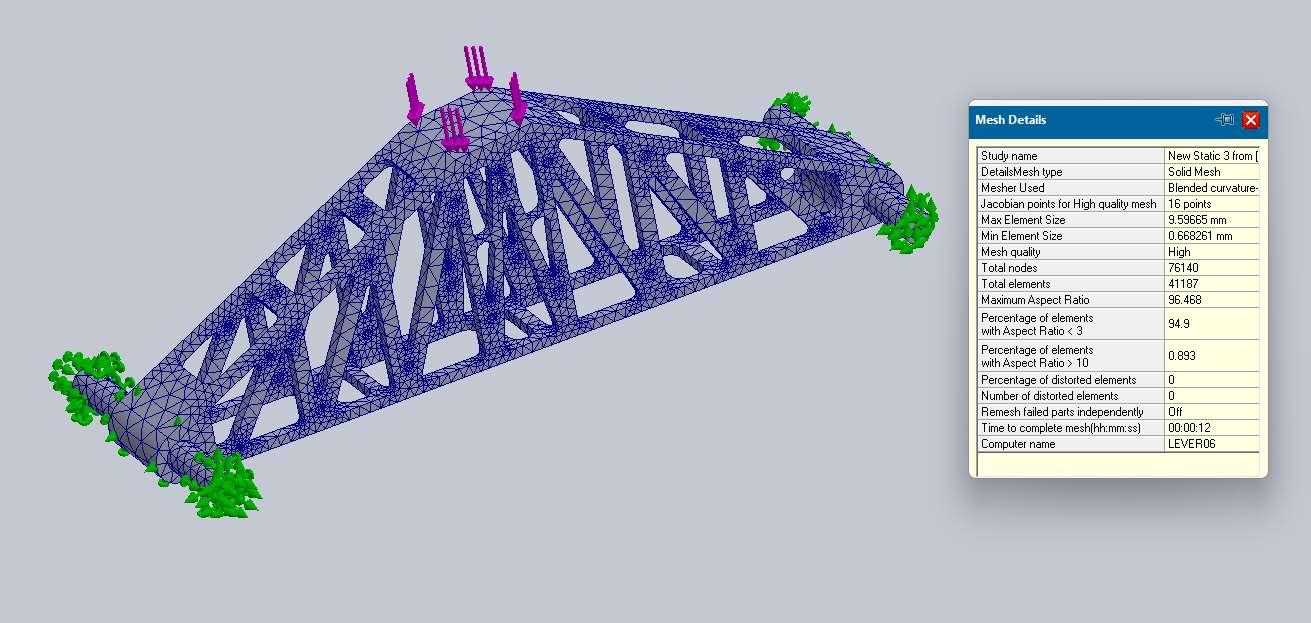
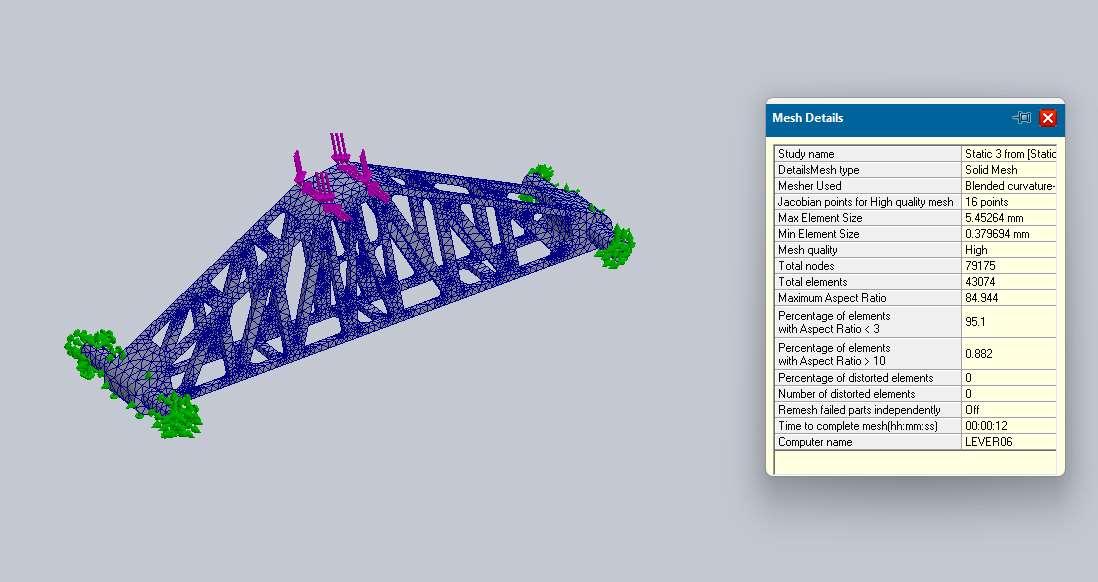
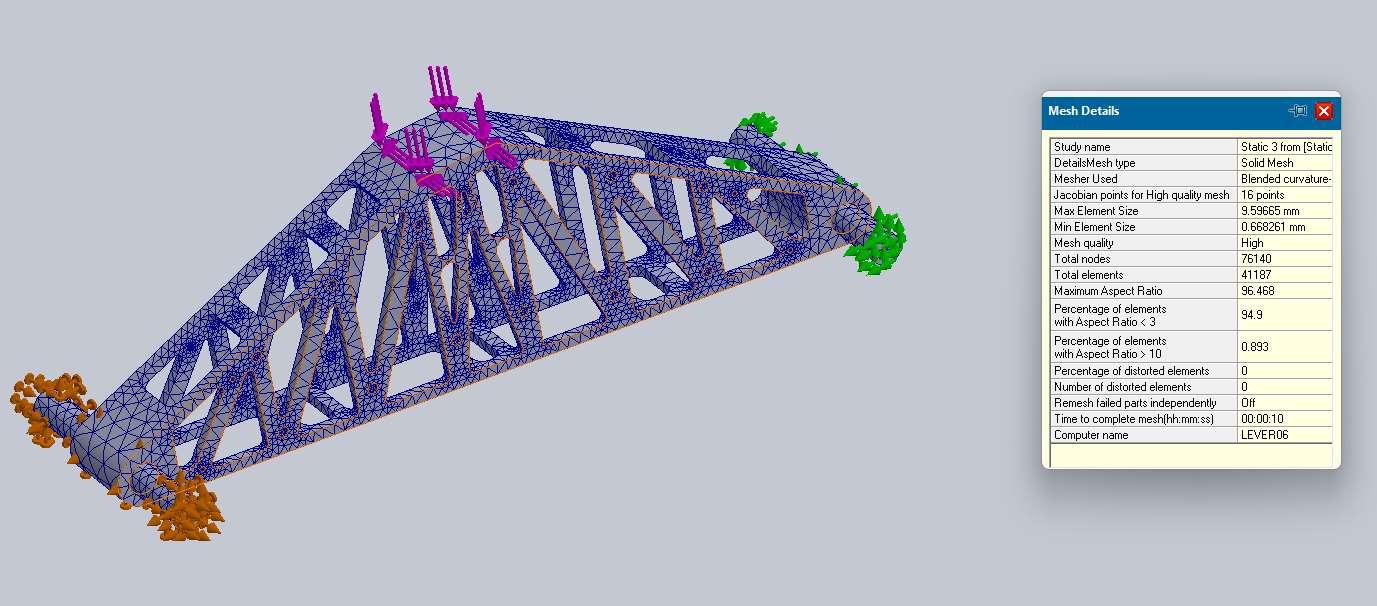
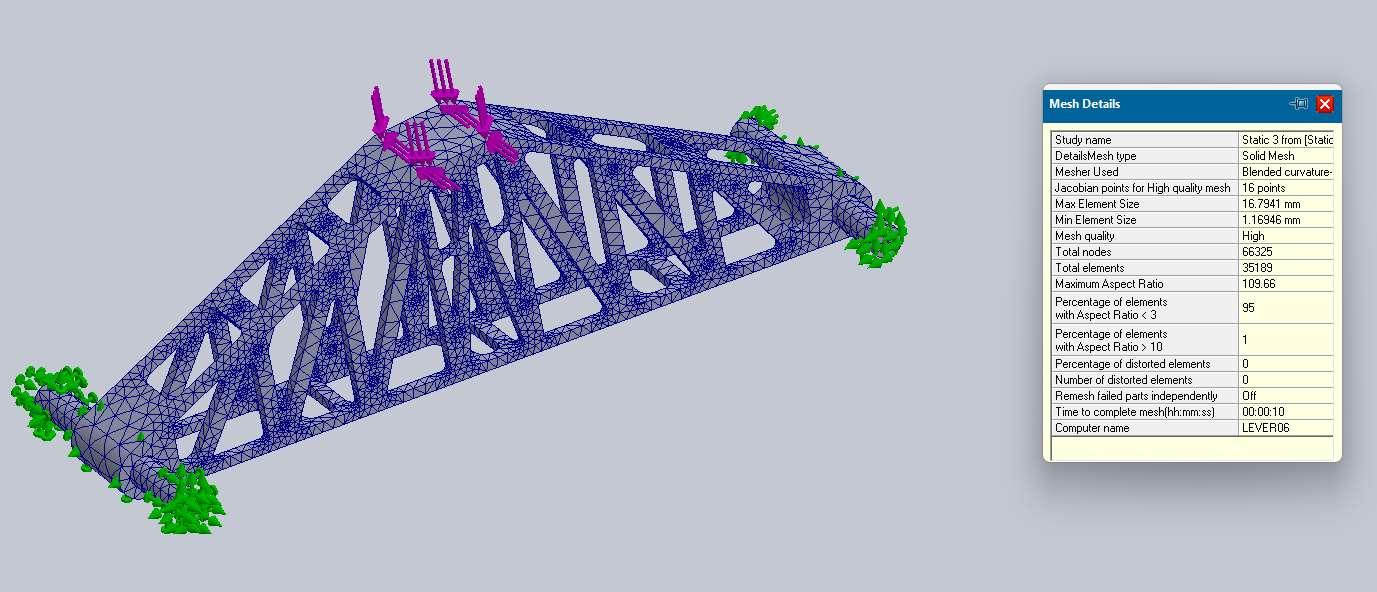
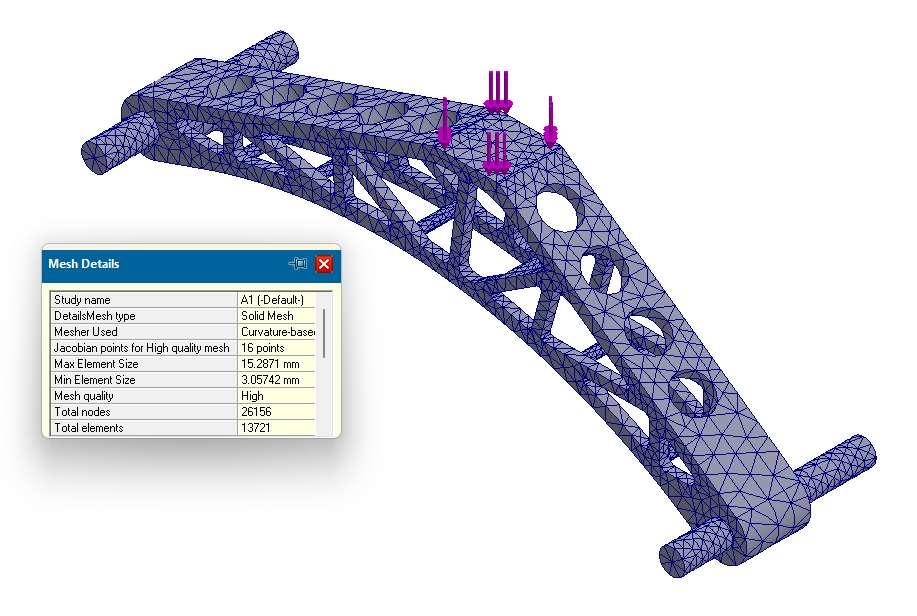
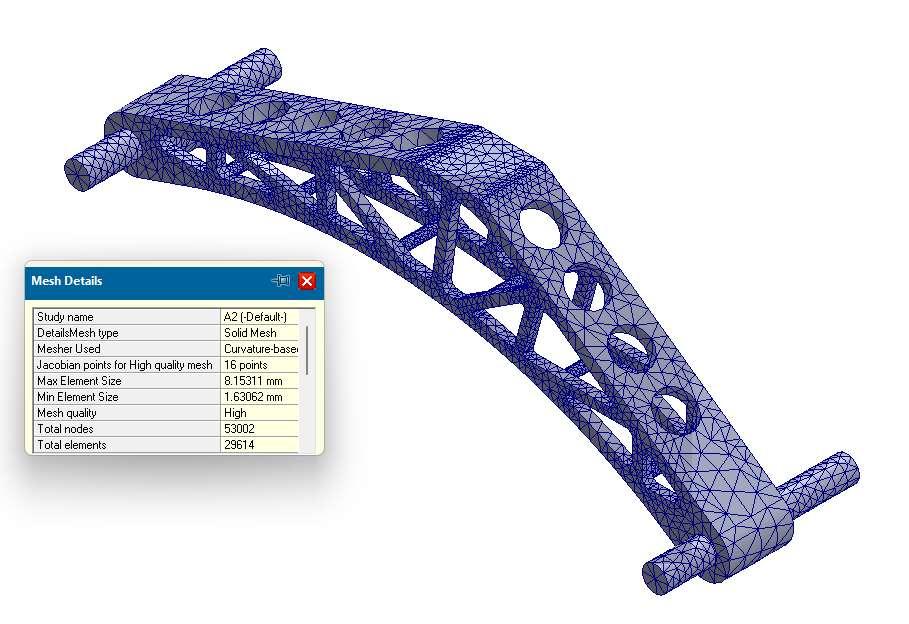
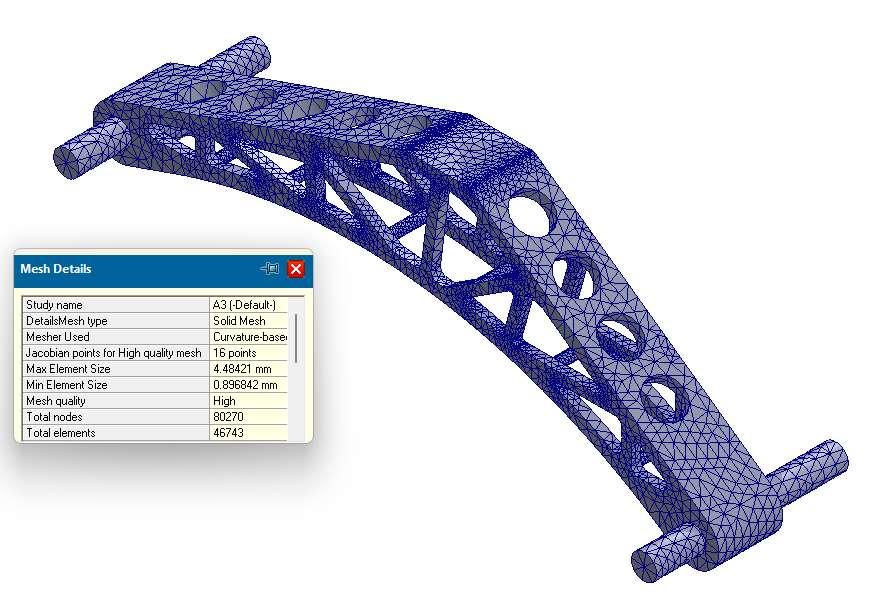
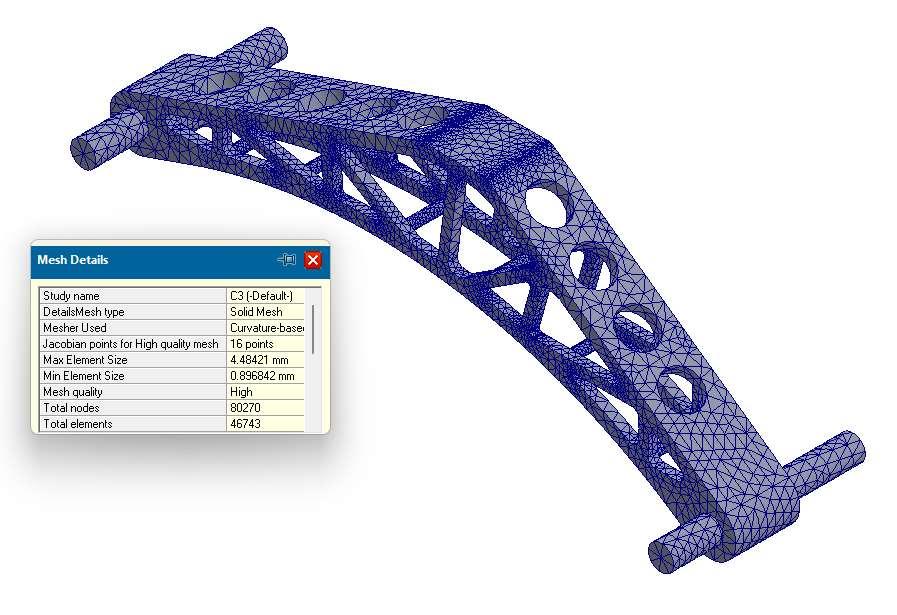
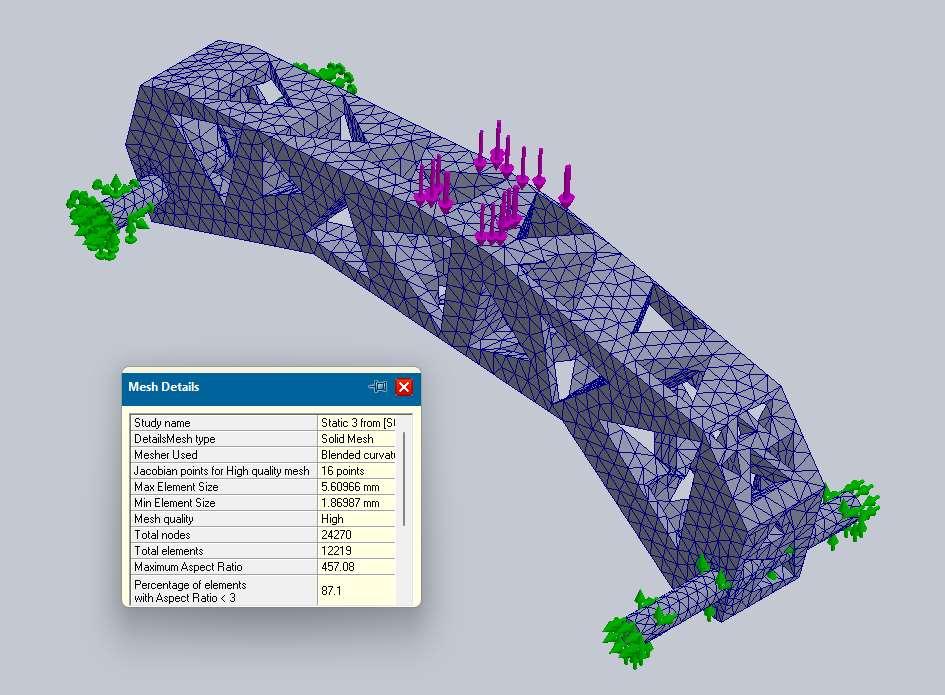
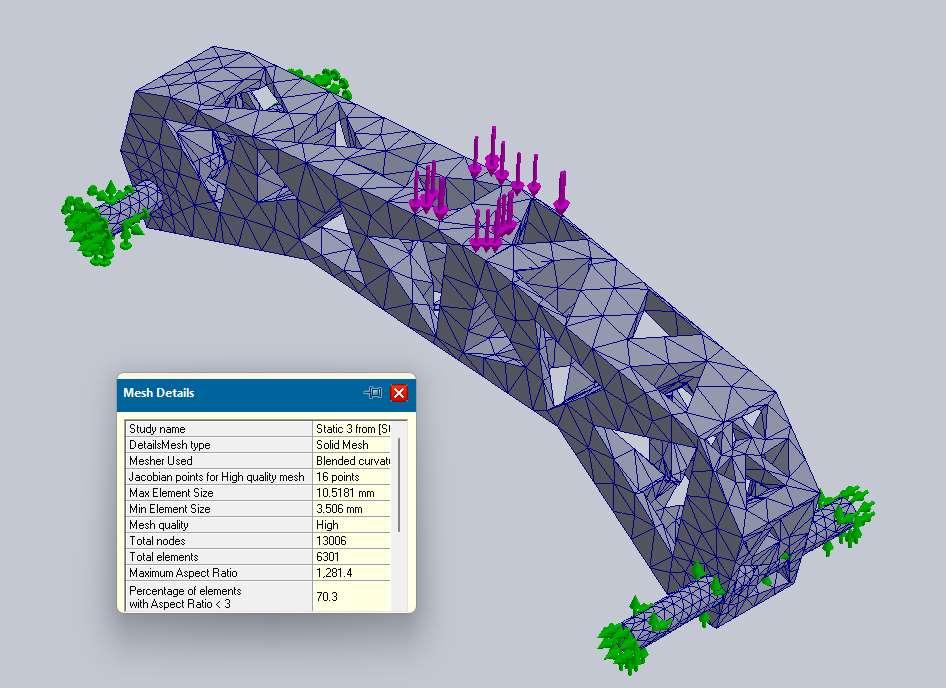
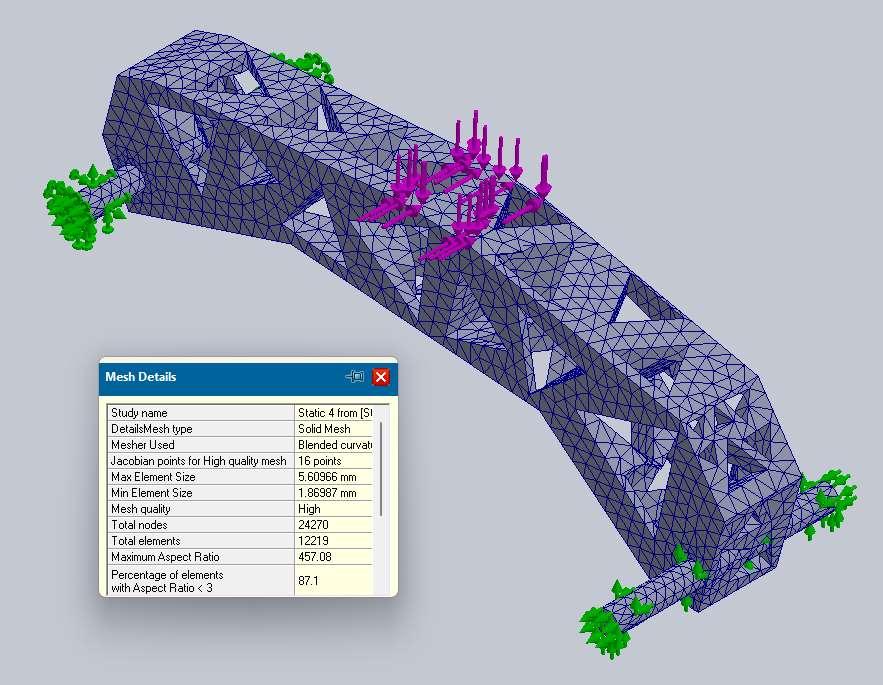
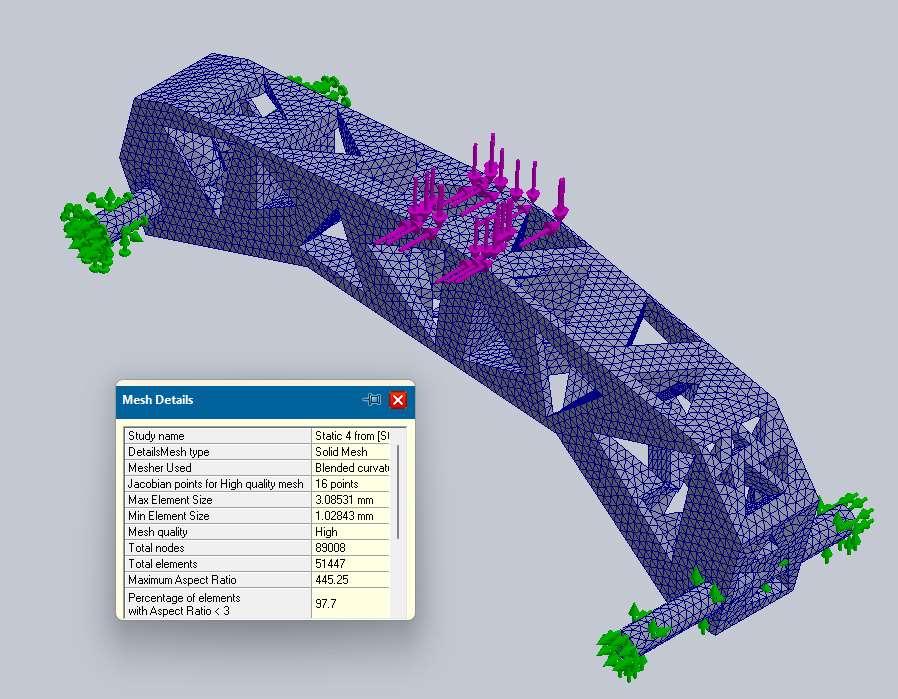
Convergence using 16kg
Part 2 - lateral buckling/stifness (mixed
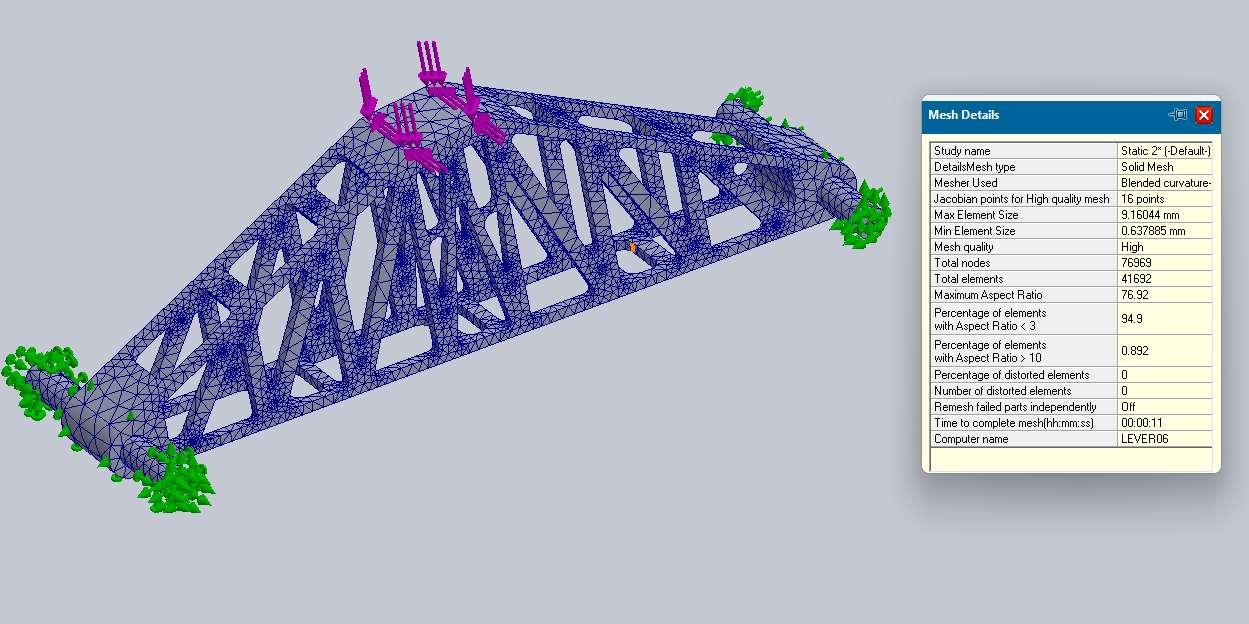
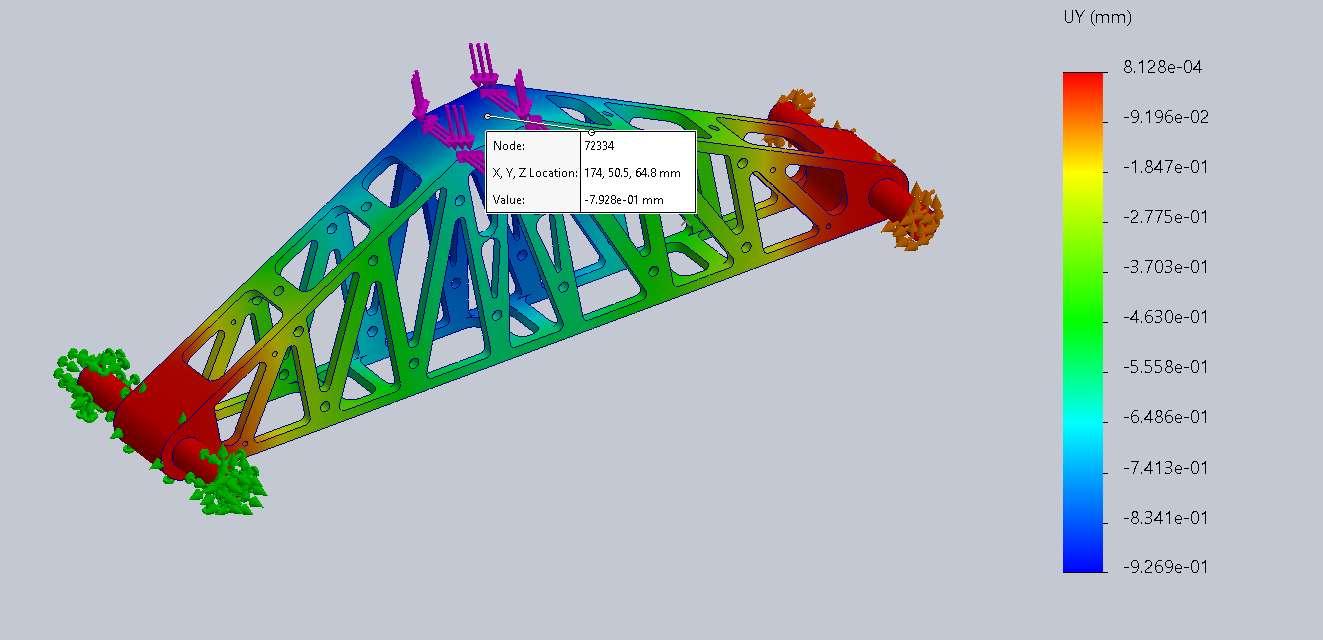
Part 5 - Prediction and illustration of fracture/failure initiation location
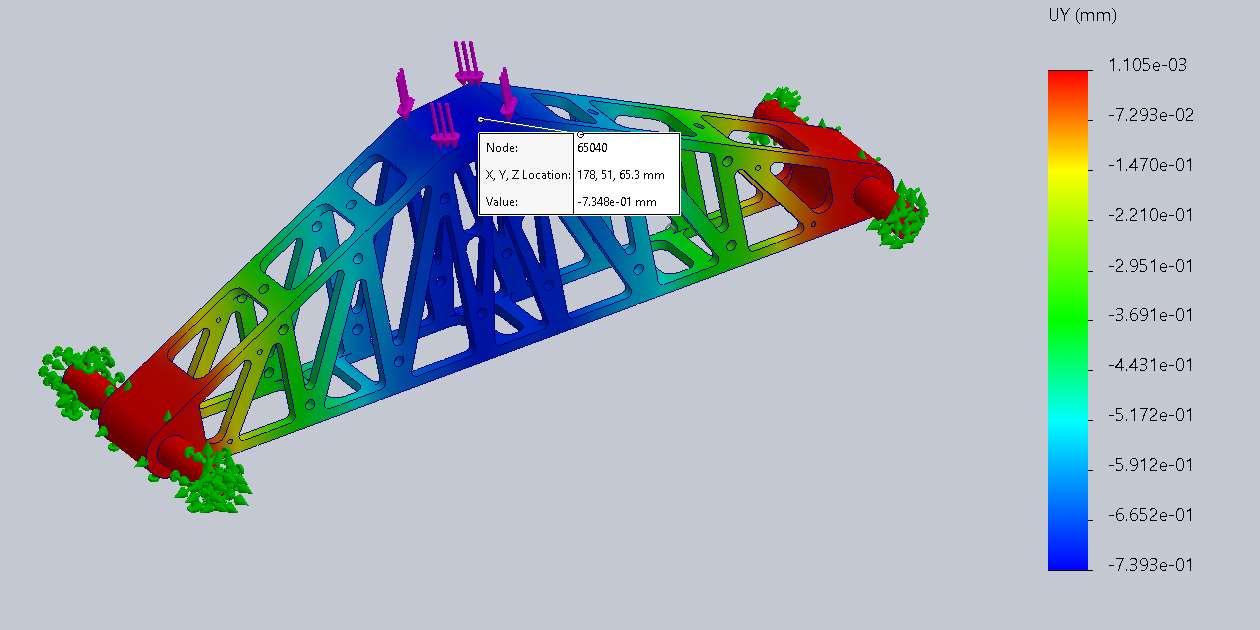
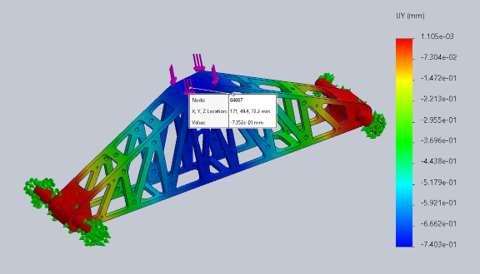
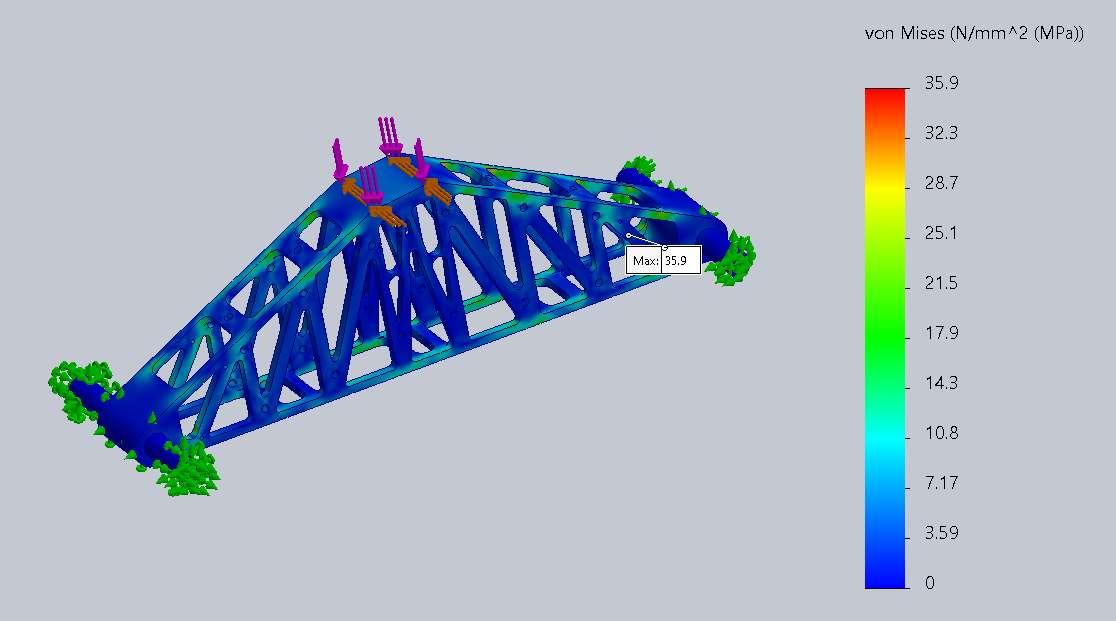
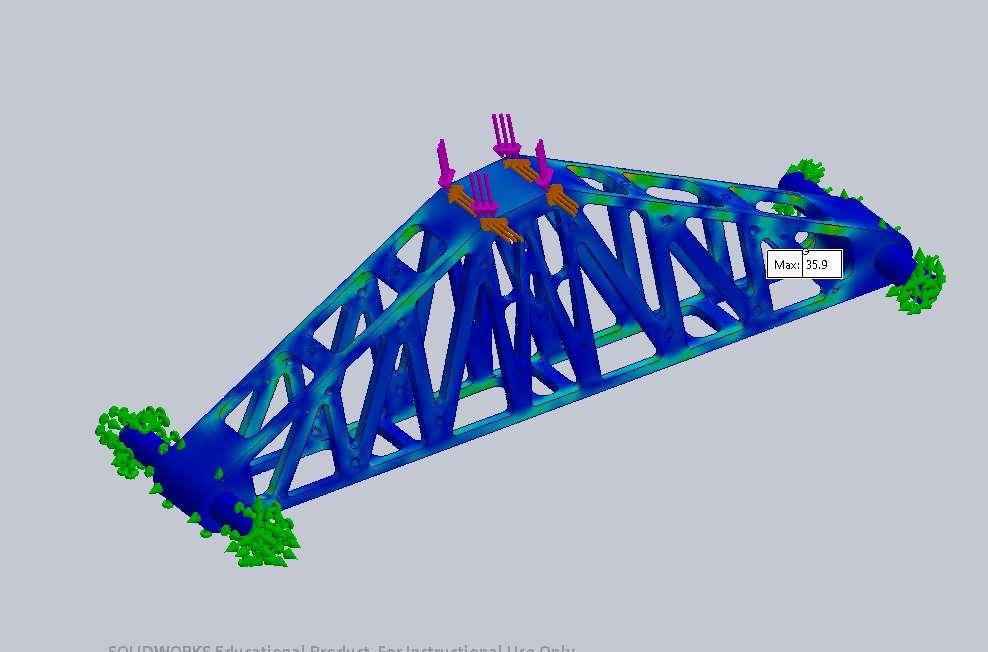
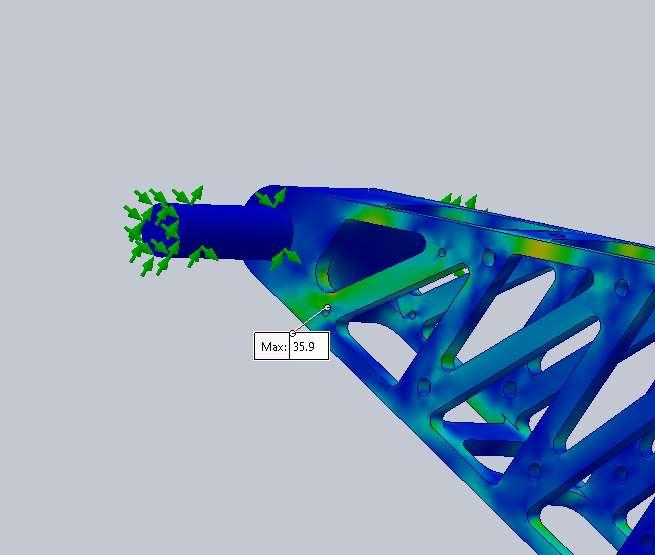
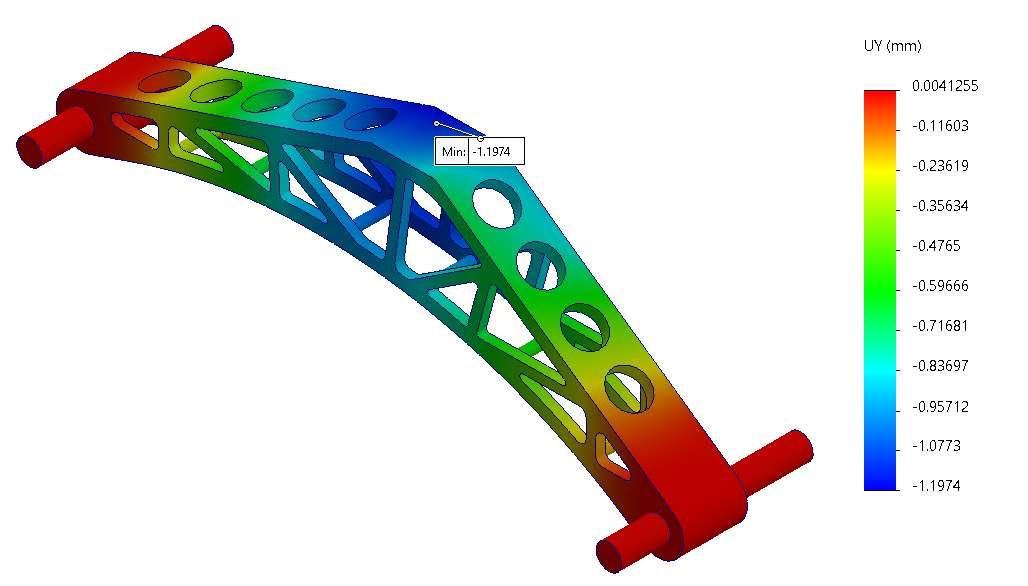
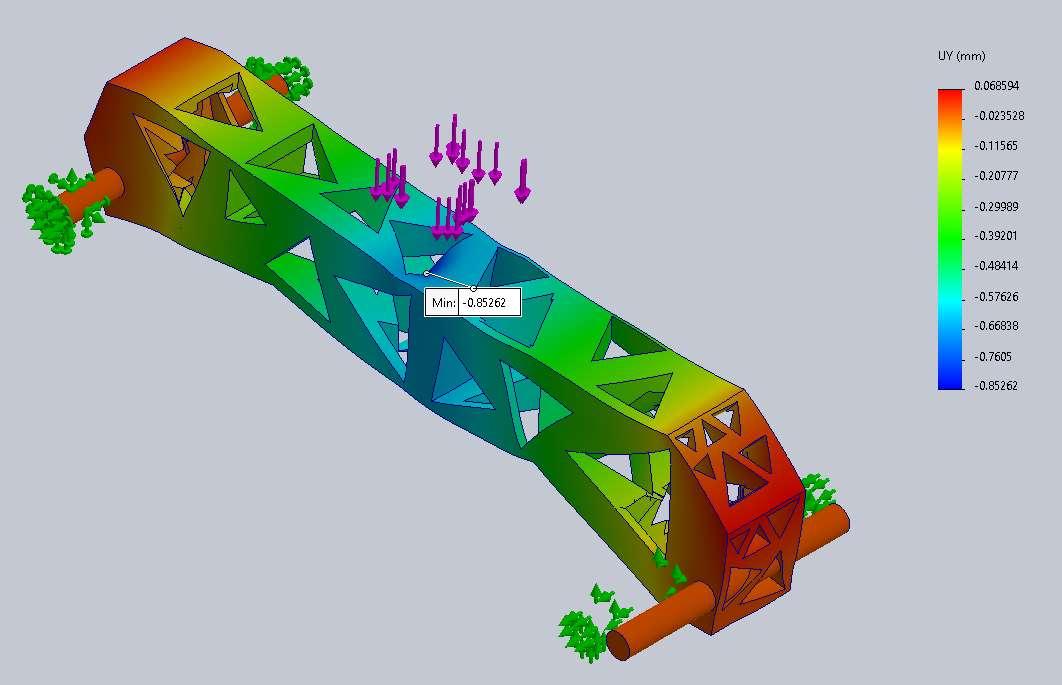
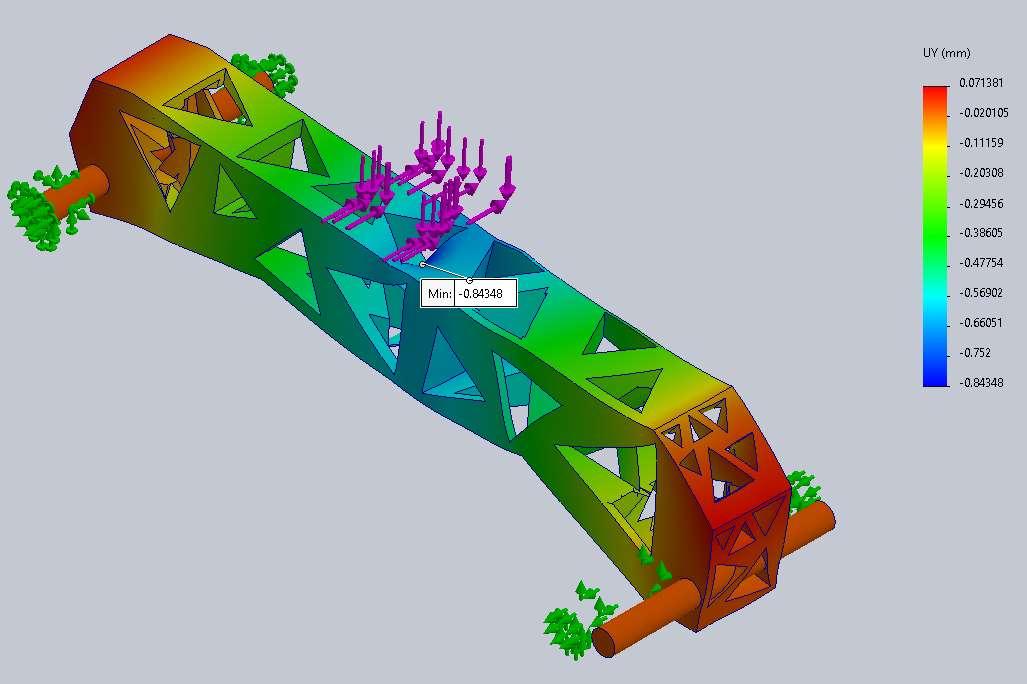
The predicted fracture location would be close to the roller pin supports. Accoording to the simulated results, it would be closer to the lower part/ base of the bridge. Genereally all the members close to this area are quite suceptible of being fractured first, due to the stress depiction as shown in the illustration below.
Part 6 - structure weight (g)
Predicted
Part 7 - structure weight to failure load ratio (g/kg)
Part 1 - Structure Geometry
Javier Fierro, 20744566 March 30th, 2024
Part 2 - Force-displacement predictions (vertical

Part 4 - Prediction of
Part 6 - structure weight (g)
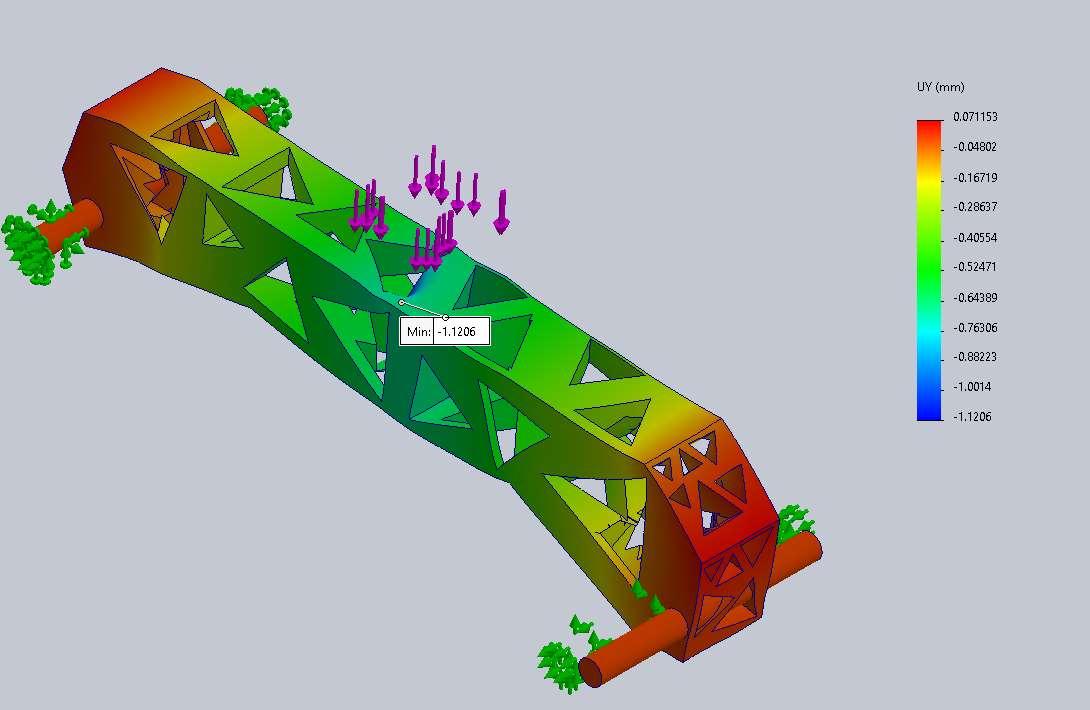
It is predicted that the structure will fail at the connection between the top member and the vertical chord near the left support. This can be seen in the first graph shown above. The maximum average stress surpases the yield strength value provided by the manufacturer (32 MPa).
Part 7 - structure weight to failure load ratio (g/kg)
Part 1 - Structure Geometry
Yueming Cai, 20850432
March 30th, 2024
Part 2 - Force-displacement predictions (vertical
Part 4 - Prediction of load
Part 5 - Prediction and illustration of fracture/failure initiation location
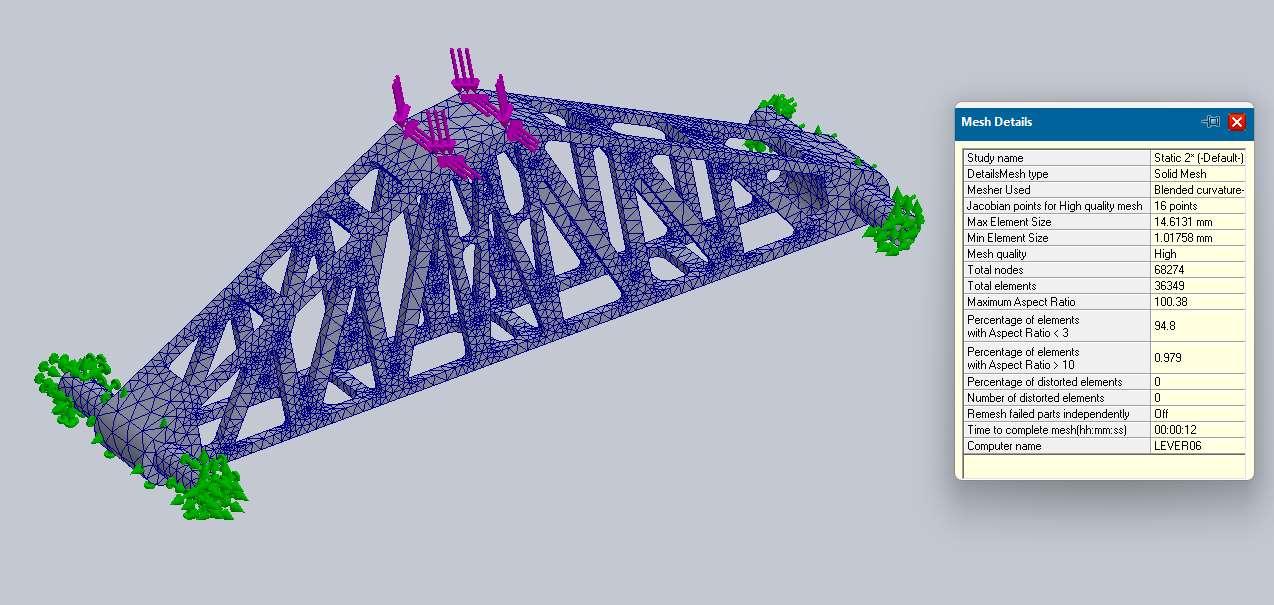
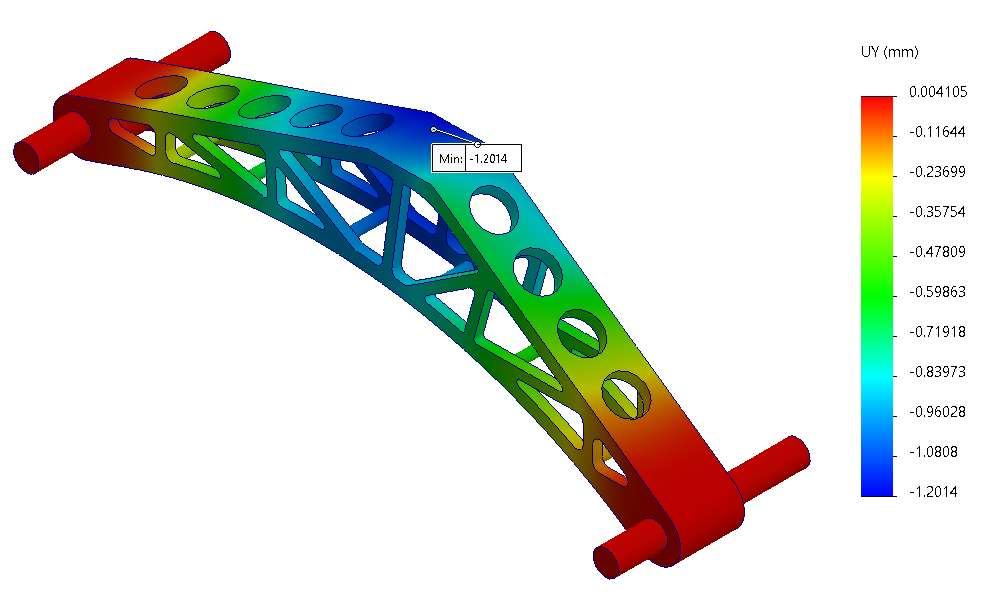
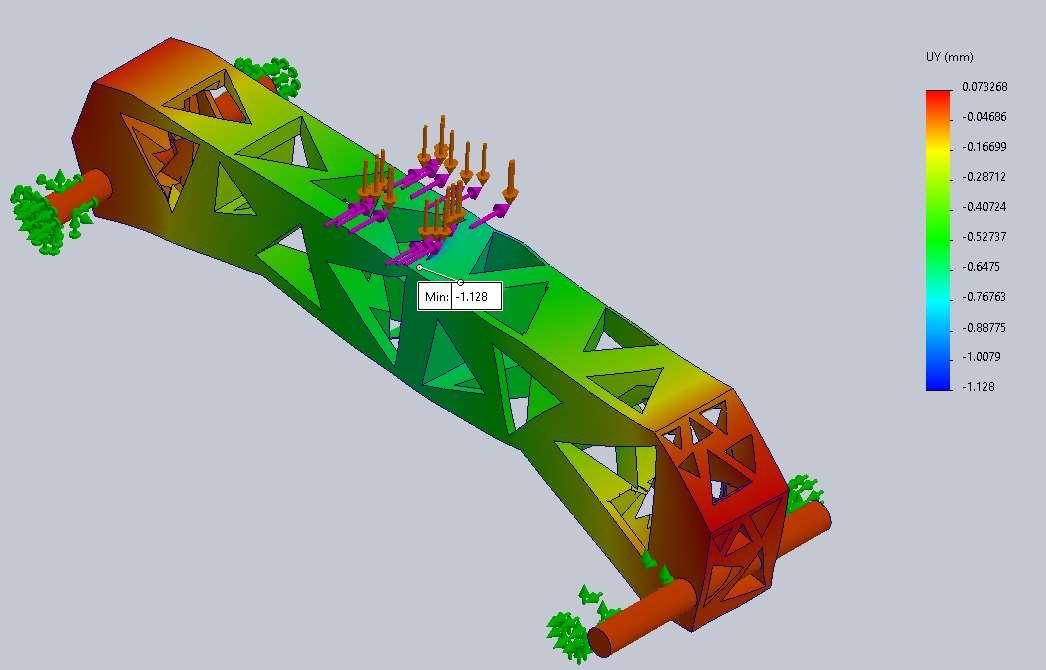
The fracture/failure initiation location will occur near one of the points on the right edge of the applied loads, and it will be on the top of the structure.
Part 6 - structure weight (g)
Predicted
Part 7 - structure weight to failure load ratio (g/kg)
Post-MortemResults – Group #13 (12 on testing day)
Damian Chalan - 20794892
Javier Fierro - 20744566
Yueming Cai - 20850432
PredictedvsActualPerformance
On testing day,our selected design wasanticipated to experience displacementaccording to Table 1. However, the actual vertical displacement observed was approximately double the expected amount. This indicates that we overassessed the performance of our design, and our non-linear analysis predictionsweremorecloselyalignedwiththeactualvalues.
This means that the stiffness of the structure was overestimated and considerations for the elastic behaviourofthematerialshouldbefurtheranalyzedtohavemoreaccuratepredictions.
1. Force-displacement predictions.
Basedonourstaticsimulations,weestimatedthatourbridgewouldsupportaweightofupto41.5kg. However, during testing, the design withstood a weight of 65 kg. This estimation was derived by analyzingtheVonMisesStressdistributionalongthesurfacesandvalidatingourresultsuntilsurpassing thetensilestrengthvalueof32MPa,asprovidedbythemanufacturer.
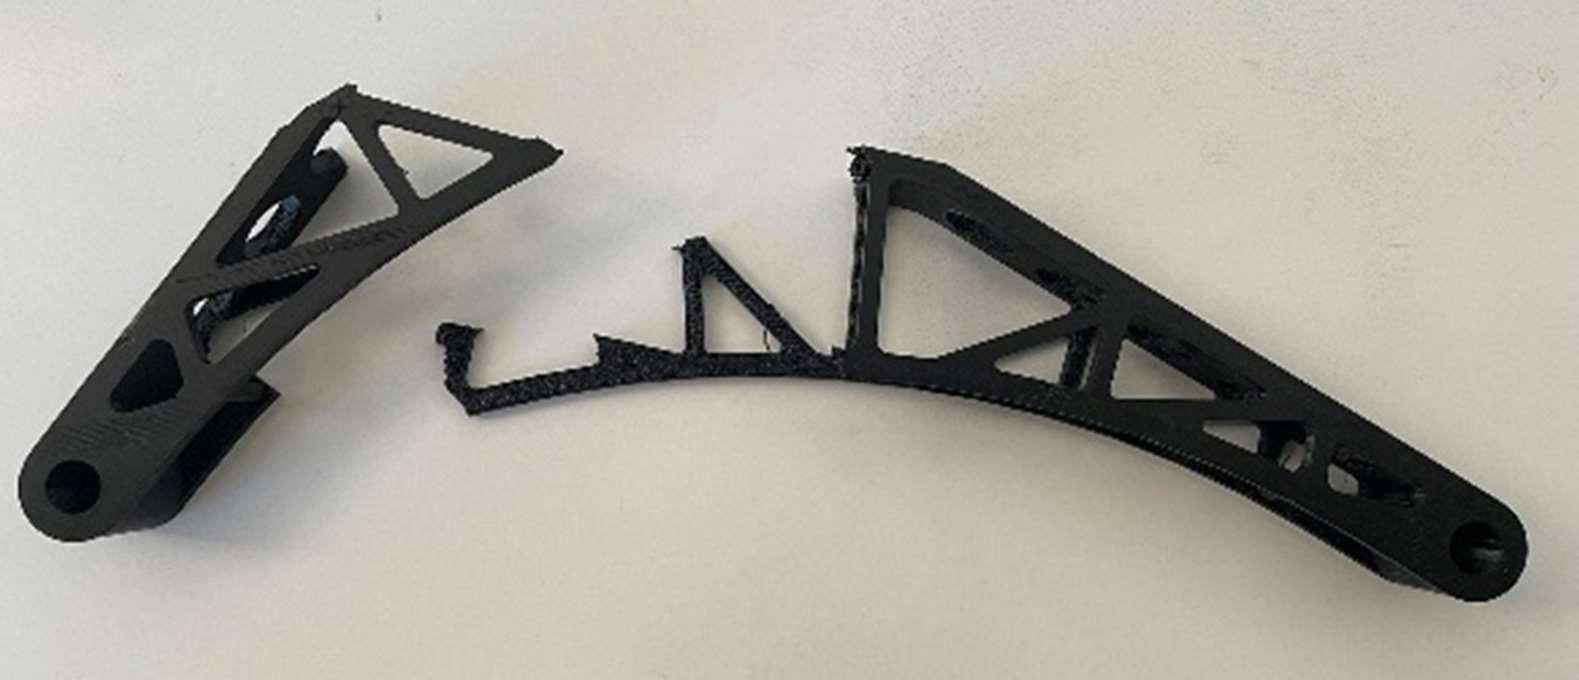
Moreover,theweightofthebridgewasalsooverestimated,asitwasinitiallydeterminedbythedensity andvolumeofthemodel'sshape.However,theuseof20%in llduringthe3Dprintingprocessresulted intheentirestructurebeinglighterthananticipated,weighingonly44gramsinreality.
Finally,theserevised valueswouldupdate ourStrength-to-WeightRatiofrom 1.44 to0.67,indicatinga signi cantly more ef cient and higher-performing structure than initially expected. All of these values canbesummarizedinTable2.
Finally,theanalysisofpredictedandactualfracturelocationisdescribedinTable3.
Table 33. Prediction and illustration of fracture/failure initiation location
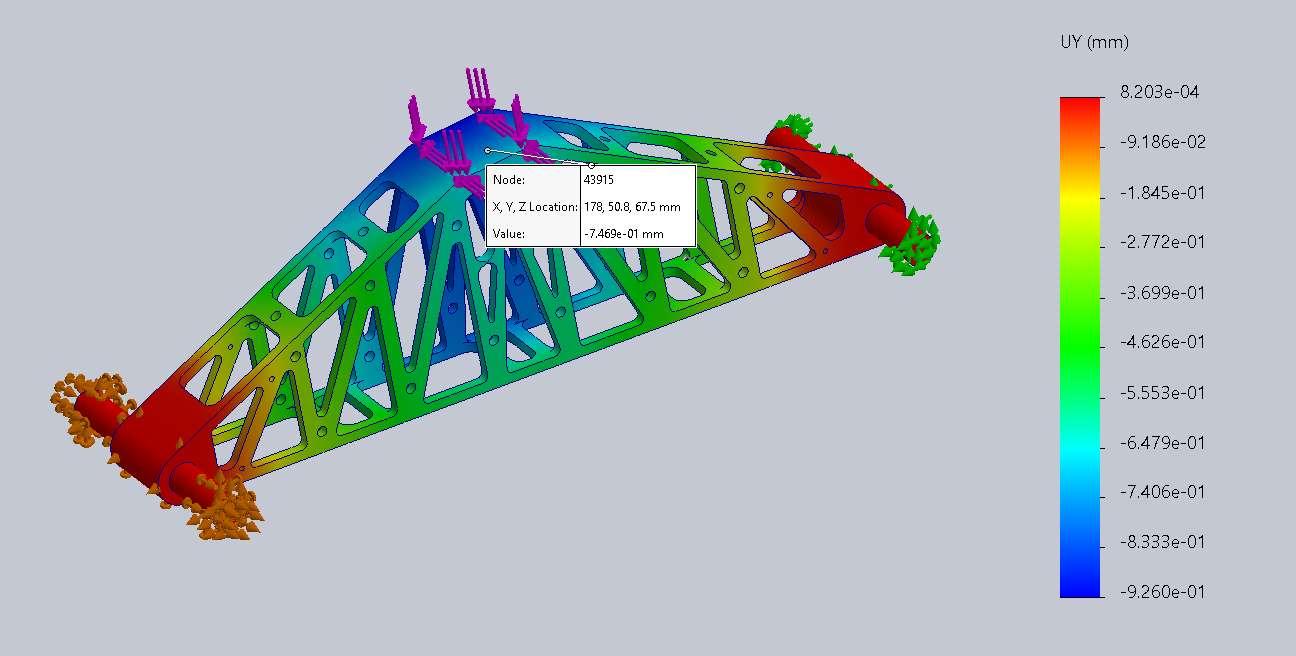
It is predicted that the structure will fail at the connection between the top member and the vertical chord near the left support. This can be seen in the first graph shown below. The maximum average stress surpasses the yield strength value provided by the manufacturer(32 MPa).
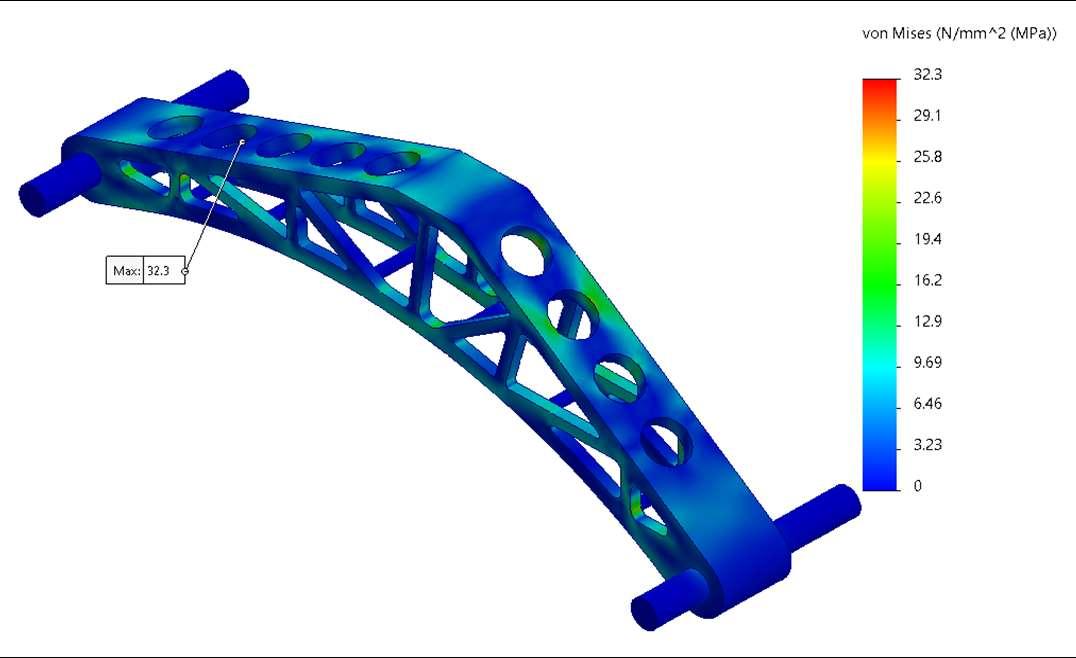
Theactualfailureoccurredatthetopflangeofthe bridge once the 65kg load was reached. The precise location of the failure is not possible to determine as the structure failed in a brittle behaviour. However, the actual fracture occurred in the predicted location, indicating a mostly accurateFEAsimulation.

Toimprovefuturepredictions,wecouldconsiderthefollowingactions:
Re ningmaterialproperties,suchastheelasticmodulus,yieldstrengthandPoisson’sratio,to bettercorrespondwithreal-worldbehaviour.
AdjustingtheweightofthestructureinSolidWorkstobetteralignwiththe3Dprintedstructure. Asourprintingprocessuseda20%in ll,theprintedstructureislighterthanestimated. TheseadjustmentswillbeincorporatedwhenreperformingFEAinSolidWorks,leadingtomore accuraterevisedresults.
Final Report: Fire Spread Modeling in Building Enclosures
Prepared by: Damian Chalan Jumbo
Student ID: 20794892
April 8th, 2024
The present abstract proposes a project with primary focus on computer modeling processes and technological tools for predicting fire spread on high rise buildings. The main problem that this project would explore would be on how these simulations can provide more accurate predictions of fire behavior, anticipating potential safety concerns during the design, construction, and investigation phases for building development
The primary objective of this project is to comprehensively understand existing modeling tools, their limitations, and identify research gaps where the results of these tools may lack reliability by looking at cases where experimental and simulation data are presented. While the primary focus lies on building enclosures, initial attention will also be directed towards fire spread, to ensure a comprehensive understanding of the modeling process for fluid dynamics.
To establish foundational technical knowledge, this project will delve into fundamental fire modeling concepts, with further reinforcement anticipated through the upcoming lectures on fire modeling within this course. The investigation will explore prominent Computer Fluid Dynamics (CFD) and surface-level operational principles of CFD, such as meshing design, model inputs, boundary conditions, and underlying assumptions in simulations. The conclusions would also emphasize on strategic solutions like considering interaction with other bodies when simulating Additionally, the potential benefits of refining computational meshes for validating CFD models will be explored. Finally, recommended practices for validating results would be shared as well as part of the report.
Fire spread within and between buildings is a complex phenomenon that involves the interaction of various factors, including the kindling of adjacent fuels, flashover from combustible gases, burning through partitions, and the movement of flames and burning materials. Accurately predicting the spread of fire in building enclosures is crucial for fire safety engineering and risk assessment. In order to address those challenges, several advanced computer-based models and simulations to predict and study fire spread have been developed in building environments. The term ‘modelling’ has two connotations, physical and mathematical. Although ‘mathematical’ modelling of fire has become predominant in the last two decades, ‘physical’ modelling has provided the basis for our understanding of the fundamentals of fire dynamics [1]. Many problems in other branches of engineering have been resolved by the same approach, applying procedures which permit full-scale behavior to be predicted from the results of small-scale laboratory experiments. Among the types of fire modelling developed throughout there are three modelling predominant types, which are semi-empirical approach, computational study area experiments.
Other models under those divisions include zone models simulate fire spread by dividing the enclosure into distinct zones, typically an upper hot gas layer and a lower cool layer. These models express the local flame spread rate and burning rate as functions of external radiation and oxygen concentration. Computational Fluid Dynamics (CFD) Models, CFD models use numerical simulations to predict the spread of fire smoke in highrise buildings. These models consider factors like air temperatures, gas concentrations,
and the heat release rate of fuels. A particular CFD program that will be mentioned continuously throughout the report is the use of Fire Dynamic Simulator (FDS), to be later explained in the methodology part of this report.
Combinatorial Spatial Data Models, Combinatorial spatial data models have been used for building fire simulation and analysis, providing a comprehensive approach to understanding fire spread within complex building geometries. However, these models face several challenges, including accurately predicting horizontal flame spread, incorporating the effects of blast and ambient winds, modeling multi-phase phenomena like pyrolysis, and the lack of sufficient data on fire spread within and between buildings. Despite these challenges, the development of computer fire spread models has significantly advanced the field of fire safety engineering. These models are used to assess the risk of materials, predict the behavior of fires in high-rise buildings, and improve the design of fire safety systems and fire forecasting capabilities. The following paper is deep investigation on the current methodologies and research in this field as their capabilities of computer fire spread models are expected to improve, providing valuable insights and tools for enhancing the safety and resilience of buildings in the face of fire hazards.
The methodology employed in this report involves investigating specific cases of fire spread modeling and discussing their common challenges, inputs, and trends in results. This discussion aims to enhance understanding of how simulations are conducted, and their accuracy compared to real experimental data.
Initially, the report provides a surface-level overview of the background process used by the program to obtain results. Subsequently, fire spread parameters research will be shown as will be key in understanding the results for the reviewed comparisons. The cases to be discussed include compartment room testing, façade testing in balconies and timber building study. The selection was based on the availability of actual studies were an experiment and an actual simulation were done side to side to find accuracy and refire measurements for future simulations, which is ultimately the objective of the report.
For each case, the following information was found to be critical to later comparisons and discussions, which was based on the study by [2].
1. The building description and geometry; which are crucial in any compartment simulation, as they determine the overall plan dimensions that accurately represent the building under test. Additionally, other important input data includes fire specification details such as fire growth, ventilation, and air supply parameters, which encompass factors like open doors, windows, and cracks around doors.
2. The computational mesh and domain; this aspect heavily depends on the size of the meshing or shape fragmentation, through which the FDS model can generate
results using Finite Element Method (FEM). While a larger mesh size typically necessitates longer processing times, it often leads to more accurate results compared to real-life experimental data.
3. Lastly, boundary conditions; which refer to the parameters applied to the solid surfaces being tested and are highly dependent on their location, adiabatic/ diabetic condition, etc For instance, flow speed is determined at the openings/vents, while the remaining solid surfaces would require thermal boundary conditions, typically based on the burning behavior of their material properties.
Finally, a general overview of fire spread in different types of facades will be presented to enhance understanding of FDS applicability. These input categories are crucial for comparing and discussing test models in the subsequent sections of the report.
4. Fire Spread Modelling
4.1. General Equations in Computer Modelling
The prediction of fire spread in buildings involves the use of sophisticated mathematical models and simulations to forecast how fire propagates within and between structures. These models account for complex phenomena such as igniting adjacent fuels, flashover from combustible gases, burning through partitions, movement of flames and burning materials, and the effects of thermal radiation, firebrands, and burning debris in fire spread between buildings. The FDS code is a computational tool for predicting fire scenarios and smoke spread that can be applied to all types of buildings. Its core algorithm is based on a Large Eddy Simulation (LES) code, which solves the Navier-Stokes equation for low-
speed, thermally driven flow using a second-order finite difference numerical method. This method closely resembles Finite Element Method (FEM) design in terms of meshing but is applied to fluids [3].
According to [2], the equations involved in the backend process of FDS are extensive but can be better understood by subdividing them into the following sections;
1. Flow governing equations: These include the conservation of mass, momentum, and energy equations, as well as the equation of state for a perfect gas.
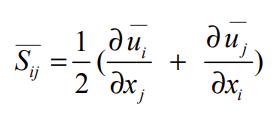
2. Reynolds-averaged Navier-Stokes (RANS) methods: This involves filtering the Navier-Stokes equations, with viscosity represented as a variable (Eq. 1). Later, this variable can be separated, allowing for the evaluation of additional values such as the strain rate tensor (Eq. 2).
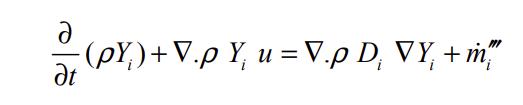
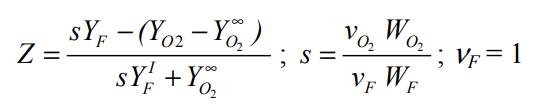
3. Combustion model: FDS utilizes a combustion model where values are conserved as scalar quantities and expressed in Eq. 3.
3
Radiative heat transfer equations, commonly known in course content, are solved through FDS using finite-volume methods for convective transport. While several more in-depth equations are part of the backend process that FDS utilizes for generating results, the ones mentioned above are the most relevant to date.
According to a study by the Building Research Institute in Poland [3], the fire model for facade fire spread is heavily influenced by the following factors:
• Rate of burning in a room (kg/s): Ventilation conditions directly affect the burning rate, impacting the severity and shape of a venting fire plume.
• Projecting flames out of a window once the glass is broken by fire.
• Shape of plume vents from openings, which are influenced by envelope ventilation conditions and window shape. The width and height of venting flames also depend on the window aspect ratio, with inputs including flame height, width, and temperature along the flame centerline.
• Curling back plumes as they purge out and make contact with the exterior wall. The external surface can be affected by radiation heat flux, necessitating emissivity calculations. These considerations play a significant role in understanding and modeling fire spread on facades and be considered for the coming overview sections in the report.
4.3. Modelling Overview by Building Type
In the following study made by [4], a five full-scale fire experiments were conducted to assess the performance of a two-storey CLT residential building. These experiments served as a reference for validating the current computer model. Here, it was examined the impact of ceilings and exposed walls on a practical full-size apartment in fire scenarios. The experiments were carried out in a two-story apartment building with designated areas for various rooms and corridors. Each test involved different fire scenarios lasting up to 240 minutes, representing real residential fire situations.
The model utilized materials with properties identical to those in the reference experiment, following constant thermal properties for solid surfaces as described in [5]. Wood (yellow pine) cribs were employed to augment the fuel load in the living room and bedroom. The model itself was constructed from CLT, featuring beams, columns, walls, and ceilings.
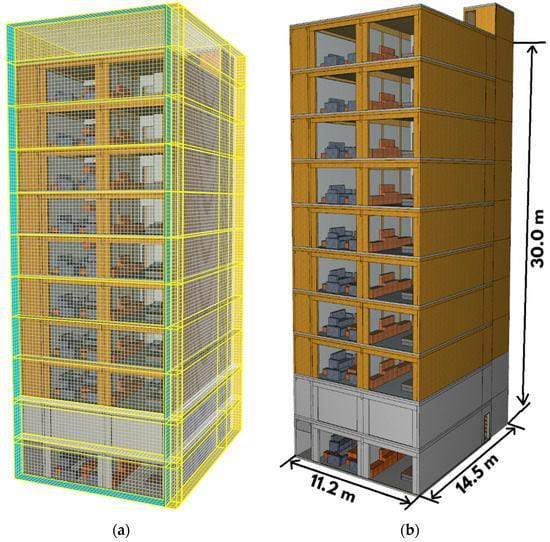
Concrete was applied to the exterior surface of the CLT ceiling and the first-floor floor, serving as the model's foundation. Gypsum wallboards were utilized as interior walls and as passive fire protection covering CLT surfaces (internal and external walls, ceiling, beams, and columns) in the first two storeys. The fire ignition point was replicated in the kitchen corner, mirroring the setup of the reference experiment. The total fuel load, inclusive of furniture and wood cribs, approximated 570 MJ/m². The CLT building model measured 14.5 m by 11.2 m by 30 m, as depicted in Figure 1.
The model was partitioned into a computational grid, with grid independency tests conducted. A total of 2,133,243 mesh cells were utilized, each measuring 0.15 m in all dimensions. A sample of the grid independency test, employing 1,543,336 mesh cells [4]
In terms of boundary conditions, at the initiation of numerical modeling (t = 0), indoor and outdoor regions within the entire computational domain were assumed to have a temperature of 20°C and zero velocity, respectively. The simulation duration was set to 180 minutes. Consistent with the reference experiment, the door between the living room and bedroom, along with the opening vent on the first floor, were left open to simulate a well-ventilated fire scenario. The fire originated in the kitchen on the first floor, ignited by a 250 ml gasoline source represented in the model as a rectangular volume measuring 1m by 1m with a height of 0.2 m.
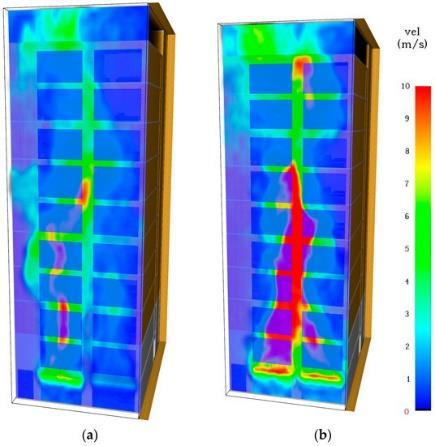
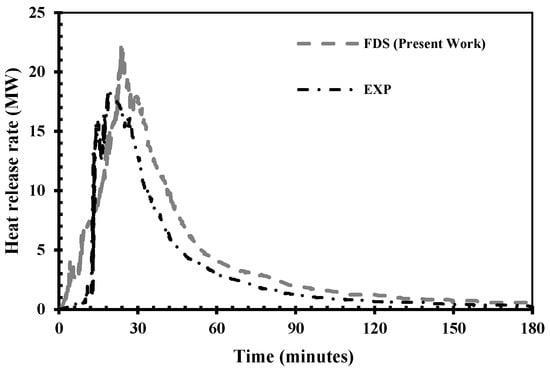
Numerical simulations utilizing FDS investigated fire scenarios in a multi-storey CLT building, validated against experimental data from a full-scale test conducted on a twostorey CLT residential building. The results exhibited strong agreement with experiments, revealing rapid fire spread and flashover occurring in the living room and bedroom within 16 to 21 minutes, with maximum temperatures reaching 1100°C and 1000°C, respectively. Notably, there was concordance between predicted and experimental temperatures on surfaces and walls. Predicted temperatures along wall A across different floors correlated with experimental findings, peaking between 500°C and 100°C at various heights. Moreover, predicted heat release rates (HRR) closely matched experimental data, while O2 and CO2 concentrations remained consistent across floors lacking fire activity. These results highlight the efficacy of CFD tools such as FDS for predicting fire scenarios in highrise CLT buildings.
The study utilized an experimental combustion room inside a building to replicate the simulation and test reliability. The modeling of the combustion room replicated conditions of a full-scale fire test using the Room Corner Tester, as outlined in ISO-9705 standards [6]. The combustion room was simulated on a 36 x 24 x 24 grid, matching the dimensions of the Room Corner Tester. Combustibles were placed at the center of the room, and air inflow and exhaust outflow were configured according to the specified ISO specifications.
Numerical analysis was conducted over 11 hours using 64 CPUs to replicate the actual fire duration of 28 minutes (1680 seconds). To accelerate fire development towards flashover in a full-scale fire test, the kitchen was designed with a larger initial heat release rate.
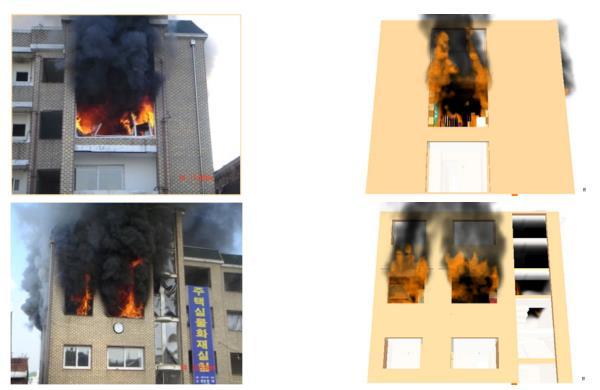
For the experiment setup specifically, the fire qualitatively grew and developed through the same flame spread process as observed in the full-scale fire. One minute after natural ignition, smoke emerged from the balcony and living room window. Within six minutes, upon opening the entrance door, the fire rapidly intensified, leading to the breaking of the front windows in the living room. After 24 minutes, the flame spread to the small room and balcony, causing the balcony windows to break and the windows in the small room to fracture.
4.3.4.
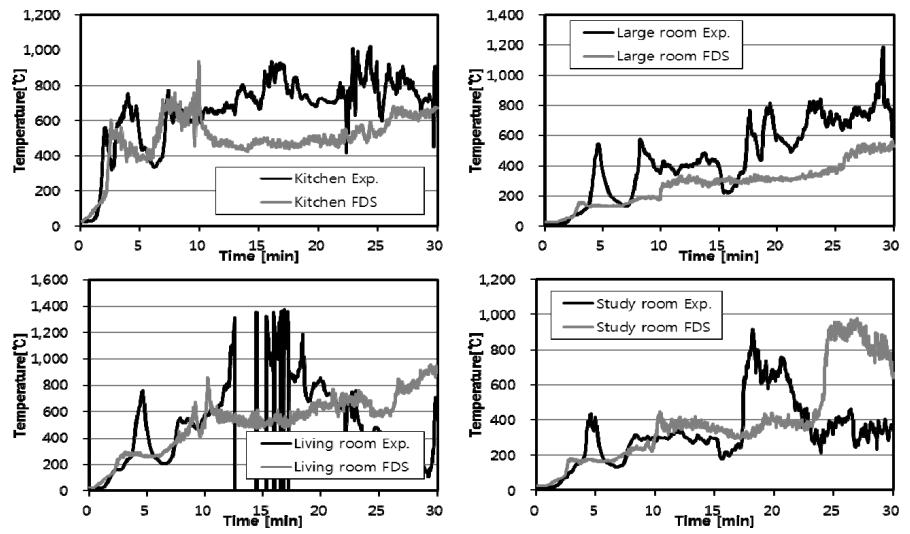
At the conclusion of the experiments, the full-scale test recorded the highest heat release rates: 5930.1kW in the living room, 7433.3kW in the large room, 5971.5kW in the small room, and 5131kW in the kitchen. In contrast, numerical analysis conducted by FDS
produced values of 6341.0kW in the living room, 8302.1kW in the large room, 5590.9kW in the small room, and 6201.3kW in the kitchen. Numerical analysis overestimated the fullscale test by 11% of the standard deviation, as depicted in Figure 4.
These findings suggest that fire models for residential buildings can qualitatively predict flame spread and flashover in full-scale fire tests. However, quantitatively, temperature predictions were underestimated by 20% of the standard deviation compared to the fire test, with time predictions delayed by 15% of the standard deviation.
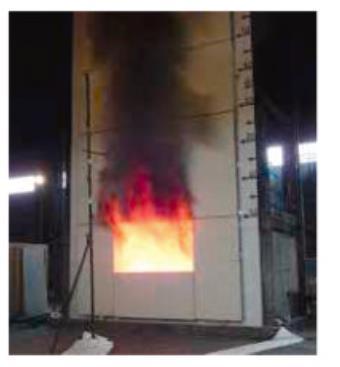
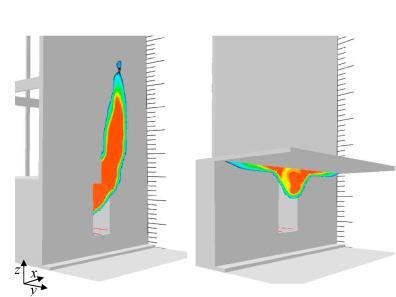
The following study focussed on the application of balconies and wall separation for testing fire separation in building enclosures. Full-scale experiments conducted by the National Research Council of Canada (NRCC) measured heat flux on façades from various external fire plumes, laying the foundation for the current Standard Method of Fire Test of Exterior Wall Assemblies based on CAN/ULC-S134 [8]. These experiments utilized propane gas burners within a compartment with controlled mass flow rates to generate different total HRR. A vertical array of heat flux sensors measured radiation and convection on the façade. The interior compartment measured 6.0 m wide by 4.4 m deep and 2.8 m in height, containing prescribed exterior openings.
5 Continuous Balcony Experiment and Simulation Set-up
Simulations with balcony projections used a domain 8 m wide by 8 m deep and a height of 6 m, with a grid resolution of 10 cm for a total of ∼384,000 cells. Boundary conditions were set as either adiabatic or inert. Adiabatic conditions assume no heat transfer on compartment boundaries, crudely representing steady-state conditions over time.
The simulation models and configurations were based on the NIST FDS model replicating the NRCC Façade experiment. The radiative fraction of the propane fuel combustion reaction was set at 0.3, which is typical for propane. This fraction typically decreases with increased fire size in an open environment due to reduced ventilation.
Propane combustion was yielded from select literature range between 0.01 and 0.05 kg/kg depending on ventilation conditions [9]. The soot yield of the fire plume is expected to be highly intermittent and heavily influenced the heat flux of the experiments. It was noted that the sensitivity of the specified soot yield in FDS, with methane flame soot yield increasing from 0.01 to 0.02 kg/kg resulting in a 15% increase in radiant flux. Similarly, in
this study, increasing the soot yield from 0.015 to 0.03 kg/kg resulted in an approximately 10% increase in radiant flux.
The experiment utilized a 200-kW burner with an aspect ratio of 3:1. Heat flux measurements were recorded at various distances from the burner, as depicted in Fig. 6, and this study replicated this experiment in FDS, and the predictions showed good agreement with the measurements
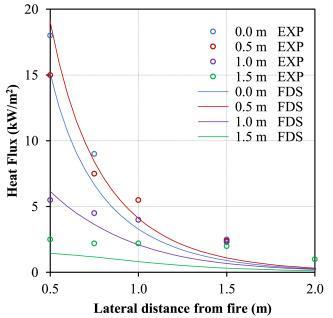
[9].
This study concludes that numerical simulations reliably predict fire dynamics, with validation and verification ensuring reasonable predictions. Understanding fire plume physics allows for estimating fire plume characteristics, aiding in approximating heat transfer to surfaces. Predicting heat flux helps assess the likelihood of fire spread. Recent studies investigate how facade design impacts surface heat flux from fire plumes, including horizontal projections, sidewalls, and inclined facades. However, the effect of
horizontal projections on lateral heat flux has not been extensively studied. Given the prevalence of continuous balconies in many multi-unit residential buildings, this study employs numerical simulations to quantify lateral heat flux on facades from ejected fire plumes.
4.4. Fire Spread Overview by Facade Type.
4.4.1. Glazed Facade
Modern high-rise buildings often feature glazed facades, comprised of glass panels. While glass is non-combustible, it can still contribute to fire spread. Glazed facades are vulnerable points in building envelopes, easily broken during fires, allowing hot gases to enter rooms and facilitating fire spread. The main causes of glass breakage during fires are the temperature gradient across the glass panel and between its exposed and ambient sides [10]. There are various types of glass facades, some with frames and thermal movement restrictions, while others are frameless. Frames can affect glass breakage, with some providing little restraint due to minimal expansion. Glass panes may be supported by two or four edges, with different levels of constraint. Studies on glass breakage typically use dynamic response or thermal stress models.
4.4.2. Double Skin Facade
For double-skin facades (DSF) have gained popularity in recent years, consisting of inner and outer skins. They offer several advantages over traditional glazed facades, such as reducing acoustic impact, solar heat gain, and energy consumption. However, DSFs may increase fire risk if the inner glass breaks during a fire, allowing smoke and flame to spread
to adjacent levels. The cavity depth is a key parameter affecting fire spread in buildings with DSFs. Studies analyzed smoke movement and surface temperatures but were insufficient for understanding smoke flow patterns in DSFs [11]. Additionally, numerical methods with the CFD code FDS were used to study smoke movement inside the cavity, where there were considered factors such as turbulence, combustion, heat transfer, and radiative transport [12]. Small cavity depths resulted in higher temperature differences between skins, while larger depths led to lower curtain wall surface temperatures due to more cool air entrained by hot smoke. Narrow cavities showed higher inner surface temperatures. Deeper cavities were found to enhance safety, as the outer glass would break rapidly in narrow cavities. If the inner glass breaks before the outer skin, it could lead to fire spreading to adjacent upper levels.
4.4.3. Facade covered by External Thermal Insulation Composite Systems
Flame spread behaviors over solid surfaces result from heat and mass transfer, solidphase pyrolysis, and gas-phase chemical reactions. Many factors influence flame spread in real fire scenarios, including ambient flow velocity, oxygen concentration, pressure, and radiation intensity. The controlling mechanisms of flame spread behavior vary depending on the circumstances.
Flame spread models can be categorized based on their features; heat transfer models and chemical kinetic models, depending on whether chemical kinetic reactions are considered; Opposed flow flame models and concurrent flame spread models, determined by the direction of flame spread relative to ambient flow and horizontal,
upward, and downward flame spread models, based on the flame spread direction relative to gravity [13].
Common thermal insulation materials in buildings include thermoplastic materials like extruded polystyrene (XPS) and expanded polystyrene (EPS), which melt and flow when exposed to fire. This behavior differs from thermosetting materials like polyurethane foams (PUR) and polyisocyanurate foams (PIR). Flame spread models over solid surfaces can thus be analyzed considering these differences between thermoplastic and thermosetting materials [3].

These models effectively characterize the controlling mechanisms of flame spread over solid surfaces and thermal insulation materials under various conditions, such as the combustion model by Quitere in Figure 7. However, they are not applicable for understanding flame spread behavior along facades. These models are designed for single-component materials, making them unsuitable for composite products like External Thermal Insulation Composite Systems, and they comprise multiple components applied
directly to facades, including adhesive, insulation material, anchors, base coat, reinforcement (like glass fiber mesh), and finishing coat.
Throughout the entire report, a lot of cases of experimental data and actual FDS results were shown in regards of obtaining a fair comparison for the deviation, and dispersion that these results would yield. Looking back at the cases, at the CLT building, the numerical FDS results agreed with Throughout the entire report, numerous cases of experimental data and corresponding FDS results were presented to ensure a fair comparison for deviations and dispersions in the results. Reflecting on these cases, in the CLT building scenario, the numerical FDS results aligned well with the predicted experiment, matching values for heat release rate (HRR) and closely approximating wall surface temperatures, as shown in Figure 2. However, the compartment fire model revealed an interesting deviation. Testing conducted in various locations within the buildings, including the kitchen, living room, study room, and large room (as illustrated in Figure 4), indicated that fire models for residential buildings can qualitatively predict flame spread and flashover in full-scale fire tests. Nonetheless, temperature predictions were underestimated by 20% of the standard deviation compared to the fire test, with time predictions delayed by 15% of the standard deviation.
The last case, focusing on continuous balconies, demonstrated the most accurate data, as the test was conducted multiple times by the NRCC, revealing a strong trendline in heat flux results. However, the effects on lateral heat flux were problematic for a variety of
building balcony configurations, leading to errors in quantities of this lateral heat flux in those cases.
Examining different facade types underscores the need for thermal stress models for glass facades and the challenge of predicting smoke flow patterns for double-skin facades. For facades with thermally resistant materials, it is crucial to emphasize the importance of mode models for individual components and their thermal resistances, which significantly impact the understanding of flame spread in such conditions.
In conclusion, the necessity for models is evident, with many cases demonstrating their ability to yield accurate results closely aligned with experimental projections. However, in my research on finding experimental versus simulation data, I encountered difficulties in finding a standardized method that could facilitate easier comparisons using the methodology or explained input information. This variability prompted the exploration of various cases and types in this report. While FDS models offer promising results, factors such as lateral/horizontal projections, the inclusion of individual component properties in composite facades, and variability in flame spread in plan environments, such as the compartment cases, remain areas for future exploration and will be a primary focus of interest for future simulations.
[1] D. Drysdale, An Introduction to Fire Dynamics, West Sussex: John Wiley & Sons Ltd., 2011.
[2] F. Ahmed, G. Abdel and A.-G. Hamza, "Prediction of Smoke Propagation in a Big Multi-Story Building Using Fire Dynamics Simulator," American Journal of Energy Engineering, vol. 3, pp. 23-41, 14 February 2015.
[3] A. Kolvrecki, "Model of fire spread out on outer building surface," BULLETIN OF THE POLISH ACADEMY OF SCIENCES, vol. 63, no. 1, 2015.
[4] S. M. Hayajneh and J. Naser, "Fire Spread in Multi-Storey Timber Building, a CFD Study," Fluids, vol. 8, no. 5, 2023.
[5] D. G. J. R. H. K. H. E. K. M. P. J. T. J. M. W. C. W. Morgan J. Hurley, SFPE Handbook of Fire Protection Engineering, Berlin: Springer, 2016.
[6] International Standard of Organization, "Room corner test for wall and ceiling lining products," ISO 9705-1:2016, 2021.
[7] C.-S. Ahn and J.-Y. Kim, "A study for a fire spread mechanism of residential buildings with numerical modeling," Safety and Security Engineering IV, vol. 117, 2011.
[8] V. Babrauskas, "Façade fire tests: towards an international test standard," Fire Technology, vol. 32, pp. 219-230, August 1996.
[9] Z. L. Philip Mckeen, "The impact of horizontal projections on lateral fire spread in multi-unit residential buildings - comparison of numerical and similarity correlations," Fire Safety Journal, vol. 126, December 2021.
[10] Y. Wang, "Numerical study on fire response of glass facades," Construction and Building Materials, vol. 61, pp. 172-180, 2014.
[11] W. Chow and W. Hung, "Effect on cavity depth on smoke spreading of double-skin facade," Building and Enviroment , vol. 41, pp. 970-979, 2006.
[12] L. Junmei, "Numerical studies on effects of cavity width on smoke spread in doubleskin facade," International Symposium, on Safety Science and Technology 1, pp. 695-699, 2012.
[13] J. de Tis, "The spread of a laminar diffusion flame over a combustible surface," in Twelfth Symposium International on Combustion 1, 1968.
[14] J. Quintere, "The Atrium, Southern Gate," in John Wiley and Sons, Chichester, 2006.