
Tannum Sands Market Update 2nd Half 2025


HOUSE SALES
HALF YEAR CHANGE FROM LAST HOUSE MEDIAN PRICE
HOUSE RENTAL PRICE
SALES
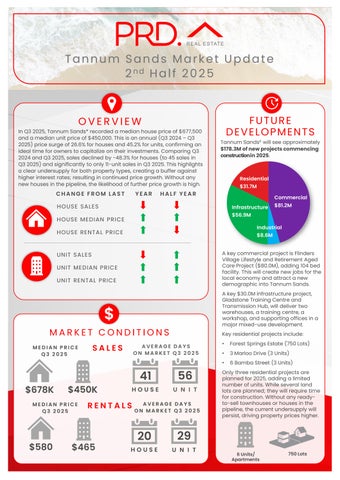
In Q3 2025, TannumSands* recorded a median house price of $677,500 and a median unit price of $450,000.This is anannual (Q3 2024 – Q3 2025)price surge of 26.6%for houses and 45.2%for units, confirming an ideal time for owners to capitalize on their investments. Comparing Q3 2024and Q3 2025,sales declined by -48.3% for houses (to 45sales in Q3 2025)and significantly to only 11-unit sales in Q3 2025.This highlights a clear undersupply for both property types, creating a buffer against higher interest rates; resulting in continued price growth. Without any new houses in the pipeline, the likelihood of further price growth is high. 41 $678K $450K AVERAGE DAYS ON MARKET Q3 2025 AVERAGE DAYS ON MARKET Q3 2025 56
PRICE
RENTAL PRICE

MEDIAN PRICE Q3 2025
MEDIAN PRICE Q3 2025
TannumSands£ will see approximately $178.3Mofnewprojectscommencing constructionin2025


A key commercial project is Flinders Village Lifestyle and Retirement Aged Care Project ($80.0M), adding 104bed facility. This will create new jobs for the local economy and attract a new demographic into TannumSands.
A key $30.0Minfrastructure project, Gladstone Training Centre and Transmission Hub, will deliver two warehouses, a training centre, a workshop, and supporting offices in a major mixed-use development.
Key residential projects include:
• Forest Springs Estate (750Lots)
• 3 Marloo Drive (3 Units)
• 6 Bamba Street (3 Units)
Only three residential projects are planned for 2025, adding a limited number of units. While several land lots are planned; they will require time for construction. Without any readyto-sell townhouses or houses in the pipeline, the current undersupply will persist, driving property prices higher.


AVERAGE VENDOR DISCOUNT*
Average vendor discount reflects the average percentage difference between the first list price and final sold price. A lower percentage difference (closer to 0.0%) suggests that buyers are willing to purchase close to the first asking price of a property.


$1,000,000
Average house vendor discounts between Q3 2024and Q3 2025is still a premium, however, have lessened to a smaller premium of 0.6%. It swung from a discount to a premium of 2.4% for units. Market conditions favoursellers, as buyers must offer higher than the first listed price. This signals an opportune time for owners to sell, and without any new stand-alone housing stock planned, buyers need to act fast before premiums climb even further.
The suburb of Tannum Sands has outperformed the wider Gladstone Local Government Area (LGA) in house price for the past 5 years, and on par for unit price. 2025# saw house prices in the suburb becoming a premium, while unit remain on par; providing a chance forbuyers
Most of the homes sold in TannumSands* across 2025# were in the more affordable priced bracket of $500,000to $599,999(28.1%). Most of the units sold were in the middle price bracket between $400,000to $499,999(33.3%). The premium house market of $800,000and above is growing, with 21.1% of sales; as is the upper priced unit market of $500,000-$5999,999(25.9%).This is beneficial for owners. Overall, there is a home for every budget.
MARKET COMPARISON
Tannum Sands (4680) House
Tannum Sands (4680) Unit
Gladstone LGA House
Gladstone LGA Unit
The market comparison graph provides a comparative trend forthe median price of houses and units over the past 5 years. The main LGA profiled is chosen based on the proximity tothe main suburb analysed, which is


PRICE BREAKDOWN 2025

$500,000 to $599,999
$600,000 to $699,999
$700,000 to $799,999
$800,000 and above


Less than $299,999
$300,000 to $399,999
$400,000 to $499,999
$500,000 to $599,999
$600,000 and above
TannumSands.
RENTAL GROWTH 2025€
House rental yield in TannumSands¥ was 4.5%in September 2025, well above Brisbane Metro (3.1%). This was paired with a 3.6%increase in house median rent price in the past 12months to Q3 2025,at $580per week, and a -12.7% decline in the number of houses rented (to 48 rentals in Q3 2025) This suggests anundersupplied and competitive house rental market. With a more affordable investment option than Brisbane, this is beneficial to investors.
3-bedroom houses have provided investors with +5.8% rental growth annually, achieving a median rent of $550per week.
Tannum Sands¥ recorded a vacancy rate of 2.5%in September 2025,above Gladstone LGA’s 0.9%and Brisbane Metro’s 1.0%average. Vacancy rates in TannumSands¥ have increased in the past 12 months, due to investors re-entering the market. A 2.5% vacancy rate is still well below the Real Estate Institution of Australia’s healthy benchmark of 3.0%, indicating quicker rental occupancyin TannumSands¥. This suggests a conducive environment forinvestors, even if median house and unit price (thus entry price) has increased in the past 12months.
RENTAL VACANCY RATES 2025


Tannum Sands (4680) Gladstone LGA Brisbane Metro REIA 'Healthy' Benchmark
PROJECT DEVELOPMENT MAP 2025 ₳
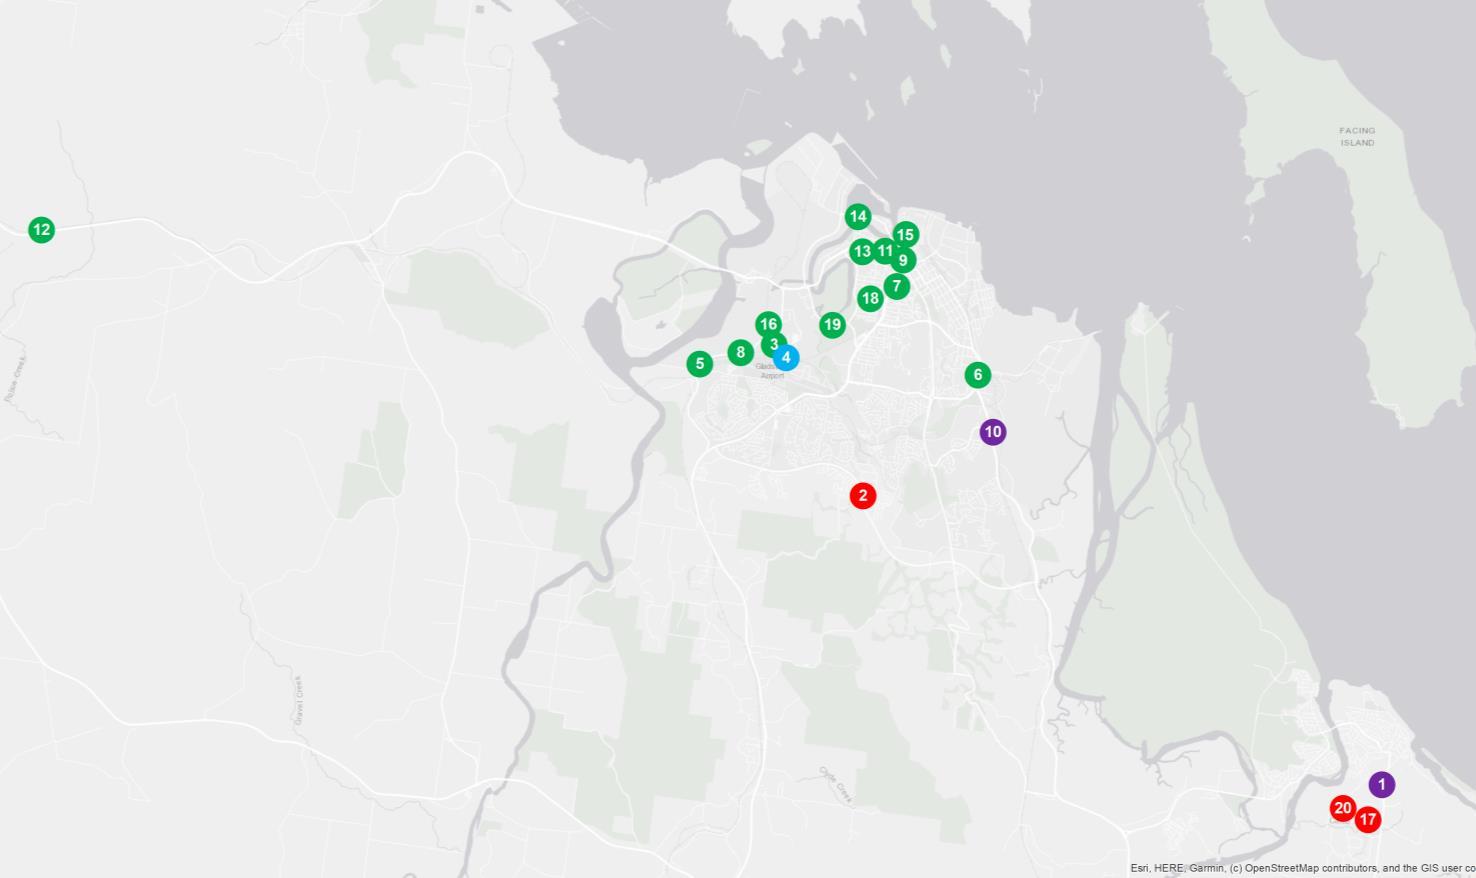
TANNUM SANDS


RESEARCH SERVICES
Our research services span over every suburb, LGA,and state within Australia; captured in a variety of standard and customised products, andinclude:
• Advisory and consultancy
• Market analysis including profiling and trends
• Primary qualitative and quantitative research
• Demographic and target market analysis
• Geographic information mapping
• Project analysis including product and pricing recommendations
• Rental and investment return analysis
OUR KNOWLEDGE
Access to accurate and objective research is the foundation of all good property decisions.
OUR PEOPLE
Our research team is made up of highly qualified researchers who focus solely on propertyanalysis.


REFERENCES
* Tannum Sands sales market data and key indicators encapsulates aggregate property market conditions within the suburbs of Tannum Sands, Boyne Island and Turkey Beach.
** Estimated values are based on construction value provided by the relevant data authority and does not reflect commercial and/or re-sale value.
# 2025 encapsulates sales transactions for Q1 – Q3 (01/01/2025 – 30/09/2025) only, other years encapsulates sales transactions for the full year (i.e 01/01 to 31/12 of the relevant year).
€ Annual rental growth is a comparison between Q3 2024 (01/07/2024 – 30/09/2024)and Q3 2025 (01/07/2025 – 30/09/2025) house median rent figures.
¥ Tannum Sands rental market data encapsulates aggregate property conditions within the postcode of 4680.
§ Rental yields shown are as reported as of September 2025.
₳ Project development map showcases a sample of upcoming projects only, due to accuracy of addresses provided by the data provider for geocoding purposes.
£ Projects refers to the top developments within the postcode of 4680.
µ Estimated value is the value of construction costs provided by relevant data authority, it does not reflect the project’s sale/commercial value.
ψ Commencement date quoted for each project is an approximate only, as provided by the relevant data authority, PRD does not hold any liability to the exact date.
Source: APM Pricefinder, Cordell Connect database, SQM Research, Esri ArcGIS.
Disclaimer: PRD does not give any warranty in relation to the accuracy of the information contained in this report. If you intend to rely upon the information contained herein, you must take note that the information, figures and projections have been provided by various sources and have not been verified by us. We have no belief one way or the other in relation to the accuracy of such information, figures and projections. PRD will not be liable for any loss or damage resulting from any statement, figure, calculation or any other information that you rely upon that is contained in the material.
Prepared by PRD Research. © All medians and volumes are calculated by PRD Research. Use with written permission only. All other responsibilities disclaimed. © Copyright PRD 2025.