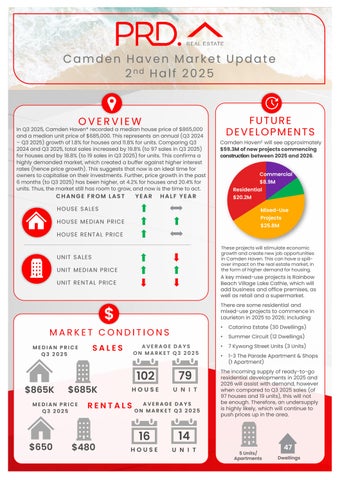

Camden Haven Market Update 2nd Half 2025

In Q3 2025, Camden Haven* recorded a median house price of $865,000 and a median unit price of $685,000.This represents an annual (Q3 2024 – Q3 2025)growth of 1.8% for houses and 11.8%for units. Comparing Q3 2024and Q3 2025,total sales increased by 19.8%(to 97 sales in Q3 2025) for houses and by 18.8%(to 19 sales in Q3 2025)for units. This confirms a highly demanded market, which created a buffer against higher interest rates (hence price growth). This suggests that now is an ideal time for owners tocapitalise on their investments. Further, price growth in the past 6 months (to Q3 2025)has been higher, at 4.2%for houses and 20.4%for units Thus,the market still has room to grow, and now is the time to act.
FROM LAST

MEDIAN PRICE HOUSE RENTAL PRICE


Camden Haven£ will see approximately $59.3Mofnewprojectscommencing constructionbetween2025and2026


MEDIAN PRICE Q3 2025 MEDIAN PRICE Q3 2025
AVERAGE DAYS ON MARKET Q3 2025
102
$865K $685K
79
AVERAGE DAYS ON MARKET Q3 2025


These projectswill stimulate economic growthandcreatenew jobopportunities in CamdenHaven.This can havea spilloverimpacton the real estatemarket,in the form of higher demandfor housing.
A key mixed-use projects is Rainbow Beach Village Lake Cathie, which will add business and office premises, as well as retail and a supermarket.
There are some residential and mixed-use projects to commence in Laurieton in 2025to 2026; including
• Catarina Estate (30 Dwellings)
• Summer Circuit (12 Dwellings)
• 7 Kywong Street Units (3 Units)
• 1-3 The Parade Apartment & Shops (1 Apartment)
The incoming supply of ready-to-go residential developments in 2025and 2026 will assist with demand, however when compared toQ3 2025sales (of 97houses and 19units), this will not be enough. Therefore, an undersupply is highly likely, which will continue to push prices up in the area.


AVERAGE VENDOR DISCOUNT*
Average vendor discount reflects the average percentage difference between the first list price and final sold price. A lower percentage difference (closer to 0.0%) suggests that buyers are willing to purchase close to the first asking price of a property.


Average vendor discounts between Q3 2024and Q3 2025 have tightened slightly, toa lesser discounts of -5.2% and2.0% for houses and units, respectively. Buyers canstill benefit from discounts in the Camden Haven*, as sellers are willing to accept below the first list price. However, unit buyers must act fast to secure a discount, as the room for negotiation is quite small in Q3 2025(i.e closer to zero).
The suburb of Laurieton provides a more affordable house and unit median prices than the wider Port MacquarieHastings Local Government Area (LGA) for the past 5 years. This continued tobe the case in 2025#for houses. However, the unit market price growth in Laurieton have established it as premium market thanthe wider LGA.
Most of the homes sold in Camden Haven* across 2025# were split between the more premium price bracket of $1,000,000and above (27.8%) and the affordable price point, of less than $699,999(24.3%). Conversely, units had most sales (30.8%) in the middle price bracket, however showed strong sales numbers in the affordable middle price bracket of $500,000 - $599,999(20.0%). This indicates there is a home for every budget in Camden Haven*.
MARKET COMPARISON
The market comparison graph provides a comparative trend for median price of houses and units over the past 5 years. The main LGA chosen was based on their proximity to the main suburb analysed, which is Laurieton.


PRICE BREAKDOWN 2025#


RENTAL GROWTH 2025€
House rental yield in Camden Haven¥ were 3.7% as of September 2025, above the Port MacquarieHastings LGA (3.2%) and Sydney Metro (2.7%). Further, median house rental price increased by 0.8% in the past 12 months to Q3 2025,at $650 per week. In the same timeframe the number of houses rented decreased, by -18.9% (to 43 houses) in Q3 2025; suggesting an undersupply. This indicates a highly demanded and competitive house rental market in Camden Haven¥, which is beneficial to investors; especially those looking for a more affordable option to Sydney Metro.
2-bedroom houses have provided investors with +9.9% rental growth annually, achieving a median rent of $522 per week.
The Camden Haven area¥ recorded a vacancy rate of 0.7% in September 2025,far below Sydney Metro’s 1.3% vacancy rate average. Vacancy rates fluctuated in the past 12 months but overall showed an increasing pattern, due to more investors in the market. That said, a 0.7% vacancy rate is significantly below the Real Estate Institution of Australia’s healthy benchmark of 3.0%. This is good news for investors, as it indicates quicker occupancy of rental homes in Camden Haven¥
RENTAL VACANCY RATES 2025

Laurieton (2443) Port Macquarie-Hastings LGA

Sydney Metro REIA 'Healthy' Benchmark
RENTAL YIELD 2025§
Camden Haven (2443)¥

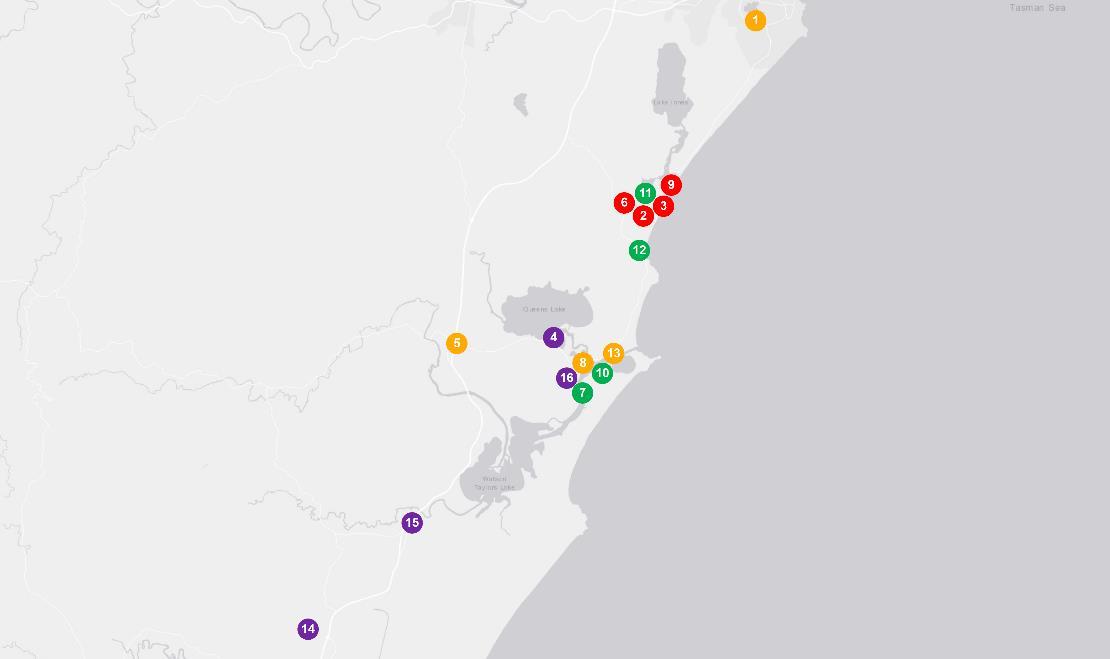
PROJECT DEVELOPMENT MAP 2025-2026 ₳


RESEARCH SERVICES
Our research services span over every suburb, LGA,and state within Australia; captured in a variety of standard and customised products, andinclude:
• Advisory and consultancy
• Market analysis including profiling and trends
• Primary qualitative and quantitative research
• Demographic and target market analysis
• Geographic information mapping
• Project analysis including product and pricing recommendations
• Rental and investment return analysis


OUR KNOWLEDGE
Access to accurate and objective research is the foundation of all good property decisions.
OUR PEOPLE
Our research team is made up of highly qualified researchers who focus solely on propertyanalysis.


REFERENCES
* Camden Haven sales market data and key indicators encapsulates aggregate property market conditions within the suburbs of 2439, 2443, and 2445.
** Estimated values are based on construction value provided by the relevant data authority and does not reflect commercial and/or re-sale value.
# 2025 encapsulates sales transactions for the first three quarters of 2025 only (01/01/2025 – 30/09/2025).
€ Annual rental growth is a comparison between Q3 2024 (01/07/2024 – 30/09/2024)and Q3 2025 (01/07/2025 – 30/09/2025) house median rent figures.
¥ Camden Haven rental market data encapsulates aggregate property conditions within the postcode of 2443.
§ Rental yields shown are as reported as of September 2025.
₳ Project development map showcases a sample of upcoming projects only, due to accuracy of addresses provided by the data provider for geocoding purposes.
£ Projects refers to the top developments within the suburbs of 2439, 2443, and 2445.
µ Estimated value is the value of construction costs provided by relevant data authority, it does not reflect the project’s sale/commercial value.
ψ Commencement date quoted for each project is an approximate only, as provided by the relevant data authority, PRD does not hold any liability to the exact date.
Source: APM Pricefinder, Cordell Connect database, SQM Research, Esri ArcGIS.
Disclaimer: PRD does not give any warranty in relation to the accuracy of the information contained in this report. If you intend to rely upon the information contained herein, you must take note that the information, figures and projections have been provided by various sources and have not been verified by us. We have no belief one way or the other in relation to the accuracy of such information, figures and projections. PRD will not be liable for any loss or damage resulting from any statement, figure, calculation or any other information that you rely upon that is contained in the material.
Prepared by PRD Research. © All medians and volumes are calculated by PRD Research. Use with written permission only. All other responsibilities disclaimed. © Copyright PRD 2025.