
Penrith Market Update 2nd Half 2025

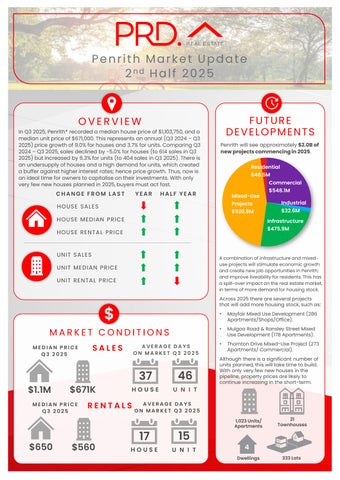
In Q3 2025,Penrith* recorded a median house price of $1,103,750,and a median unit price of $671,000.This represents anannual (Q3 2024 – Q3 2025)price growth of 9.0%for houses and 3.7% forunits. Comparing Q3 2024– Q3 2025,sales declined by -5.0% for houses (to 614 sales in Q3 2025)but increased by 6.3% for units (to 404 sales in Q3 2025). There is an undersupply of houses and a high demand forunits, which created a buffer against higher interest rates; hence price growth Thus, now is an ideal time forowners to capitalise on their investments. With only very few new houses planned in 2025,buyers must act fast.


PRICE Q3 2025


Penrith will see approximately$2.0Bof newprojectscommencingin2025
$1.1M $671K
Q3 2025
AVERAGE DAYS ON MARKET Q3 2025
AVERAGE DAYS ON MARKET Q3 2025


Acombination of infrastructureandmixeduseprojectswill stimulate economicgrowth andcreatenew jobopportunitiesin Penrith; andimprove liveability for residents.This has aspill-over impacton the real estatemarket, in terms of more demandfor housingstock. Across2025 there are severalprojects that will addmore housing stock,such as:
• Mayfair Mixed UseDevelopment (286 Apartments/Shops/Office).
• Mulgoa Road &Ransley Street Mixed UseDevelopment (178 Apartments).
• Thornton Drive Mixed-Use Project(273 Apartments/ Commercial).
Although there is asignificant number of units planned, this will taketime to build. With only veryfew new houses in the pipeline, property prices arelikely to continue increasing in the short-term.


AVERAGE VENDOR DISCOUNT*
Average vendor discount reflects the average percentage difference between the first list price and final sold price. A lower percentage difference (closer to 0.0%) suggests that buyers are willing to purchase close to the first asking price of a property.


$1,200,000
$1,000,000
In the past 12months to Q3 2025average vendor discounts have tightened, to a lesser discount of -0.7% for houses and -2.7% for units. Market conditions inPenrith* continue to favourbuyers, as sellers are willing toaccept below the first listed price. That said, with average vendor discounts continuing to tighten and Q3 2025recording the tightest discount in the past 24 months, buyers need to act fast.
The suburb of Penrith has historically performed onpar with the wider Penrith Local Government Area (LGA), but more so for houses; whilst units have trended slightly more affordable. In 2025# this trend has continued, with the unit market providing more opportunities for buyers.
Most of the homes sold in Penrith* in 2025# were in the premium price point of $1,200,000and above (30.4%). This benefits owners wishing to capitalise on their investments. Most of the units sold were in the medium price point of $600,000to$699,999(24.6%), with the premium market of $800,000+gaining traction (19.6%). Affordable units of less than $499,999are available (19.9%), as is houses less than $899,999(13.2%); however, this tends to be older stock Overall, there is a home for every budget in Penrith*.
MARKET COMPARISON
The market comparison graph provides a comparative trend for the median price of houses and units over the past 5 years. The main LGA profiled was chosen based on their proximity to the main suburb analysed, which is Penrith.


Less than $499,999 $500,000 to $599,999 $600,000 to $699,999 $700,000 to $799,999 $800,000 and above
Penrith (2750) House
Penrith LGA House Penrith (2750) Unit Penrith LGA Unit
RENTAL GROWTH 2025€
House rental yields in Penrith¥ was 2.9%in September 2025, slightly higher than Sydney Metro (2.7%). This was paired with a 4.8% increase in median house rent price in the past 12months to Q3 2025,at $650per week. The number of houses rented increased by 5.9% in the past 12 months, to 233rentals in Q3 2025. A similar pattern, of higher rents butmore properties rented, can be seen in the unit market. This suggests a highly demanded rental market, in good news for investors looking for a more affordable option toSydney Metro.
3-bedroom houses have provided investors with +5.0% rental growth annually, achieving a median rent of $630per week.
Penrith¥ recorded a vacancy rate of 0.6% in September 2025,lower than Penrith LGA’s and Sydney Metro’s* (both 1.3%). Vacancy rates in Penrith¥ remained low in the past 12 months, below 1.0%. signalling a tight rental market. Further, a 0.6% vacancy rate is well below the Real Estate Institution of Australia’s benchmark of 3.0%,thus quicker occupancyof rental homes. This creates a conducive environment for investors, even with a higher entry price in Q3 2025.
RENTAL VACANCY RATES 2025

RENTAL YIELD 2025§

Penrith (2750)
Penrith LGA
Sydney Metro

RESEARCH SERVICES
Our research services span over every suburb, LGA,and state within Australia; captured in a variety of standard and customised products, andinclude:
• Advisory and consultancy
• Market analysis including profiling and trends
• Primary qualitative and quantitative research
• Demographic and target market analysis
• Geographic information mapping
• Project analysis including product and pricing recommendations
• Rental and investment return analysis
OUR KNOWLEDGE
Access to accurate and objective research is the foundation of all good property decisions.
OUR PEOPLE
Our research team is made up of highly qualified researchers who focus solely on propertyanalysis.


REFERENCES
* Penrith sales market data and key indicators encapsulates aggregate property market conditions within the Penrith LGA
** Estimated values are based on construction value provided by the relevant data authority and does not reflect commercial and/or re-sale value.
# 2025 encapsulates sales transactions for Q1 – Q3 2025 (01/01/2025 – 30/09/2025) only, other years encapsulates sales transactions for the full year (i.e 01/01 to 31/12 of the relevant year).
€ Annual rental growth is a comparison between Q3 2024 (01/07/2024 – 30/09/2024)and Q3 2025 (01/07/2025 – 30/09/2025) house median rent figures.
¥ Penrith rental market data encapsulates aggregate property conditions within the postcode of 2750.
§ Rental yields shown are as reported as of September 2025.
₳ Project development map showcases a sample of upcoming projects only, due to accuracy of addresses provided by the data provider for geocoding purposes.
£ Projects refers to the top developments within the Penrith LGA.
µ Estimated value is the value of construction costs provided by relevant data authority, it does not reflect the project’s sale/commercial value.
ψ Commencement date quoted for each project is an approximate only, as provided by the relevant data authority, PRD does not hold any liability to the exact date.
Source: APM Pricefinder, Cordell Connect database, SQM Research, Esri ArcGIS.
Disclaimer: PRD does not give any warranty in relation to the accuracy of the information contained in this report. If you intend to rely upon the information contained herein, you must take note that the information, figures and projections have been provided by various sources and have not been verified by us. We have no belief one way or the other in relation to the accuracy of such information, figures and projections. PRD will not be liable for any loss or damage resulting from any statement, figure, calculation or any other information that you rely upon that is contained in the material.
Prepared by PRD Research. © All medians and volumes are calculated by PRD Research. Use with written permission only. All other responsibilities disclaimed. © Copyright PRD 2025.