
Caboolture Market Update 2nd Half 2025

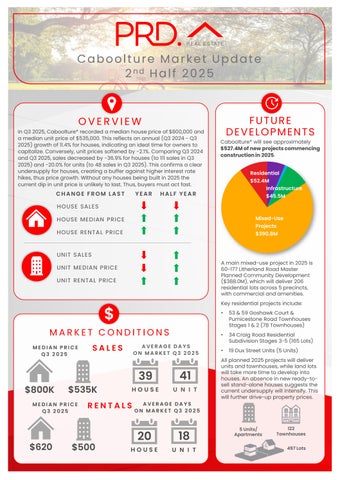
In Q3 2025, Caboolture* recorded a median house price of $800,000and a median unit price of $535,000.This reflects an annual (Q3 2024- Q3 2025)growth of 11.4% for houses, indicating an ideal time for owners to capitalize. Conversely, unit prices softened by -2.1% Comparing Q3 2024 and Q3 2025,sales decreased by -36.9%for houses (to 111 sales in Q3 2025)and -20.0% for units (to 48 sales in Q3 2025). This confirms a clear undersupply for houses, creating a buffer against higher interest rate hikes, thus price growth. Without any houses being built in 2025the current dip in unit price is unlikely to last. Thus, buyers must act fast.


Caboolture* will see approximately $527.4Mofnewprojectscommencing constructionin2025
HOUSE SALES YEAR HALF YEAR
FROM LAST HOUSE MEDIAN PRICE HOUSE RENTAL PRICE
RENTAL PRICE

MEDIAN PRICE Q3 2025
$800K $535K
MEDIAN PRICE Q3 2025
AVERAGE DAYS ON MARKET Q3 2025
39
AVERAGE DAYS ON MARKET Q3 2025


A main mixed-use project in 2025 is 60-177 Litherland Road Master Planned Community Development ($388.0M), which will deliver 206 residential lots across 5precincts, with commercial and amenities.
Key residential projects include:
• 53 & 59 Goshawk Court & Pumicestone Road Townhouses Stages 1 & 2(78 Townhouses)
• 34Craig Road Residential Subdivision Stages 3-5 (165 Lots)
• 19 Dux Street Units (5 Units)
All planned 2025projects will deliver units and townhouses, while land lots will take more time to develop into houses. An absence in new ready-tosell stand-alone houses suggests the current undersupply will intensify. This will further drive-up property prices.


AVERAGE VENDOR DISCOUNT*
Average vendor discount reflects the average percentage difference between the first list price and final sold price. A lower percentage difference (closer to 0.0%) suggests that buyers are willing to purchase close to the first asking price of a property.


Average vendor discounts haveremained at a premium in the past 12 months to Q3 2025,of 1.6% for both houses and units. The Caboolture* market continues to favor sellers, with buyers having to offer above the first listed prices. A premium is notunusual in the Caboolture* market, but without any new houses planned for 2025 the likelihood of this increasing is high. Thus, buyers must act fast.
The suburb of Caboolture has historically provided a more affordable market than the wider Moreton Bay LGA in both house and unit median prices. 2025# saw this continue, with property prices in the suburb and LGA increasing.
The dominant proportion of homes sold inCaboolture* across 2025# were in the middle-price bracket between $750,000to $849,999forhouses (31.9%) and $450,000to $549,999for units (25.9%). Thatsaid, the premium market remain strong, with 25.4% of houses sold above $950,000 and 19.0% of units sold above $650,000, benefiting owners. The most affordable prices range were also available, with 5.9% of houses sold below $649,999and 16.3% of units sold below $349,999,in good news forfirst home buyers. Overall, Caboolture* offers homes for every budget.
MARKET COMPARISON
Caboolture (4510) House
Caboolture (4510) Unit
Moreton Bay LGA House
Moreton Bay LGA Unit
The market comparison graph provides a comparative trend for the median price of houses and unit over the past 5 years. The LGA profiled are chosen based on their proximity to the main suburb analysed, which is Caboolture.


PRICE BREAKDOWN 2025 #
SOLD


than $349,999
$350,000 to $449,999
$450,000 to $549,999
$550,000 to $649,999 $650,000 and above
RENTAL GROWTH 2025€
House rental yield in Caboolture¥ was 3.8% in September 2025, higher than Moreton Bay LGA (3.5%) and Brisbane Metro (3.1%). This is paired with a 6.9% growth in median house rental price in the past 12 months to Q3 2025,at $620per week; along with a -12.8% decrease in the number of houses rented (to 259rentals in Q3 2025). There is an undersupplied house rental market, ideal for investors looking for a more affordable option thanBrisbane Metro.
3- bedroom houses have provided investors with +7.8%rental growth annually, achieving a median rent of $550per week.
Caboolture¥ recorded a vacancy rate of 0.9%in September 2025, slightly above Moreton Bay’s average of 0.7% but below Brisbane Metro’s 1.0% average. Vacancy rates in Caboolture¥ remained stable in the past 12 months, indicating a resilient rental market. Further, a 0.9% vacancy rate is well below the Real Estate Institute of Australia’s healthy benchmark of 3.0%, which suggests quicker occupancy of rental properties. This creates a conducive and sustainable investment environment for investors, even with a higher entry price in Q3 2025.
RENTAL VACANCY RATES 2025


Caboolture (4510)
PROJECT DEVELOPMENT MAP 2025
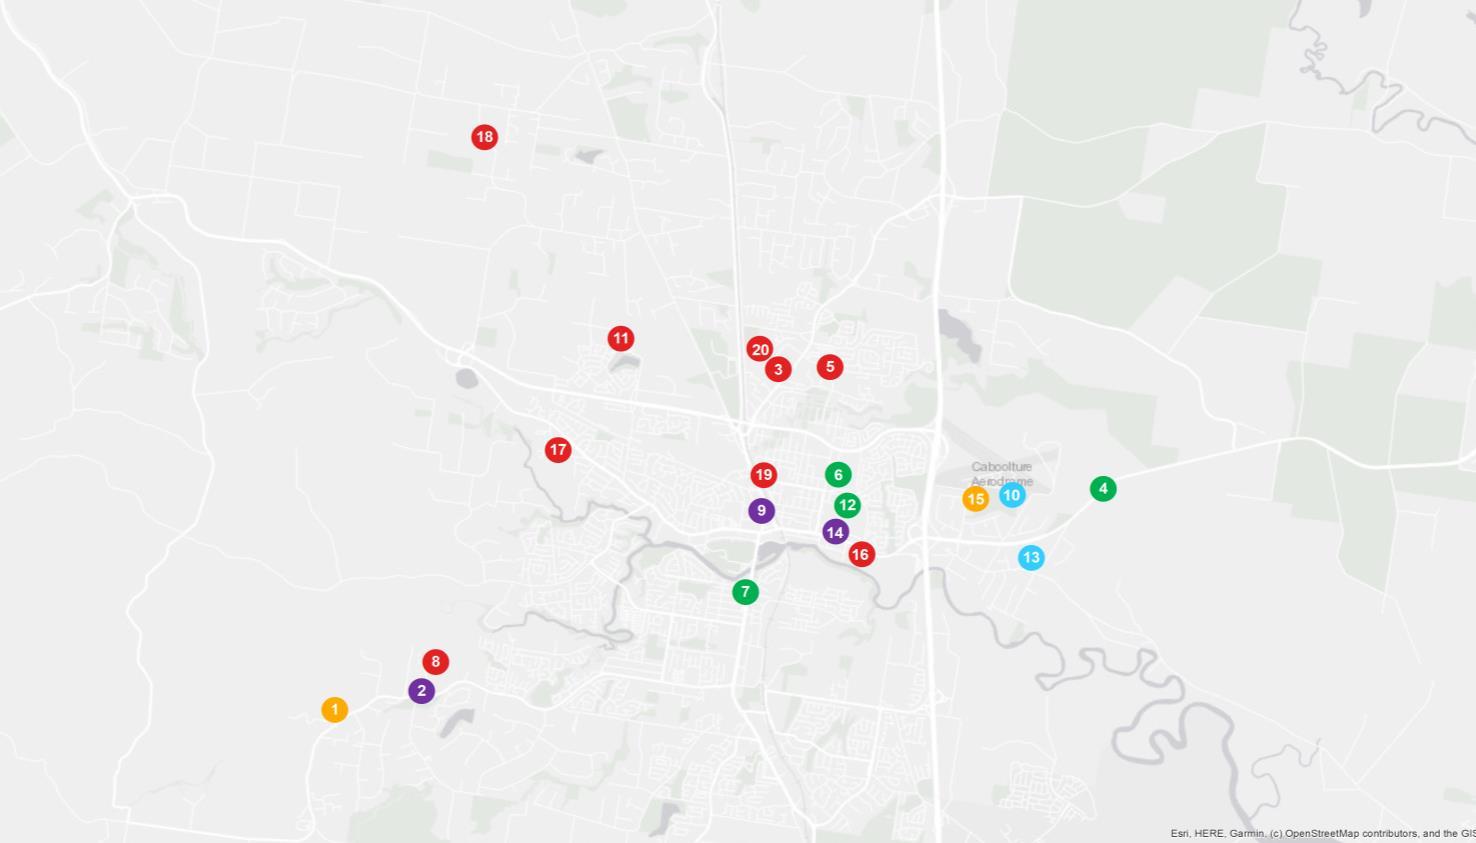

CABOOLTURE


RESEARCH SERVICES
Our research services span over every suburb, LGA,and state within Australia; captured in a variety of standard and customised products, andinclude:
• Advisory and consultancy
• Market analysis including profiling and trends
• Primary qualitative and quantitative research
• Demographic and target market analysis
• Geographic information mapping
• Project analysis including product and pricing recommendations
• Rental and investment return analysis
OUR KNOWLEDGE
Access to accurate and objective research is the foundation of all good property decisions.
OUR PEOPLE
Our research team is made up of highly qualified researchers who focus solely on propertyanalysis.


REFERENCES
* Caboolture sales market data and key indicators encapsulates aggregate property market conditions within the suburb of Caboolture.
** Estimated values are based on construction value provided by the relevant data authority and does not reflect commercial and/or re-sale value.
# 2025 encapsulates sales transactions for Q1 – Q3 (01/01/2025 – 30/09/2025) only, other years encapsulates sales transactions for the full year (i.e 01/01 to 31/12 of the relevant year).
€ Annual rental growth is a comparison between Q3 2024 (01/07/2024 – 30/09/2024)and Q3 2025 (01/07/2025 – 30/09/2025) house median rent figures.
¥ Caboolture rental market data encapsulates aggregate property conditions within the postcode of 4510.
§ Rental yields shown are as reported as of September 2025.
₳ Project development map showcases a sample of upcoming projects only, due to accuracy of addresses provided by the data provider for geocoding purposes.
£ Projects refers to the top developments within the suburb of Caboolture.
µ Estimated value is the value of construction costs provided by relevant data authority, it does not reflect the project’s sale/commercial value.
ψ Commencement date quoted for each project is an approximate only, as provided by the relevant data authority, PRD does not hold any liability to the exact date.
Source: APM Pricefinder, Cordell Connect database, SQM Research, Esri ArcGIS.
Disclaimer: PRD does not give any warranty in relation to the accuracy of the information contained in this report. If you intend to rely upon the information contained herein, you must take note that the information, figures and projections have been provided by various sources and have not been verified by us. We have no belief one way or the other in relation to the accuracy of such information, figures and projections. PRD will not be liable for any loss or damage resulting from any statement, figure, calculation or any other information that you rely upon that is contained in the material.
Prepared by PRD Research. © All medians and volumes are calculated by PRD Research. Use with written permission only. All other responsibilities disclaimed. © Copyright PRD 2025.