
Liverpool Market Update 2nd Half 2025

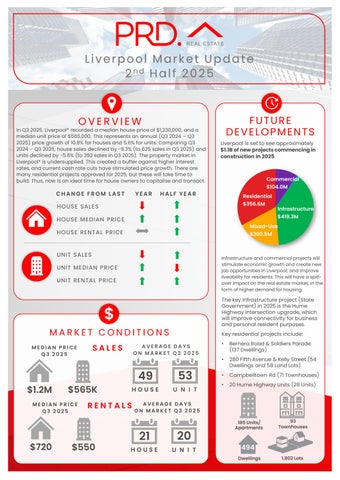
In Q3 2025, Liverpool* recorded a median house price of $1,230,000, and a median unit price of $565,000. This represents an annual (Q3 2024 – Q3 2025) price growth of 10.8% for houses and 5.6% for units. Comparing Q3 2024 – Q3 2025, house sales declined by -9.3% (to 625 sales in Q3 2025) and units declined by -5.6% (to 352 sales in Q3 2025). The property market in Liverpool* is undersupplied. This created a buffer against higher interest rates, and current cash rate cuts have stimulated price growth. There are many residential projects approved for 2025, but these will take time to build. Thus, now is an ideal time for house owners to capitaliseand transact.
FROM LAST


Liverpool is set tosee approximately $1.1Bofnewprojectscommencingin constructionin2025
SALES
MEDIAN PRICE
RENTAL PRICE
HALF YEAR


PRICE
RENTAL PRICE

MEDIAN PRICE Q3 2025 MEDIAN PRICE Q3 2025
AVERAGE DAYS ON MARKET Q3 2025
49 $1.2M $565K
AVERAGE DAYS ON MARKET Q3 2025


Infrastructureandcommercialprojectswill stimulate economicgrowthandcreate new jobopportunitiesin Liverpool; andimprove liveability for residents.This will havea spilloverimpactonthe real estatemarket,in the form of higher demandfor housing.
The key Infrastructure project (State Government) in 2025is the Hume Highway Intersection upgrade, which will improve connectivity for business and personal resident purposes.
Key residential projects include:
• Bernera Road & Soldiers Parade (137Dwellings)
• 280Fifth Avenue & Kelly Street (54 Dwellings and 58Land Lots)
• Campbelltown Rd (71Townhouses)
• 20Hume Highway Units (28 Units)


AVERAGE VENDOR DISCOUNT*
Average vendor discount reflects the average percentage difference between the first list price and final sold price. A lower percentage difference (closer to 0.0%) suggests that buyers are willing to purchase close to the first asking price of a property.


In the past 12months to Q3 2025average vendor discounts have tightened toa lesser discount for houses and units, of -0.3% and -3.8% respectively. Property market conditions in Liverpool* continue tofavour buyers, where vendors are willing to accept below the first list price. That said, in the past 6 months there is a trend towards a tighter discount, which suggests a shift towards a seller’s market. The time to access a discount is limited, and buyers must act fast.
The suburb of Liverpool has historically tracked on par with the wider Liverpool Local Government Area (LGA) in both house and unit median prices. This has continued in 2025#; with the suburb tracking slightly higher prices for houses, but slightly lower for units when compared to the LGA.
The dominant proportion of homes sold in Liverpool* in 2025# were in the premium price point of $1,250,000and above (41.8%). In contrast, most of the units sold were in the most affordable price point of less than $449,999(26.3%). Despite price growth in Liverpool*, there is still affordable priced stock, which is good news for buyers. Owners canbe confident in their investment, as 41.8%of houses and 24.7% of units sold were in the premium priced market.
MARKET COMPARISON
The market comparison graph provides a comparative trend for the median price of houses and units over the past 5 years. The main LGA profiled was chosen based on their proximity to the main suburb analysed, which is Liverpool.


than $449,999
$450,000 to $549,999 $550,000 to $649,999 $650,000 to $749,999 $750,000 and above
RENTAL GROWTH 2025€
House rental yields in Liverpool ¥ was 3.1% in September 2025,higher than the Liverpool LGA (2.8%) and Sydney Metro (2.7%). This was paired with a stable median house rental price in the past 12months to Q3 2025,at$720per week. During this time, the number ofhouses rented grew by 13.0%, to366 rentals in Q32025. The pattern of stable median rental price and more properties rented is also seen in the unit rental market. Combined, this will benefit investors.
2-bedroom houses have provided investors with +5.0% rental growth annually, achieving a median rent of $525per week.
Liverpool¥ recorded a vacancy rate of 1.2% in September 2025,slightly above Liverpool LGA’s 0.9%average, but below Sydney Metro’s 1.3%average. Vacancy rates in Liverpool¥ increased slightly in the past 12months, due to investors re-entering the market. However, a 1.2% vacancy rate is well below the Real Estate Institution of Australia’s healthy benchmark of 3.0%, which suggests quicker occupancy of rental homes in Liverpool¥. This creates an attractive and sustainable investment environment for investors, even with a higher entry price in Q3 2025.
RENTAL VACANCY RATES 2025


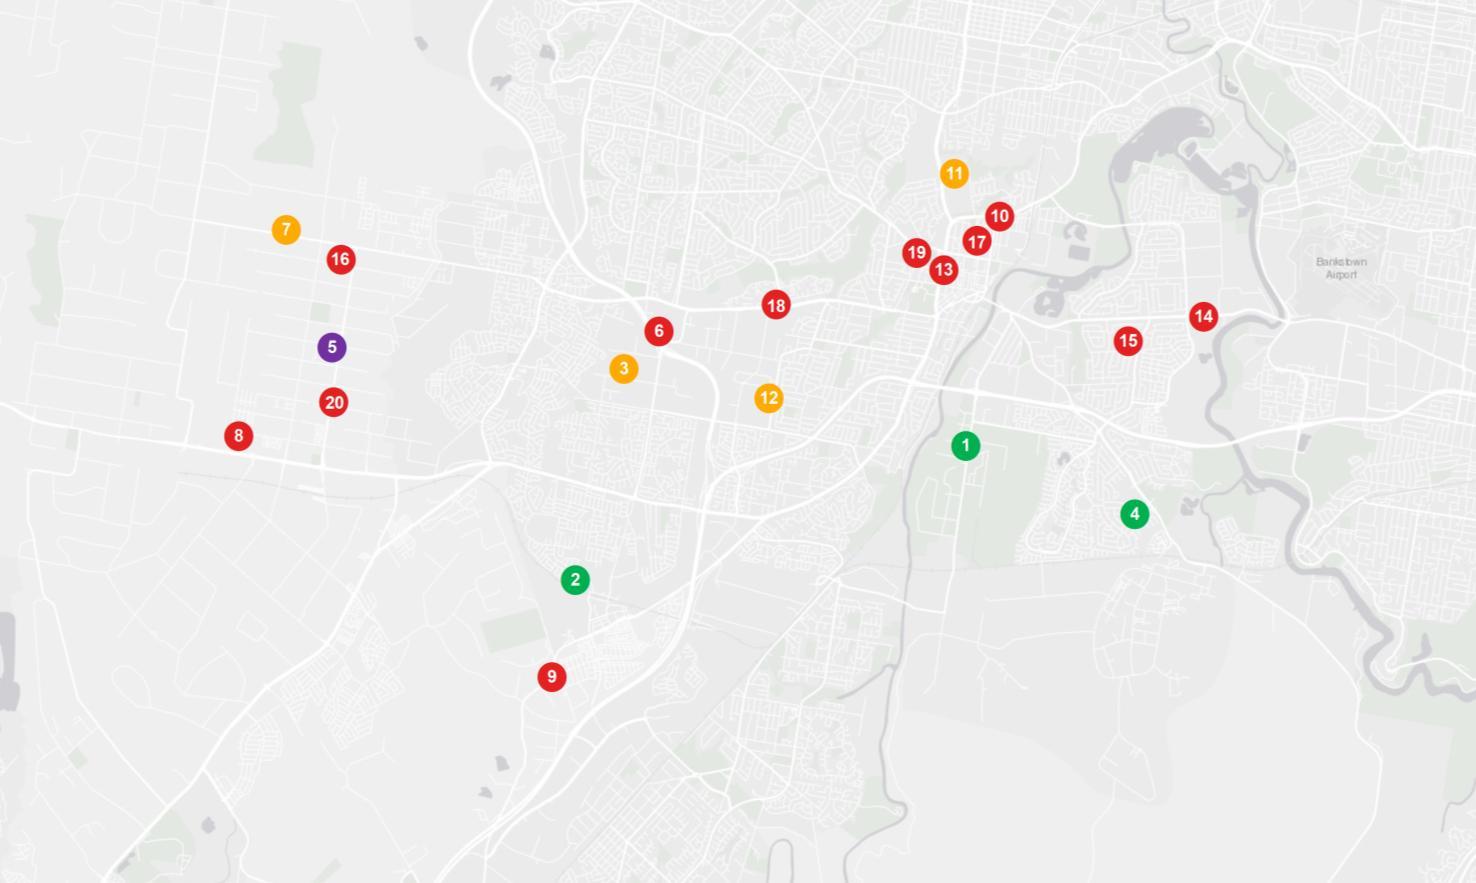
PROJECT DEVELOPMENTS 2025 ₳
LIVERPOOL


RESEARCH SERVICES
Our research services span over every suburb, LGA,and state within Australia; captured in a variety of standard and customised products, andinclude:
• Advisory and consultancy
• Market analysis including profiling and trends
• Primary qualitative and quantitative research
• Demographic and target market analysis
• Geographic information mapping
• Project analysis including product and pricing recommendations
• Rental and investment return analysis
OUR KNOWLEDGE
Access to accurate and objective research is the foundation of all good property decisions.
OUR PEOPLE
Our research team is made up of highly qualified researchers who focus solely on propertyanalysis.
COMMUNITY & EXCELLENCE
PRD Real Estate Liverpool stands as a proud and thriving family-run business, independently owned and operated since 1962

Our reputation is built upon a proud heritage of fostering sustained growth and profitability for our vendors and landlords. We are dedicated to cultivating mutually beneficial relationships with our clients and continuously enhancing customer satisfaction by delivering quality and efficient services.
Specialising in all aspects of real estate, including residential and commercial sales, as well as residential and commercial property management and investment, we offer personalised and proficient industry expertise. Our goal is to consistently surpass our clients' expectations and achieve exceptional outcomes.


REFERENCES
* Liverpool sales market data and key indicators encapsulates aggregate property market conditions within the suburbs of Liverpool LGA
** Estimated values are based on construction value provided by the relevant data authority and does not reflect commercial and/or re-sale value.
# 2025 encapsulates sales transactions for Q1 - Q3 (01/01/2025– 30/09/2025)only, other years encapsulates sales transactions for the full year (i.e 01/01 to 31/12 of the relevant year).
€ Annual rental growth is a comparison between Q3 2024 (01/07/2024 – 30/09/2024)and Q3 2025 (01/07/2025 – 30/09/2025) house median rent figures.
¥ Liverpool rental market data encapsulates aggregate property conditions within the postcode of 2170.
§ Rental yields shown are as reported as of September 2025.
₳ Project development map showcases a sample of upcoming projects only, due to accuracy of addresses provided by the data provider for geocoding purposes.
£ Projects refers to the top developments within the Liverpool LGA
µ Estimated value is the value of construction costs provided by relevant data authority, it does not reflect the project’s sale/commercial value.
ψ Commencement date quoted for each project is an approximate only, as provided by the relevant data authority, PRD does not hold any liability to the exact date.
Source: APM Pricefinder, Cordell Connect database, SQM Research, Esri ArcGIS.
Disclaimer: PRD does not give any warranty in relation to the accuracy of the information contained in this report. If you intend to rely upon the information contained herein, you must take note that the information, figures and projections have been provided by various sources and have not been verified by us. We have no belief one way or the other in relation to the accuracy of such information, figures and projections. PRD will not be liable for any loss or damage resulting from any statement, figure, calculation or any other information that you rely upon that is contained in the material.
Prepared by PRD Research. © All medians and volumes are calculated by PRD Research. Use with written permission only. All other responsibilities disclaimed. © Copyright PRD 2025.