
Lismore Market Update 2nd Half 2025


HOUSE SALES YEAR HALF YEAR CHANGE FROM LAST HOUSE MEDIAN PRICE
HOUSE RENTAL PRICE
SALES
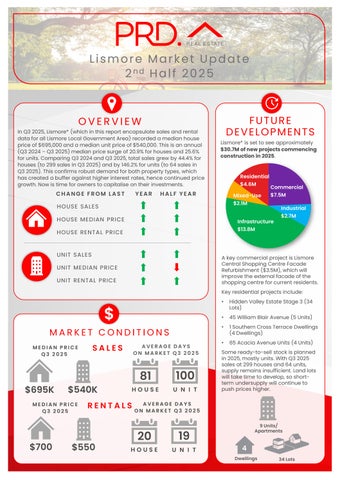
In Q3 2025, Lismore* (which in this report encapsulate sales and rental data for all Lismore Local Government Area) recorded a median house price of $695,000and a median unit price of$540,000. This is an annual (Q3 2024– Q3 2025)median price surge of 20.9%for houses and 25.6% for units. Comparing Q32024and Q3 2025, total sales grew by 44.4%for houses (to 299sales in Q3 2025)and by 146.2%for units (to 64sales in Q3 2025). This confirms robust demand for bothproperty types, which has created a buffer against higher interest rates, hence continued price growth. Now is time for owners to capitalise ontheir investments. 81 $695K $540K
PRICE
RENTAL PRICE

MEDIAN PRICE Q3 2025
AVERAGE DAYS ON MARKET Q3 2025
Lismore* is set to see approximately $30.7Mofnewprojectscommencing constructionin2025
MEDIAN PRICE Q3 2025
AVERAGE DAYS ON MARKET Q3 2025


A key commercial project is Lismore Central Shopping Centre Facade Refurbishment ($3.5M), which will improve the external facade of the shopping centre for current residents.
Key residential projects include:
• Hidden Valley Estate Stage 3 (34 Lots)
• 45 William Blair Avenue (5 Units)
• 1 Southern Cross Terrace Dwellings (4 Dwellings)
• 65 Acacia Avenue Units (4 Units)
Some ready-to-sell stock is planned in 2025, mostly units. With Q3 2025 sales at 299houses and 64 units, supply remains insufficient. Land lots will take time to develop, so shortterm undersupply will continue to push prices higher.


AVERAGE VENDOR DISCOUNT*
Average vendor discount reflects the average percentage difference between the first list price and final sold price. A lower percentage difference (closer to 0.0%) suggests that buyers are willing to purchase close to the first asking price of a property.


Average vendor discounts between Q3 2024and Q3 2025 have tightened to -4.1% forhouses and -2.5% for units. Market conditions in Lismore* continue to favourbuyers, as sellers are still accepting below the initial listing prices. That said, the peak discount forboth property types has passed (in Q3 2024), and a tighter discount in Q3 2025suggest a shifting market, more towards sellers. With little new stock in the pipeline for 2025,first home buyers need to actfast.
The wider Lismore City Council Local Government Area has historically provided a premium market compared to the suburb of Lismore, in bothhouse and unit median prices. 2025# saw this trend continue, especially for units.
In 2025#, 33.0%of houses sold in Lismore* were in the most affordable price bracket of less than $549,999. However, this is possibly heavily skewed due to flooded properties and/orgovernment buy-backs. Most of the units were sold in the middle-range price bracket between $500,000to $599,999(27.6%). On the flip side, the premium market is gaining more traction, with 28.3%of houses sold above $850,000and 12.1% of units sold above $700,000. This is beneficial forowners looking to secure their investment.
MARKET COMPARISON
Lismore (2480) House Lismore City Council LGA House Lismore (2480) Unit Lismore City Council LGA Unit
The market comparison graph providesa comparative trend of median houses and units prices over the past 5 years. The main LGA profiled is chosen due to theirproximity to the main suburb analysed, which is Lismore.


PRICE BREAKDOWN 2025 #


Less than $399,999
$400,000 to $499,999
$500,000 to $599,999
$600,000 to $699,999
$700,000 and above
RENTAL GROWTH 2025€
House rental yield in Lismore¥ was 4.0%as of September 2025,higher thanLismore City LGA (3.5%) and Sydney Metro (2.7%). This was paired with a 6.1%increase in median house rental price in the past 12 months to Q3 2025,at $700per week, along with a -20.4% decrease in the number of houses rented (to 304rentals in Q3 2025). The same pattern also can be seen in the unit market. This indicates a rental undersupply in Lismore¥ , in good news for investors.
4+ bedroom houses have provided investors with +10.4% rental growth annually, achieving a median rent of $850per week.
Lismore¥ recorded a vacancy rate of 0.5% in September 2025, below the Lismore City LGA’s 1.4% and Sydney Metro’s 1.3%. Vacancy rates have decreased slightly in the last 12months, indicating an even tighter rental market. Further, a 0.5% vacancy rate is significantly below the Real Estate Institute of Australia’s healthy benchmark of 3.0%, which suggests quicker occupancy of rental homes. This confirms a conducive environment for investors, even with a higher house and unit sales price (thus entry price) in the past 12 months to Q3 2025.
RENTAL VACANCY RATES 2025


Lismore
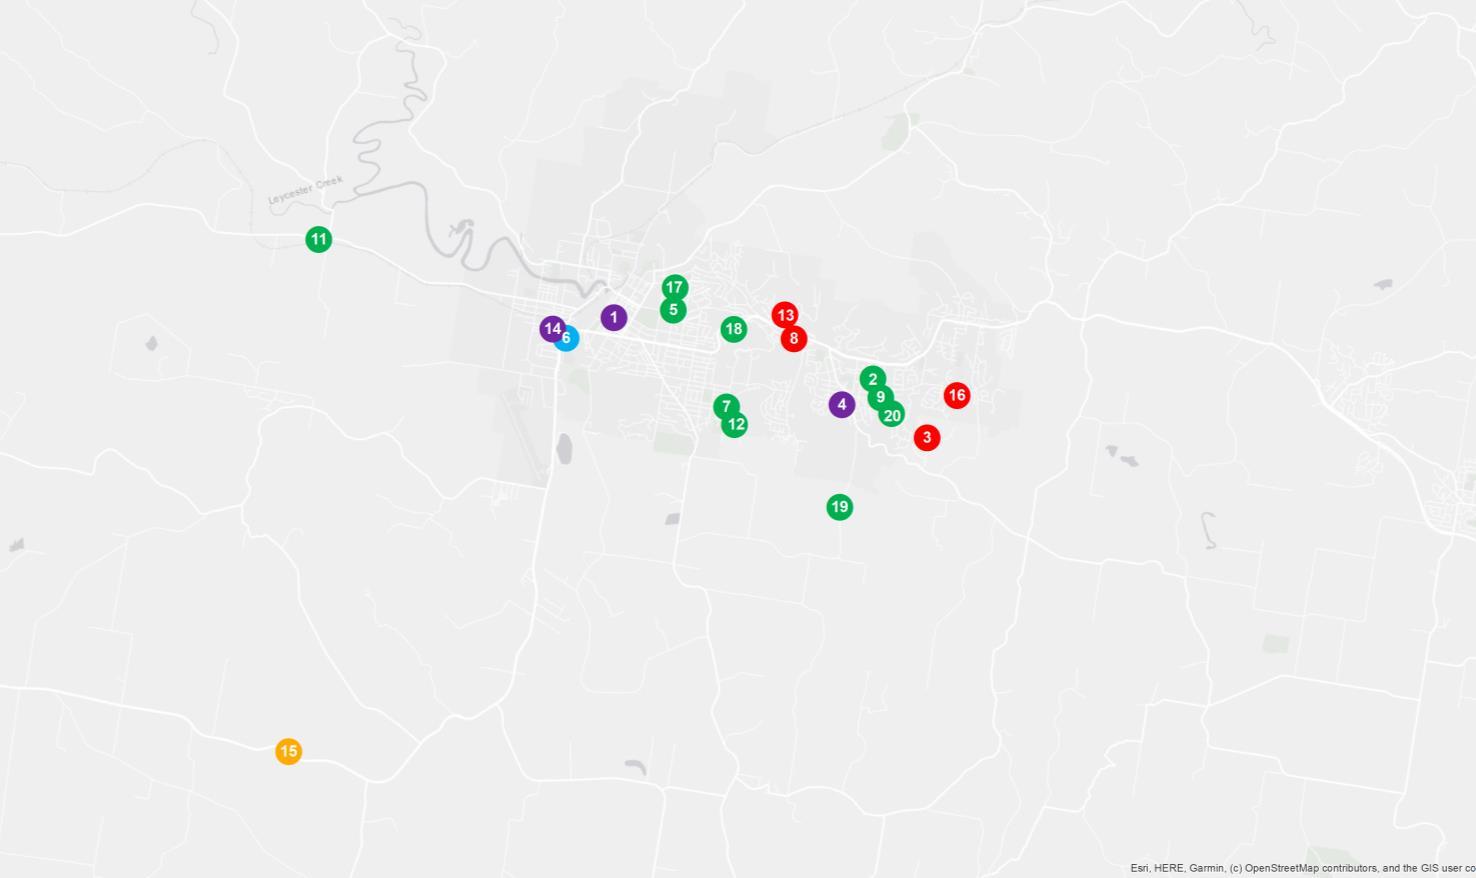
PROJECT DEVELOPMENT MAP 2025 ₳


RESEARCH SERVICES
Our research services span over every suburb, LGA,and state within Australia; captured in a variety of standard and customised products, andinclude:
• Advisory and consultancy
• Market analysis including profiling and trends
• Primary qualitative and quantitative research
• Demographic and target market analysis
• Geographic information mapping
• Project analysis including product and pricing recommendations
• Rental and investment return analysis
OUR KNOWLEDGE
Access to accurate and objective research is the foundation of all good property decisions.
OUR PEOPLE
Our research team is made up of highly qualified researchers who focus solely on propertyanalysis.


REFERENCES
* Lismore sales market data and key indicators encapsulates aggregate property market conditions within the Local Government Area of Lismore
** Estimated values are based on construction value provided by the relevant data authority and does not reflect commercial and/or re-sale value.
# 2025 encapsulates sales transactions for Q1 - Q3 (01/01/2025– 30/09/2025)only, other years encapsulates sales transactions for the full year (i.e 01/01 to 31/12 of the relevant year).
€ Annual rental growth is a comparison between Q3 2024 (01/07/2024 – 30/09/2024)and Q3 2025 (01/07/2025 – 30/09/2025) house median rent figures
¥ Lismore rental market data encapsulates aggregate property conditions within the postcode of 2480.
§ Rental yields shown are as reported as of September 2025.
₳ Project development map showcases a sample of upcoming projects only, due to accuracy of addresses provided by the data provider for geocoding purposes.
£ Projects refers to the top developments within the Local Government Area of Lismore.
µ Estimated value is the value of construction costs provided by relevant data authority, it does not reflect the project’s sale/commercial value.
ψ Commencement date quoted for each project is an approximate only, as provided by the relevant data authority, PRD does not hold any liability to the exact date.
Source: APM Pricefinder, Cordell Connect database, SQM Research, Esri ArcGIS.
Disclaimer: PRD does not give any warranty in relation to the accuracy of the information contained in this report. If you intend to rely upon the information contained herein, you must take note that the information, figures and projections have been provided by various sources and have not been verified by us. We have no belief one way or the other in relation to the accuracy of such information, figures and projections. PRD will not be liable for any loss or damage resulting from any statement, figure, calculation or any other information that you rely upon that is contained in the material.
Prepared by PRD Research. © All medians and volumes are calculated by PRD Research. Use with written permission only. All other responsibilities disclaimed. © Copyright PRD 2025.