Nundah Market Update 2nd Half 2025

In Q3 2025, Nundah* recorded a median house price of $1,234,000and a median unit price of $725,000.This is anannual (Q3 2024 – Q3 2025) price growth of 7.3% for houses and 21.2%for units, suggesting an ideal time forowners to capitalize on their investments. Comparing Q3 2024 and Q3 2025,sales decreased by -22.6%for houses (to 24sales in Q3 2025)and -37.0% for units (to 87sales in Q3 2025). This confirms a clear undersupply for both property types, which created a buffer against higher interest rates; as evidenced by high price growth. With limited new ready-to-sell supply planned in 2025,buyers need toact fast.

HOUSE SALES YEAR HALF YEAR CHANGE FROM LAST
HOUSE MEDIAN PRICE
HOUSE RENTAL PRICE
SALES


Nundah* is set tosee approximately $180.8Mofnewprojectscommence constructionfrom2025to2026


PRICE
RENTAL PRICE

MEDIAN PRICE Q3 2025
$1.2M $725K
MEDIAN PRICE Q3 2025
AVERAGE DAYS ON MARKET Q3 2025
56
16
AVERAGE DAYS ON MARKET Q3 2025
A key mixed-use project in 2025 is Danby Lane NundahMixed Use Development, which will construct a 12-storey mixed-use building with retail, offices, 84 apartments, pool, gym & 4-level basement parking.
Other key projects include:
• The Village Retirement Group Nundah (Commercial, $55.0M)
• Powerlink Queensland - Oil Laboratory (Infrastructure, $17.5M)
• 5-11 Ullswater Street Retail Warehouse (Industrial, $3.5M)
All new stock planned are solely units and townhouse, including
• Summerlin Residential Stage 3A (30 Apartments)
• 12-14 Bridge Street (6 Townhouses)
With no stand-alone houses in the pipeline, limited supply will fall short of demand. As a result, property prices are likely to rise even further in 2025 and beyond, forall property types.


AVERAGE VENDOR DISCOUNT*
Average vendor discount reflects the average percentage difference between the first list price and final sold price. A lower percentage difference (closer to 0.0%) suggests that buyers are willing to purchase close to the first asking price of a property.


Average vendor discounts between Q3 2024and Q3 2025 have swung to a balance of 0.0% for houses (thus, final sale prices now match first listed prices); and remained ata premium (although higher in Q3 2025) forunits, at 5.7%. Nundah* market conditions does favour sellers, as buyers must offer closer / higher thanthe first list price. Without any new houses planned, buyers must actfast.
The suburb of Nundah has historically performed mostly on par with the wider Brisbane Local Government Area (LGA) in for houses, which continued in 2025#.Unit median price in Nundah was slightly more affordable than Brisbane LGA in the past 5 years but have risen to become on par in 2025#
The dominant proportion of houses sold in Nundah* in 2025# are in the premium price point of above $1,350,000 for houses (44.9%) and the mid-range between $700,000to $799,999for units (38.1%) This is in line with strong median price growth for bothproperties and benefiting owners Thatsaid, the most affordable range remain available, with 18.4%of houses sold at less than $1,049,999and 18.9%of units sold at $599,999.Thus, despite high price growth, there is are still opportunities for first home buyers.
MARKET COMPARISON
The market comparison graph provides a comparative trend for the median price of houses and units over the past 5 years. The main LGA profiled was chosen based on their proximity to the main suburb analysed, which is Nundah.

PRICE BREAKDOWN 2025 #


than $599,999
$600,000 to $699,999 $700,000 to $799,999 $800,000 to $899,999 $900,000 and above
Nundah House Brisbane City (LGA) House Nundah Unit Brisbane City (LGA) Unit
RENTAL GROWTH 2025€
House rental yield in Nundah¥ was 2.6%in September 2025, lower than Virginia (3.2%) and Brisbane Metro (3.1%). That said, median house rental price increased by 10.9% in the past 12 months to Q3 2025, at$745 per week; along with a -18.3% drop in the number of houses rented (to 76 rentals in Q3 2025). Overall, despite a lower house rental yield than other areas, there is an undersupplied house rental market in Nundah¥. This is beneficial for investors.
3-bedroom houses have provided investors with +5.3%rental growth annually, achieving a median rent of $700per week.
Nundah¥ recorded a vacancy rate of 0.7% in September 2025, onpar with Virginia‘s 0.7% and below Brisbane Metro’s 1.0%. Vacancy rates in Nundah¥ have increased in the past 12months, due toinvestors re-entering the market. However, a 0.7% vacancy rate is well below the Real Estate Institute of Australia’s healthy benchmark of 3.0%, thus homes are rented quicker in Nundah¥ This confirms a conducive and sustainable investment environment in Nundah¥ , even if property prices (thus entry price) have increased in the past 12 months to Q3 2025.
RENTAL VACANCY RATES 2025


PROJECT DEVELOPMENT MAP 2025-2026 ₳
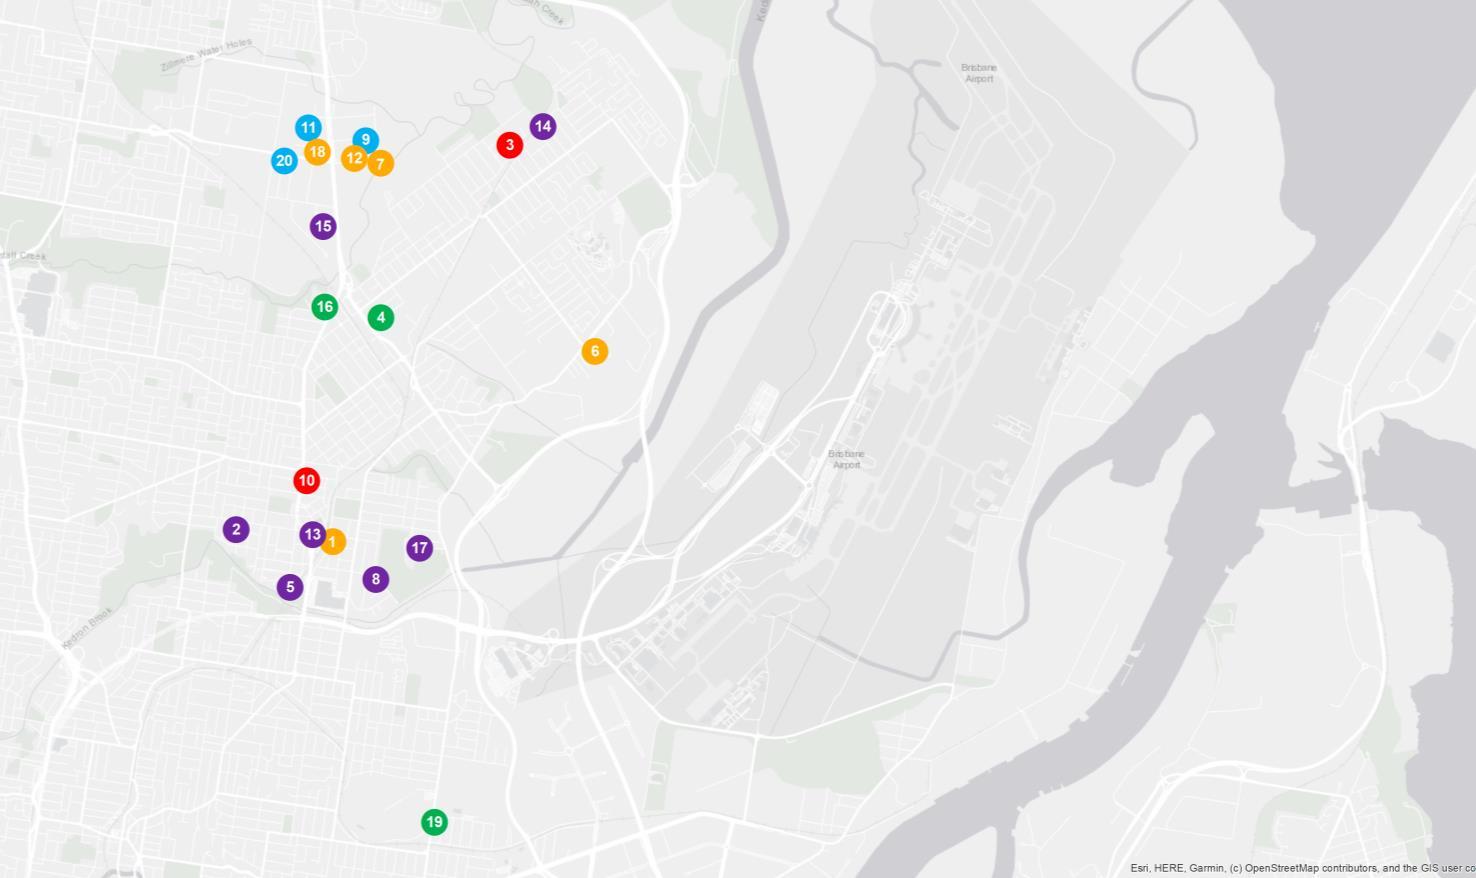

NUNDAH


RESEARCH SERVICES
Our research services span over every suburb, LGA,and state within Australia; captured in a variety of standard and customised products, andinclude:
• Advisory and consultancy
• Market analysis including profiling and trends
• Primary qualitative and quantitative research
• Demographic and target market analysis
• Geographic information mapping
• Project analysis including product and pricing recommendations
• Rental and investment return analysis
OUR KNOWLEDGE
Access to accurate and objective research is the foundation of all good property decisions.
OUR PEOPLE
Our research team is made up of highly qualified researchers who focus solely on propertyanalysis.


REFERENCES
* Nundah sales market data and key indicators encapsulates aggregate property market conditions within the suburb of Nundah.
** Estimated values are based on construction value provided by the relevant data authority and does not reflect commercial and/or re-sale value.
# 2025 encapsulates sales transactions for Q1 - Q3 (01/01/2025– 30/09/2025)only, other years encapsulates sales transactions for the full year (i.e 01/01 to 31/12 of the relevant year).
€ Annual rental growth is a comparison between Q3 2024 (01/07/2024 – 30/09/2024)and Q3 2025 (01/07/2025 – 30/09/2025) house median rent figures.
¥ Nundah rental market data encapsulates aggregate property conditions within the postcode of 4012.
§ Rental yields shown are as reported as of September 2025.
₳ Project development map showcases a sample of upcoming projects only, due to accuracy of addresses provided by the data provider for geocoding purposes.
£ Projects refers to the top developments within postcodes of 4012 and 4014.
µ Estimated value is the value of construction costs provided by relevant data authority, it does not reflect the project’s sale/commercial value.
ψ Commencement date quoted for each project is an approximate only, as provided by the relevant data authority, PRD does not hold any liability to the exact date.
Source: APM Pricefinder, Cordell Connect database, SQM Research, Esri ArcGIS.
Disclaimer: PRD does not give any warranty in relation to the accuracy of the information contained in this report. If you intend to rely upon the information contained herein, you must take note that the information, figures and projections have been provided by various sources and have not been verified by us. We have no belief one way or the other in relation to the accuracy of such information, figures and projections. PRD will not be liable for any loss or damage resulting from any statement, figure, calculation or any other information that you rely upon that is contained in the material.
Prepared by PRD Research. © All medians and volumes are calculated by PRD Research. Use with written permission only. All other responsibilities disclaimed. © Copyright PRD 2025.