Prepared
by: Lose
Design 2022 - 2032 Lynchburg, Virginia PARKS AND RECREATION MASTER PLAN

Chapter 01: Introduction
1.1 - 1.6
Chapter 02: Community Profile ............................................................................ 2.1 - 2.12
Chapter 03: Public Engagement ........................................................................... 3.1 - 3.14
Chapter 04: Park Classifications and Service Criteria ...................................... 4.1 - 4.80
Chapter 05: Programming Review ....................................................................... 5.1 - 5.28
Chapter 06: Capital Improvement Plan ............................................................... 6.1 - 6.10
Chapter 07: Works Cited 7.1 - 7.2
Appendices: Please see separate document titled "Lynchburg, Virginia Parks and Recreation Master Plan Appendices"
Memorandum: Please see separate document titled "Lynchburg, Virginia Parks and Recreation Master Plan Memorandum"


Mayor MaryJane Dolan, Ward 1
Vice Mayor Beau Wright, At-Large
Sterling A. Wilder, Ward 2
Jeff S. Helgeson, Ward 3
Chris Faraldi, Ward 4
J. Randolph Nelson, At-Large
Treney Tweedy, At-Large
Lose would like to acknowledge Director Jenny Jones and the Parks and Recreation Lead Team:
Chris Higgins, Park Services Manager
Ricky Kowalewski, Lynchburg Community Market Manager
Charlotte Lester, Neighborhood Centers Manager
Maggie Mace, Recreation Services Manager
John Ramsey, Support Services Manager
Wynter Benda, City Manager
Kent White, Acting Deputy City Manager
John H. Huges, IV, Assistant City Manager
Lose Design would like to thank all of the elected officials, partnerships, stakeholders, staff, and citizens who participated in the development of this master plan. Through your commitment and dedication to parks and recreation, the planning team was able to develop this plan to guide the delivery of recreation services to the citizens of Lynchburg.
Figure 2.1: Lynchburg Population Projections: 2020 to 2045 ..................................... 2.3
Figure 2.2: Lynchburg Population Density per Block Group Acre .............................. 2.4
Figure 2.3: Lynchburg Population by Age ....................................................................... 2.5
Figure 2.4: Age Shift (2021 - 2026) - All Age Categories 2.6
Figure 2.5: Age Shift (2021 - 2026) - Youth, Adults, and Seniors 2.6
Figure 2.6: Lynchburg Population by Gender 2.7
Figure 2.7: Lynchburg Population by Race and Ethnicity 2.8
Figure 2.8: Median Household Income 2.10
Figure 2.9: Percent Below Poverty 2.10
Figure 2.10: Lynchburg Health Rankings 2.11
Figure 3.1: Pop-Up Event Program Opportunities (Top 15) 3.6
Figure 3.2: Pop-Up Event Facility Opportunities (Top 15) 3.7
Figure 4.1: Lynchburg Existing Park Locations 4.11
Figure 4.2: Monsview Park Concept Plan 4.15
Figure 4.3: Lynchburg Gap Analysis 4.17
Figure 4.4: Lynchburg Park Gaps 4.19
Figure 4.5: Lynchburg Proposed Service Areas 4.21
Figure 4.6: Lynchburg Proposed Inner Loop Segments 4.29
Figure 4.7: Lynchburg Proposed Greenway Connections: Phase 1A 4.31
Figure 4.8: Lynchburg Proposed Greenway Connections: Phase 1B 4.33
FIgure 4.9: Lynchburg Proposed Greenway Connections: Phase 1C 4.35
Figure 4.10: Lynchburg Proposed Greenway Connections: Phase 2A 4.37
Figure 4.11: Lynchburg Proposed Greenway Connections: Phase 2B 4.39
Figure 4.12: Lynchburg Proposed Greenway Connections: Phase 2C 4.41
Figure 4.13: Lynchburg Proposed Inner and Outer Loops 4.43
Figure 5.1: Lynchburg Recreation Services Program Distribution 5.13
Figure 5.2: Age Segmentation 5.14
Figure 5.3: Population vs. Program Menu 5.15
Figure 5.4: Recreation Services Program Trends 5.16
Figure 5.5: Recreation Services Core Program Offerings 5.17

Figure 5.6: Recreation Services Core Program Participation 5.17
Figure 6.1: Potential Increased Annual Revenue 6.2
Table 2.1: Income and Housing Characteristics............................................................ 2.9
Table 4.1: NRPA Park Classifications with Service Area Criteria ................................ 4.3
Table 4.2: Facility Surplus and Deficit Analysis.............................................................. 4.8
Table 5.1: Major Program Categories .............................................................................. 5.4
Table 5.2: Program Types by Season (2019) 5.12
Table 5.3: Age Segments of Programs Offered (by Season) 5.14
Table 5.4: NRPA Park Metric Results for Communities with a Population
Between 50,000 and 100,000 5.19
Table 5.5: Neighborhood Centers Participation for 2019 5.21
Table 5.6: Future Program Planning Ideas 5.26
Table 6.1: Lynchburg, Virginia - Ten-Year Capital Spending Plan 6.5


THIS PAGE INTENTIONALLY LEFT BLANK
The function of this master plan is to assess the City of Lynchburg’s public parks and recreation system and provide recommendations to enhance services across the community over the next decade. This parks and recreation master plan provides recommendations for existing parks and recreation facilities, programming, and administration in the community with the goal of maximizing and improving the efficiency of service delivery. The window for implementation is from 2022 through 2032. This master plan is a working and flexible document that provides guidance by establishing a clear vision for the future as well as goals and objectives regarding Lynchburg’s park system. This will serve as a strategic action plan to help guide future programs, parks, and recreational capital improvement projects.

The planning team, coordinated by Lose Design, a multidisciplinary firm specializing in park and recreation planning, includes consulting firm BerryDunn and the City of Lynchburg Parks and Recreation Department (the Department). The planning team also includes focus groups consisting of diverse, local stakeholders and officials that have insight into parks and recreation facilities, programming, and community engagement. Development of this report included researching demographics, assessing current facilities, engaging focus groups on thematic topics, and conducting public input meetings. BerryDunn assisted in assessing department staffing needs and program offerings.
The City of Lynchburg’s Parks and Recreation Department Mission and Vision are as follows:
The Mission of the Lynchburg Parks and Recreation Department is to improve the health and happiness of our diverse community by stewarding parks, public spaces, and trails, and offering comprehensive recreation services.

The best parks and recreation department for our community.
This vision will serve as a framework for the long-term use and development of parks and recreation needs over the span of ten years. The master planning process identifies the recreation needs of a community, predicts future demand, and makes recommendations to improve recreation services across the community. This plan was developed through a combination of public input, insight from City of Lynchburg staff and elected officials, and professional analysis.
This master plan document is based on a review of reports and data, best practices analysis, and interviews with stakeholders, focus groups, elected officials, department staff, and the citizens of Lynchburg. An inventory of existing facilities, programs, policies, and services related to parks and recreation was developed. The National Recreation and Park Association’s (NRPA) Park Metrics were reviewed for a high-level benchmarking comparison of Lynchburg facility inventories to comparable communities. Finally, interviews with stakeholders provided a snapshot of the level of utilization and individual perception of the Department and the park system. This information is key when determining the needs of residents and for the prioritization of physical, programmatic, and operational improvements.
Recommendations designed to improve the level-of-service across the city over the next ten years are provided as part of the master plan. This plan provides recommendations regarding Department of Parks and Recreation facilities, programming, and administration from 2022 to 2032. Recommendations for future growth are based on demographics, assessing current facilities, public input, and interviews with elected officials, appointed officials, and city staff.
This document serves elected and appointed officials and Department staff as both a master plan and an action plan. The plan provides Lynchburg with guidelines and recommendations for decision making and future investment. This master plan also identifies current recreational offerings and future recreation goals to be implemented as the population grows and changes. The plan will answer the following questions:
Successful park and recreation master plans are based on defining and addressing the needs of the community. Changes in elected officials and staff may occur. There will be numerous competing priorities for the City to address. However, an engaged public can push a plan forward amid such changes and distractions.
Short-term and long-term goals will be identified in this master plan. These goals are prioritized based on complexity, cost, need, and public input of residents. A Capital Improvement Program (CIP) is the best tool to ensure implementation of physical improvements recommended in the plan. A suggested ten-year CIP is provided as part of this document.
Assessments were performed that targeted different aspects of a parks and recreation system. These assessments included:
• Community profile
• Public engagement
• Park Classifications and Service Criteria
• Programming Review
• Staffing Assessment
• Recreation and Program Trends
• Health Equity Assessment
• Budget and Funding Analysis
• Cost Recovery Assessment

• Capital Improvement Plan
Upon completion of the above referenced tasks and assessments, determinations regarding the parks and recreation system were made. Based on information obtained, additions or changes to programs and activities offered by the Department will be made to better accommodate community needs. Physical improvements to infrastructure within the parks and recreation system will be based on gaps identified in the Facility Assessment. Estimated costs and proposed locations will be included in this master plan. An all-inclusive, wide-ranging analysis with recommendations for the Department system will be provided.

The planning process included an analysis of the existing organizational structure and staffing for the Parks and Recreation Department. A separate document was provided for the Department’s internal use with recommendations to ensure the Department is sufficiently staffed and positioned to effectively deploy this master plan.
In addition, the planning team provided a separate health equity assessment, a strategic approach to community health that recognizes the combined importance of environment, resources, and programming in encouraging individuals to move more, eat nutritiously, engage with their community, spend time in nature, and find purpose in their lives. Effectively shifting behaviors requires that the desired behavior becomes the easy choice ("healthy default"). With the support of the City and other community partners, the Department can be a powerful force in promoting healthy default behaviors and reducing health disparities in the community.
Together, the analysis and recommendations from the Staffing Assessment and Health Equity Assessment complement the master plan to ensure alignment with the plan’s goals.
A timeline for implementing the recommendations is provided. Recommendations are prioritized with associated cost estimates. This phasing plan is intended to be a tool to assist in the budget process over the timeframe of the ten-year plan.
Park facilities and programs now serve all residents, all ages, and a variety of interests. This requires a diversification of services based on research, demographic data, and market conditions. Development demands, shrinking publicly accessible land, increased property values, and residents with busy schedules have collectively placed a demand for well-designed and efficient facilities, park space, and recreational opportunities that serve the wide and varied needs of Lynchburg citizens. Park facilities have become social gathering spaces, opportunities for improving health, and benchmarks for the quality of life within a community. The master plan will serve as a tool to guide decisions by city officials, prioritize maintenance, identify new projects and programs, and ensure the delivery of recreational services to meet the needs of a socially diverse community with a growing population.

 James River Sky by Lynchburg Virginia
THIS PAGE INTENTIONALLY LEFT BLANK
The recreation needs and trends of a city are dependent on the preferences and way of life of its residents. Desired programs and recreation needs are often dependent on age, gender, education, and socio-economic status. Public desires can be anticipated by reviewing demographic data and public input. Activities that will likely be popular as the community’s demographic profile changes can also be predicted by reviewing demographic data.

Nationwide, demographic factors of all communities are constantly changing, and Lynchburg is no different. One demographic factor, age, is significant in determining recreation trends. For example, a child who is ten years old when a plan is developed may be interested in team sports like baseball or soccer; however, at the end of the plan’s timeframe, that interest may have shifted to individual recreation activities such as running or cycling. Knowledge of age and its predicted changes are useful when a large percentage of the population will soon reach an age at which their recreation preferences are likely to change.

Demographics are the population characteristics of an area. Long-term demographic studies help local elected officials identify trends and show how a population is changing. A clear understanding of these trends is necessary to understand Lynchburg’s needs. The current and projected population establishes the type of facilities and services needed in the future.
To gain a better understanding of the park and recreational needs of the City of Lynchburg, a community profile has been developed. The demographic factors in this section include:
• Population Trends
• Economic Trends
• Health Trends
Making long-term decisions guided by city demographics and population projections will result in a well-planned and effectively managed park and recreation system, which is important because parks and recreation help build communities and are critical attractors of new residents.
To fully understand the local interests and the park and recreational needs in the City of Lynchburg, an updated community profile has been prepared. As part of this profile, population data was used to determine and evaluate subsets within the population. Historic population data was gathered from the U.S. Census Bureau. Future population projections for Lynchburg were taken from the University of Virginia’s Weldon Cooper Center for Public Service.
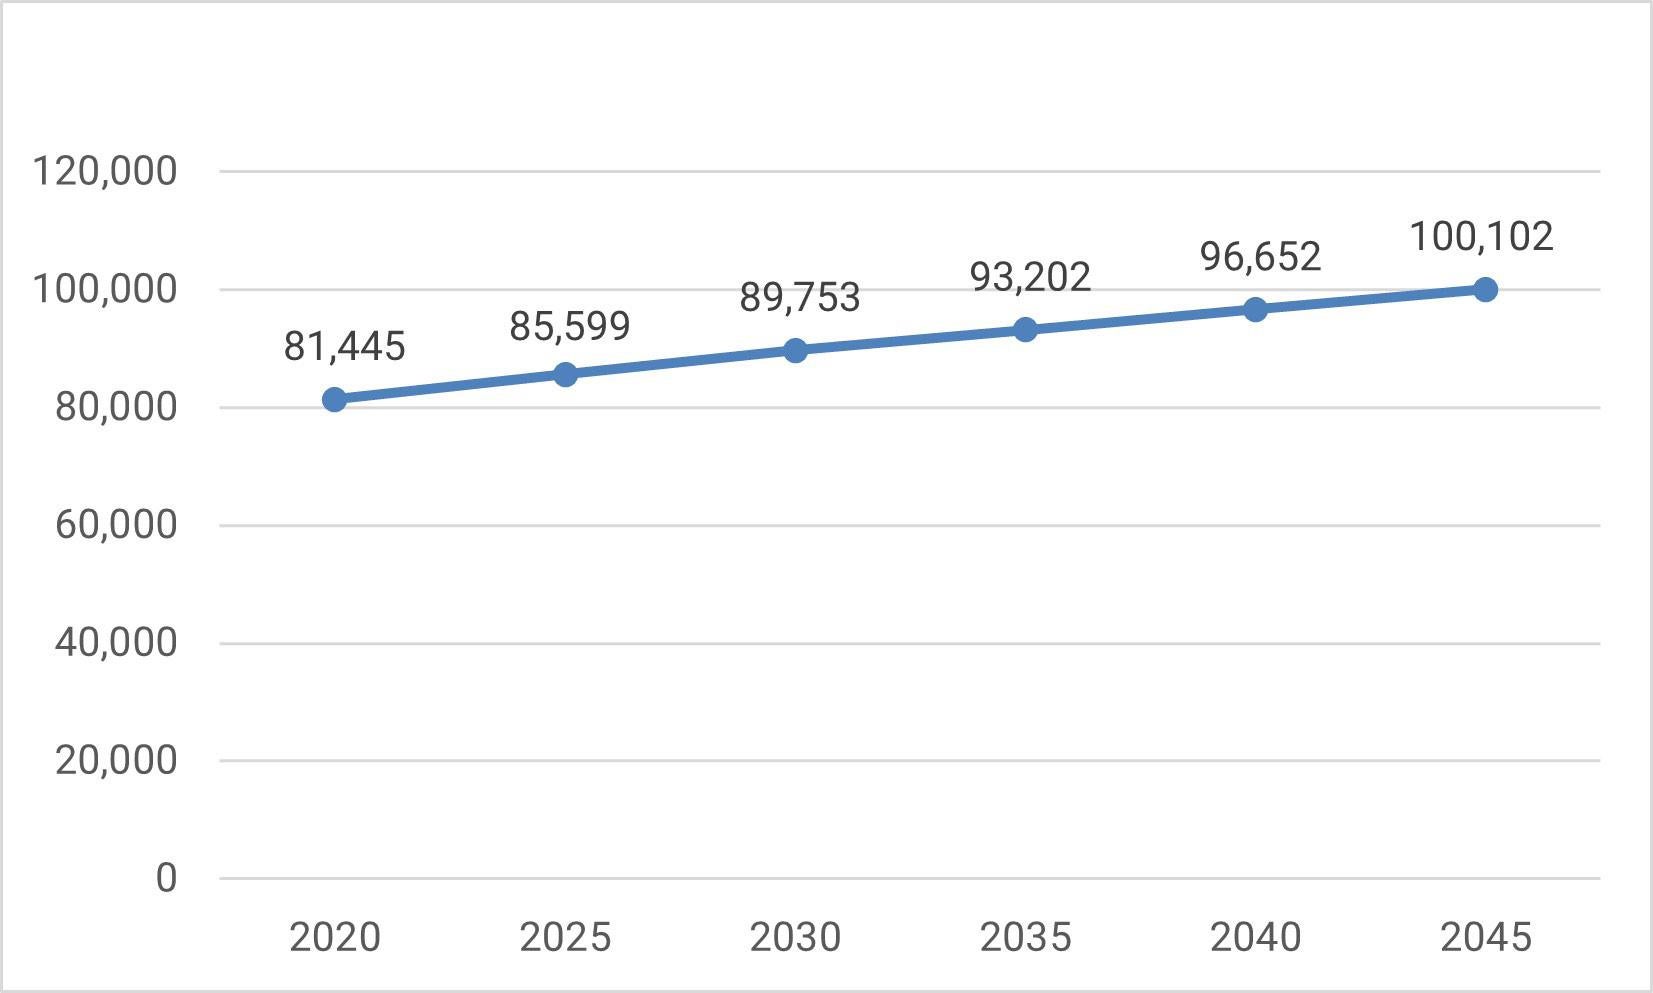
Source: University of Virginia Weldon Cooper Center, Demographics Research Group. (2019). Virginia Population Projections. Retrieved from https://demographics.coopercenter.org/virginia-population-projections
The population of Lynchburg has increased over the past decade and is projected to increase for the next twenty years (see Figure 2.1). In 2010, the population of Lynchburg was 75,553. The population continued to grow over the next ten years to an estimated 81,445 people in 2020. Lynchburg is projected to grow in population from 81,445 in 2020 to over one hundred thousand in 2045 (100,102). This increase results in a growth rate of 18.7%. For comparison, the Commonwealth of Virginia has a projected growth rate of 14.3% for the same twenty-year period from 8,744,273 to 10,201,530. Lynchburg’s growth rate can possibly be attributed to successful economic development efforts, high quality parks and recreation opportunities, thriving colleges and universities, and successful downtown revitalization efforts.


Figure 2.2 illustrates the population distribution by census block group as reported by the American Community Survey five-year estimates (2015 – 2019). The darker areas indicate a higher number of people per acre, and the data is displayed per each block group. Densely populated areas can be found along the Fort Avenue/Business 460 corridor and in southern Lynchburg along Timberlake Road/Business 460. Two of the more dense areas can be attributed to the University of Lynchburg and Liberty University. Lynchburg’s historic downtown area, located between the James River and Kemper Street, is another relatively dense par t of the community. Understanding population distribution clarifies where recreation facilities and ser vices are needed.
Figure 2.2: Lynchburg Population Density per Block Group Acre


Source: U.S. Census Bureau, 2019 American Community Survey 5-Year Estimates

Understanding the age distribution of residents living in Lynchburg is a critical element to understanding types of programs and facilities that would be beneficial to a community. Approximately 23% of the population in Lynchburg is comprised of adults ages 25-44 (see Figure 2.3). These age groups typically include working adults and young families. The largest single age group in Lynchburg is adults ages 20-24 (17%). This is likely due to the number of universities and colleges located in Lynchburg. A recent article in the Cardinal News listed Lynchburg as the fifth youngest locality in the State of Virginia.
People between the ages of 55 to 74, comprise approximately 17% of the City of Lynchburg’s population. This age group is typically active and create unique needs for parks and recreation. Data from the U.S. Census Bureau suggest these age groups have increased by one percent (1%) when compared to the 2010 census data. This demographic shift may indicate demand for specific types of recreation facilities and programs, if the trend continues.


To understand age shifts over time, the planning team obtained demographic data from Esri, a research and development organization that specializes in population projections and market trends. Esri's demographic estimates for 2021 and 2026 were used in the age shift analysis.
Figure 2.4 breaks down the population shift between the same age groupings used in Figure 2.3, and Figure 2.5 shows the shift between youth, adults, and seniors.
Figure 2.4: Age Shift (2021 - 2026) - All Age Categories
Source: U.S. Census Bureau, 2019 American Community Survey 5-Year Estimates; ESRI estimates
Although two groups (25 - 34 years and 55 - 64 years) show population decreases in Figure 2.4 between 2021 and 2026, the decline in the 2534 age group may represent graduating college students leaving Lynchburg to begin careers. Overall, all age groups (youth, adults, and seniors) increase in that time period as shown in Figure 2.5. Seniors, those 55 years and older, had the largest increase of the three groups. This data suggests that older adults are staying in the community and aging in place. This will require enhanced and expanded adult and senior programming. Accessible facilities, parks, and trails are critical for this age group.
1,200
1,000
800
Figure 2.5: Age Shift (2021 - 2026) - Youth, Adults, and Seniors 558
600
400
200
1,331 0
718
1,400 Youth (0 - 19 years) Adults (20 - 54 years) Seniors (55+ years)
Source: U.S. Census Bureau, 2019 American Community Survey 5-Year Estimates; ESRI estimates
The gender ratio of Lynchburg residents is estimated to be 47% male and 53% female (see Figure 2.6). This ratio is comparable to commonwealth and national ratios. The ratio for Lynchburg residents 65 years and older is 40% male and 60% female. Typically, females exceed males in older age groups. Females outnumber males in Lynchburg, which is the case for Virginia and the United States. Women account for over half of the total population in the United States, Virginia, and Lynchburg.


The analysis of Lynchburg’s race and ethnicity shows that the population is predominantly white (see Figure 2.7). The U.S. Census Bureau estimates Lynchburg’s population in 2019 was 65% white and 29% black. In comparison, the Commonwealth of Virginia had a population of 68% white and 19% black. The Asian and Hispanic (a designation independent of race designation) percentages, 2.4% and 4.2% respectively, are lower in Lynchburg than in Virginia and the United States. While preferences for park facilities and programs can be similar among all races and ethnicities, the Department should increase outreach to minorities if participation in recreation programs does not reflect the racial diversity observed within the community.

Source: U.S. Census Bureau, 2019 American Community Survey 5-Year Estimates

Median Household Income, Owner-Occupied Housing Rate, Median Value of Occupied Housing Units, and Persons Below Poverty Level were all reviewed for Lynchburg’s economic profile. These numbers are important to compare to commonwealth and national averages to understand where Lynchburg falls in terms of these economic trends.
As shown in Table 2.1, when comparing Median Household Income, Owner-Occupied Housing Rate, and Median Value of Owner-Occupied Housing Units, Lynchburg has lower numbers in all three categories than Virginia and the United States. The Median Household Income in Lynchburg is $32,187 less than in Virginia and $16,434 less than in the United States. The Owner-Occupied Housing Rate for Lynchburg is approximately 18% lower than Virginia and 15% lower than the United States. In Lynchburg, the Median Value of Owner-Occupied Housing Units is $113,000 lower than Virginia and $57,400 lower than the United States. The percentage of Persons Below Poverty Level is approximately 9% higher in Lynchburg than in Virginia and 6% higher than the United States.
Median Household Income $62,843 $74,222 $46,409
Owner-Occupied Housing Rate 64.0% 66.3% 48.7%

Median Value of Owner-Occupied Housing Units $217,500 $273,100 $160,100 Persons Below Poverty Level (%) 13.4% 10.6% 19.5%
Source: U.S. Census Bureau, 2019 American Community Survey 5-Year Estimates
United States Virginia LynchburgSource: U.S. Census Bureau, 2019 American Community Survey 5-Year Estimates
Income levels are notable because they relate to a resident’s ability to pay for participation fees and other costs related to recreation programs (see Figure 2.8). In communities with low-income levels, local governments typically play a leading role in meeting resident needs by providing funding to subsidize recreation programs. This information may inform decisions regarding fee structure, which should be set at levels that do not limit participation. Reduced program fees may, in turn, impact revenue recovery efforts if alternate sources of revenue are not identified. Understanding household income can inform pricing strategies for recreation programs.
The U.S. Census Bureau uses poverty thresholds to determine poverty status. Each person or family is assigned one out of 48 possible poverty thresholds. If a family’s total income is less than the family’s threshold, then that family and every individual in it is considered in poverty (source: www.census.gov).
As shown in Figure 2.9, the poverty rate in Lynchburg (19.5%) is 9% higher than the Commonwealth of Virginia and 6% higher than the United States. Estimates from the U.S. Census suggest there may be a greater need for recreation fee reductions or waivers in Lynchburg because of the higher poverty rate.

Source: U.S. Census Bureau, 2019 American Community Survey 5-Year Estimates

People are generally less active than in the past and tend to lead sedentary lifestyles. This inactivity has led to an obesity epidemic, which continues to grow in many parts of the United States. The most dramatic increases in obesity are in the southern United States. This affects life expectancy and has economic impacts related to medical spending and productivity in the workplace. According to the Center for Disease Control (CDC) in 2015, “an estimated annual medical cost of obesity in the U.S. was $147 billion in 2008 U.S. dollars; the medical costs for people who are obese were $1,429 higher than those of normal weight.”
Physical activity not only helps maintain a healthy weight, but also benefits mental health. According to a 2006 article from the Primary Care Companion to the Journal of Clinical Psychiatry, exercise improves mental health by reducing anxiety, depression, and negative mood and by improving self-esteem and cognitive function. Exercise has also been found to alleviate low self-esteem and social withdrawal (Source: Exercise for Mental Health by Ashish Sharma, M.D., Vishal Madaan, M.D., and Frederick D. Petty, M.D., Ph.D.). Research from the University of East Anglia (UEA) and the Centre for Diet and Activity Research (CEDAR) in 2014 also reveals that commuters who regularly walk or bicycle to work have noticeably better mental health than those who commute by car.
Elected and appointed officials, as well as residents, need to understand the risks associated with obesity and inactive lifestyles. Strong action at the community level is critical to addressing chronic disease trends by providing facilities and recreational programs that attract residents and establish healthy lifestyles at an early age. This may include youth sports, exercise programs for working adults, and passive activities for those age 65 and older. A well-rounded parks and recreation system that offers opportunities for all age groups and interests is key to establishing healthy lifestyles.
According to County Health Rankings and Roadmaps, the adult obesity rate (percentage of adults that report a Body Mass Index of 30 or greater) in Lynchburg is 36% (see Figure 2.10). This rate is higher than Virginia, which has an obesity rate of 31% and higher than the top U.S. performers (26%). Lynchburg’s physical inactivity rate (24%) is about the same as Virginia (22%), but higher than the top U.S. performers (19%). Approximately 95% of Lynchburg residents have access to exercise options, which is higher than the top U.S. performers (91%) and Virginia (82%).


Source: www.countyhealthrankings.org
Increased physical activity is associated with lower risks of Type 2 Diabetes, cancer, stroke, hypertension, cardiovascular disease, and premature mortality. The role of the built environment is important in encouraging physical activity. According to the University of Wisconsin Population Health Institute, individuals who live closer to sidewalks, parks, and gyms are more likely to exercise. Improved parks, recreation amenities, sidewalks, bicycle lanes and greenways can help to support residents’ overall physical and mental health. Continued strategic investment in parks and recreation should be a priority in an effort to improve health outcomes.

Lynchburg is a diverse community with many strengths, including a high percentage of residents that have access to exercise options. There are also potential challenges in the areas of household income and poverty that will need to be considered when making future decisions. The demographic data described in the preceding text was used to formulate recommendations contained in this document.

 Pop-up event attendees participate in a sticker exercise at Dick’s Sporting Goods in Lynchburg
THIS PAGE INTENTIONALLY LEFT BLANK
Public input is a critical component in developing a comprehensive parks and recreation master plan. Citizens of Lynchburg played an important role in the development of the master plan as the primary users of the park system facilities and programs. For the master plan to be effective in improving services, the plan must accurately reflect the facilities and programs most desired by Lynchburg residents. Recommendations provided were informed by public input gathered through interviews and online through the Social Pinpont website, focus group sessions, and public pop-up events. These activities allowed for spontaneous and casual conversations about park and recreation needs in a variety of settings throughout the community.
The public input process started with interviews that included meetings with the City of Lynchburg Department of Parks and Recreation (the Department) director, park staff, other municipal employees, and elected officials. These interviews provided an overview of how the Department functions. The interviews also highlighted opportunities for operational improvements and how the Department fits into the City of Lynchburg's long-term vision.

Various public engagement activities were used to foster public involvement to identify potential parks and recreation needs and priorities for Lynchburg. Efforts included a project website that provided a community survey, mapping tool, community forum, and budget questions. Six focus group workshops, and 24 public pop-up events were held in addition to the online public engagement. Approximately 2,700 residents participated in the process. While there were a variety of specific needs and desires that were mentioned, these key topics emerged:
• Improvements to existing parks and facilities are the top funding priority.
• Nature programs and trails to facilitate walking, hiking, and bicycling are highly desired.
• There is a need for new parks in specific areas of the city.
• Seventy percent of Lynchburg residents travel outside of Lynchburg to use parks and recreation facilities.
• Pop-up engagement results indicate special events like concerts and movies in the park are desired.
The following section provides an overview of the findings from each of the public engagement activities. These methods are designed to identify needed facilities and programs, public perception of the Department’s parks and recreation system, and the level of support for improving offerings.

As part of the City of Lynchburg Parks and Recreation Master Plan, an online community survey, hosted by Social Pinpoint, was used to foster discussion and collect ideas and recommendations for the parks and recreation system (see Appendix B). Social Pinpoint is “a leading digital engagement tool that enables Community Planning Professionals to build hybrid participation strategies that drive greater reach, diversity, consultation and collaboration on a wide range of projects.” The community survey was part of the overall public engagement process to determine if residents use Lynchburg parks and why, and their opinion of the quality, accessibility, and importance of the parks system. In addition to the community survey, participants could use the Social Pinpoint site to place comments on a map of Lynchburg with opinions on where new facilities should be located or what improvements are needed for existing facilities. Answers to the community survey questions and comments collected from the map will inform decision makers in Lynchburg regarding the growth and expansion of park services and how best to serve residents’ needs.
A total of 1,901 individuals provided input through the project website. Three hundred and sixty map comments were made, 215 residents completed the online community survey, 62 provided budget recommendations and 32 discussions were initiated. This information, coupled with in-person public outreach including public meetings, pop-up events, and collection of one-on-one stakeholder input, provides a robust picture of residents’ perception and desires for the parks and recreation system.
Some of the most interesting forms of public input received during the public input phase came from the online mapping exercise. This tool is uniquely helpful because it allowed commentors to tell the planning team what they would like to see and provide a location for where that should happen. The online mapping exercise also allowed the public to agree or disagree with comments provided by others.
The map report generated 360 comments. Each comment was classified and placed into one of these six categories:
• Ideas and Suggestions (132 entries)
• Something I Like (13 entries)
• Make a Comment (42 entries)
• Greenway (127 entries)
• New Park or Facility (35 entries)
• Natural Open Space (11 entries)
Trail and greenway comments were well represented. Many comments gave precise recommendations on possible routes to connect existing separate trails and ideas for improving bicycle and pedestrian connections to parks. These comments illustrate real opportunities to connect trails and parks in a way that will improve access for many in the community. New facilities were mentioned in the map tool in a number of ways. One of the most “liked” recommendations was to create a landing for batteaus on the James River that would serve as river access and help with interpretive discussions of river history.
Just as popular was a suggestion to construct a climbing wall under the John Lynch Memorial Bridge. This is a creative way to utilize gray infrastructure as a recreational asset.

New facility comments also spoke to previously identified park deserts. Specifically, new facilities were desired in Tyreeanna, Rivermont, and south Lynchburg near Timberlake Road. There were also comments for building a new indoor facility and an amphitheater, as well as expanding the Templeton Senior Center. These comments reinforce previous studies conducted by the Trust for Public Land that identified needs for parks in these areas. The comments also supported the parks and recreation facility recommendations in the Comprehensive Plans, including the Tinbridge Hill, Tyreeanna and Pleasant Valley, and Dearington neighborhoods, as well as the Downtown 2040 Master Plan.

Sixty percent of survey participants rated the condition of Lynchburg’s park facilities as “good quality” and 20 percent of participants responded with “high quality.” Additionally, 57 percent responded that the Department staff was easily accessible for information regarding the parks system. Another question on the survey addressed the perceived reputation of Lynchburg’s parks and recreation system, which 47% feel is “good.” Thirty percent of respondents reported a “great” reputation and 16 percent reported an “average” reputation. Only two percent rated the system’s reputation as “poor.”
Fifty percent of survey participants stated they would volunteer to personally assist with making improvements in the parks and 91 percent support efforts to improve facilities and programs over time as funding becomes available. Many respondents are also willing to walk to parks if it is safe to do so. Approximately 43 percent stated they would walk one to two miles to access park facilities and an additional 12 percent reported they would walk two miles or more.
Two-thirds of respondents reported they travel outside of Lynchburg to use parks and facilities. Bedford, Roanoke, and regional/state parks were some of the places that respondents traveled to outside of Lynchburg for recreation. Facility type was a major factor in this consideration with 36 percent stating that other places offered facilities that were not available in Lynchburg. Some specific facilities referenced in these responses include the Appalachian Trail, Smith Mountain Lake, various state and national parks, regional mountain bike trails and disc golf courses. Roanoke and Amherst County parks were mentioned often in these responses. Roanoke parks are perceived as having "bigger and better" trails and skate parks. Amherst County is perceived as being more peaceful and quieter by some respondents.
Twenty-seven percent responded that other organizations offered better quality services and 11 percent responded that other facilities were closer to their residence or workplace.
Survey data should play a vital role in budgetary considerations for the Department regarding expansion of facility and program offerings. Sixty-seven percent of participants stated they would be open to increased
costs to improve recreational offerings in the system. Sixty-three percent stated they would support a cost of $1 to $15 a month to improve Lynchburg’s park system and many responses indicated support for even higher amounts.
The community survey and opportunities to comment were available on Social Pinpoint from April 2021 through May 2021. The survey also included questions regarding the Community Market, neighborhood centers, Big Ideas, and environmental issues. The entire community survey is included in Appendix C of this report along with graphs and tables, which provide detailed information regarding demographics of the participants of the survey. Additional comments from the survey are included in Appendix D.
In addition to the online survey, Lose Design also hosted four pop-up events around Lynchburg in March 2021. The Department hosted 19 additional pop-up events throughout April 2021 to collect information about residents’ recreation needs and priorities. Pop-up events were held at the following locations:

• Riverside Park Playground/Sprayground (multiple)
• Awareness Garden (multiple)
• Hollins Mill Park
• Lynchburg Community Market (multiple)
• Point of Honor Trail
• Yoder Center
• Jefferson Park
• Ivy Creek Park
• Fairview
• College Hill
• Daniel’s Hill
• Diamond Hill
• Riverfront Park
• Peaks View Park
• Dick’s Sporting Goods (multiple)
Participants were asked to complete two activities, regarding recommendations for facilities and programming. These activities allowed for a high-level of interaction with the planning team and helped inform recommendations provided in the following sections.
Pop-up event attendees used stickers to identify programs and facilities they felt were needed but were not adequately provided in Lynchburg. Options were extensive and included 90 different programs and 67 types of facilities to choose from. Votes were tallied at each pop-up event.
The top identified program opportunities included concerts, movies in the park, gardening classes, an arts festival, and programs for people with special needs. Interestingly, athletic programs were well down the list. This may mean that participants are satisfied with the current availability of athletic programs, or it could indicate that popup event participants were not interested in athletics when compared to other opportunities. Figure 3.1 details the Top 15 program opportunities. The full results are shown in Appendix A.

Facilities were prioritized using the same method as program opportunities. Options for facilities was also extensive, with 67 types of facilities to choose from. A farmers market, paved walking and hiking paths/trails, boardwalks, canoe/kayak blueways and fishing rose to the top of most-wanted facility types. Figure 3.2 details the Top 15 facility opportunities, and the full results are show in Appendix A.


Over a period of two days, workshops were held with members of various interest groups, including those representing community and wellness hubs, partner group needs, accessibility and inclusion, environmental sustainability, park and trail buildout, and big ideas. One hundred forty-eight individuals participated in these sessions. These focus groups provided information on utilization of city facilities, interaction with Department staff, visions for program growth, and collaborated with City staff to achieve Departmental goals.
Focus group workshops were held in March 2021 with the following focus groups:
• Community and Wellness Hubs
• Partner Group Needs
• Accessibility and inclusion
• Environmental Sustainability
• Park and trail buildout
• Big ideas
These focus groups provided more specific information on opportunities for and limitations of the current park system. Notes from these workshops can be found in Appendix E.

The Community and Wellness Hub (CWH) focus group gathered to discuss how the Lynchburg community could collaborate on expanding community wellness. Over 25 organizations were represented in this focus group some of which included Lynchburg Human Services, Lynchburg Public Library, Lynchburg Parks and Recreation Department, Lynchburg City Schools, Virginia Department of Health (VDH), Central Virginia Workforce Development, members of the Food Insecurity taskforce, Live Healthy Lynchburg, Centra, and Johnson Health. The inclusion of different neighborhoods, the Community Access Netork, the variety of interested organizations, the breadth of activities, trust, and outreach were several of the strengths listed by the CWH focus group.
The focus group also listed weaknesses that are impediments to expansion of community hubs. Redundancies, overloading of centers, lack of awareness, a digital divide, and limited connectivity were listed as a few of the barriers to establishing effective wellness hubs.
Four specific threats were identified by the CWH focus group representatives. These threats are:
• Lack of money
• Not focusing on a specific outcome
• Not enough people/time
• Program planning challenges
While these issues are significant, the group also listed many opportunities to address these threats and weaknesses. These opportunities included:
• Access to medical, nutrition, physical activities
• Holistic health delivery
• Rotating mental health services
• Transportation assistance
• Educational opportunities and assistance (i.e., financial literacy, healthcare literacy, parenting support, etc.)
• Satellite clinics
• Support groups
• Guide to available resources
• Partnership with Lynchburg city schools
• Increased collaboration with other organizations
A key takeaway was that the neighborhood centers don’t need to physcially expand to house satellite social services, police departments, libraries, and the Virginia Department of Health. Instead, a navigator can be positioned in neighborhood centers to connect residents with needed services.
The community wellness hub focus group highlighted many unique goals and opportunities for the City of Lynchburg to consider. Using park facilities as conduits for social services has been identified as a top goal for the Department.

The Partner Group Needs focus group included representatives from the City of Lynchburg, the Lynchburg Parks and Recreation Department, Thomas Road Baptist Church, youth sports partners, Hill City Master Gardeners, Central Virginia Master Naturalists, Natural Bridge Appalachian Trail Club, Bee City, 7 Hills Art Club, various Friends groups, college and university partners, Renaissance Theatre, and various volunteer groups.
Partner groups discussed threats to parks and recreation service delivery to residents of Lynchburg. The threats included:
• Department competition
• Internal resistance to change
• Competition for limited resources
• Climate change
• Failing infrastructure
• Lack of economic development
• Housing costs and gentrification
• High poverty rate
• Crime/Vandalism
• Resistance to change
• Impacts from development
• Politics
The Accessibility and Inclusion focus group gathered to discuss the strengths and weaknesses of the Lynchburg parks and recreation department regarding accessibility. Some of the strengths included:
• Having community centers in multiple neighborhoods

• ADA ramp access and parking access
• Red Wagon food program
• Customized programming for various mobilities
• Partnership with University of Lynchburg
• Small and low-cost programming
• Current upgrades to community centers
• Trails remained open during the COVID-19 pandemic
• The 32-page Parks and Recreation guide listing facilities and programming
In addition to these strengths, the Accessibility and Inclusion focus group discussed opportunities to help strengthen the department services for the community such as making residents feel welcome, placemaking, separating trails (low impact versus high impact), replacing hardscape with green space, providing options for virtual community center programming, increasing outreach, taking advantage of strategic partnerships (e.g., Liberty University, AARP, etc.), seeking out sponsorships for programming, conducting technology tutorials, and partnering with adjacent governments.
This group also shared their concerns including senior centers not being stops on public transportation routes, and distances to bus stops. Trails tend to service a wide variety of users (children, bicyclists, runners, parents with strollers, etc.). Crime at Miller Park was raised as a concern (see Appendix F for confirmation of crimes in Miller Park). Aligning hours of operation with community need was discussed, as was, the need for additional ADA accessible playgrounds. Safety concerns were also raised at threats. Some other threats to the parks and recreation department that were discussed by the group included industry competition, staffing constraints, state and federal regulations, lack of brand awareness, minimal community involvement, and lack of state-of-the-art facilities.
The Environmental Sustainability (ES) focus group included representatives from over 20 organizations some of which included the City of Lynchburg, Lynchburg residents, Central Virginia Community College, Bee City, Hill City Master Gardeners, Blue Ridge Conservancy, Lynchburg Bird Club, Lynchburg Grows, Randolph Environmental Club, University of Lynchburg Environmental Sustainability Society, and Get Greener Lynchburg. This focus group met in March 2021 to discuss environmental issues and sustainability goals. Bee City, Tree City, Lynchburg’s trails, river access, greenspaces, connectivity, teaching gardens, the James River Heritage Trail, outreach from the Department to the community, stewardship, and resident care and commitment were some of the strengths of the community that the focus group discussed.
Some of the concerns that were discussed included:
• Trash and recycling challenges
• Drainage issues
• Food deserts
• Growth rate impact
• Urban tree policy
• Sedimentation and stormwater management
In addition to these strengths and weaknesses, the ES focus group mentioned several opportunities including planting native trees on Percival’s Island, green infrastructure, considering a plastic bag tax, a whitewater park, sustainability education opportunities, Safe Routes to Schools, trail connectivity to neighborhoods, and invasive species management. Economic development, flooding, invasive species, and a lack of racial diversity in stakeholders were discussed as threats to environmental sustainability goals.
The group also developed some recommendations to consider going forward. They included:
• Develop Tree Replacement Strategy
• Development of a Land Conservation and Stewardship Advisory Board
• Change city code regarding tree harvesting
• Use more green infrastructure like solar installations in parks and sustainable erosion and sediment control measures

Representatives from the City of Lynchburg Department of Parks and Recreation, Public Works Department, Community Development, and the City Manager’s Office met in March 2021 to discuss park and trail buildouts.
Strengths included:
• People and expertise
• Public support
• Donations and volunteers
• Trails
• Athletic fields
• History
• Land distribution
• Master plans
• Various funding sources
• Longevity of institutional knowledge
In addition to strengths, the Park and Trail Buildout focus group discussed weaknesses including competing municipal needs, funding, hierarchy, climate impacts, geography, communication, and connectivity. Threats to this focus group included lack of staffing, delays in projects, and misalignment of responsibilities. Opportunities, such as communication and outreach, assets, partnerships, demonstrating economic benefits of parks, and grant possibilities were identified as ways to combat these weaknesses and threats.
A Big Ideas focus group met to discuss game-changing ideas that would dramatically change recreation. The big ideas that came from this session included:
• Create a whitewater course
• Create a Vision Plan for the James River
• Create a Lynchburg loop trail
• Bicycling ideas
• Create a new pump track

• Expand single-track mountain bicycle trails
• Host a free bicycle exchange
• Address flooding at Peaks View Park and along other trails
• Add an environmental education center at Ivy Creek Park
• Add a fun passport system for experiences
These “big ideas” are major initiatives that would function as regional attractions for visitors to Lynchburg for unique and one-of-a-kind opportunities. The James River looms large in this discussion and is a tremendous resource to leverage in a way that respects the resource while improving river access.
Pump track
The public engagement effort for the master plan successfully involved residents in numerous ways. The community survey provided detailed information regarding levels of utilization and the value of recreational services. Pop-up events provided insight on the program and facility needs of the community and the six focus groups provided the planning team with a clearer understanding of the strengths, weaknesses, opportunities, and threats facing various park user groups and partners.
The following themes were common among all the public engagement effor ts.
• Citizens value the City of Lynchburg Department of Parks and Recreation.
• Better communication and marketing are needed.
• Walking and biking on trails is highly desired.
• Natural resources are highly valued.
• Social infrastructure provided through community wellness hubs is a priority.
• There are areas in the City of Lynchburg where new parks and trails are needed. Robust citizen participation in this effort demonstrates the level of support the Department has within the City of Lynchburg. Comments and feedback were offered in a cooperative and constructive spirit and should be received in that manner. Ideas shared in the public engagement sessions were instrumental in forming the recommendations contained in this master plan.
THIS PAGE INTENTIONALLY LEFT BLANK
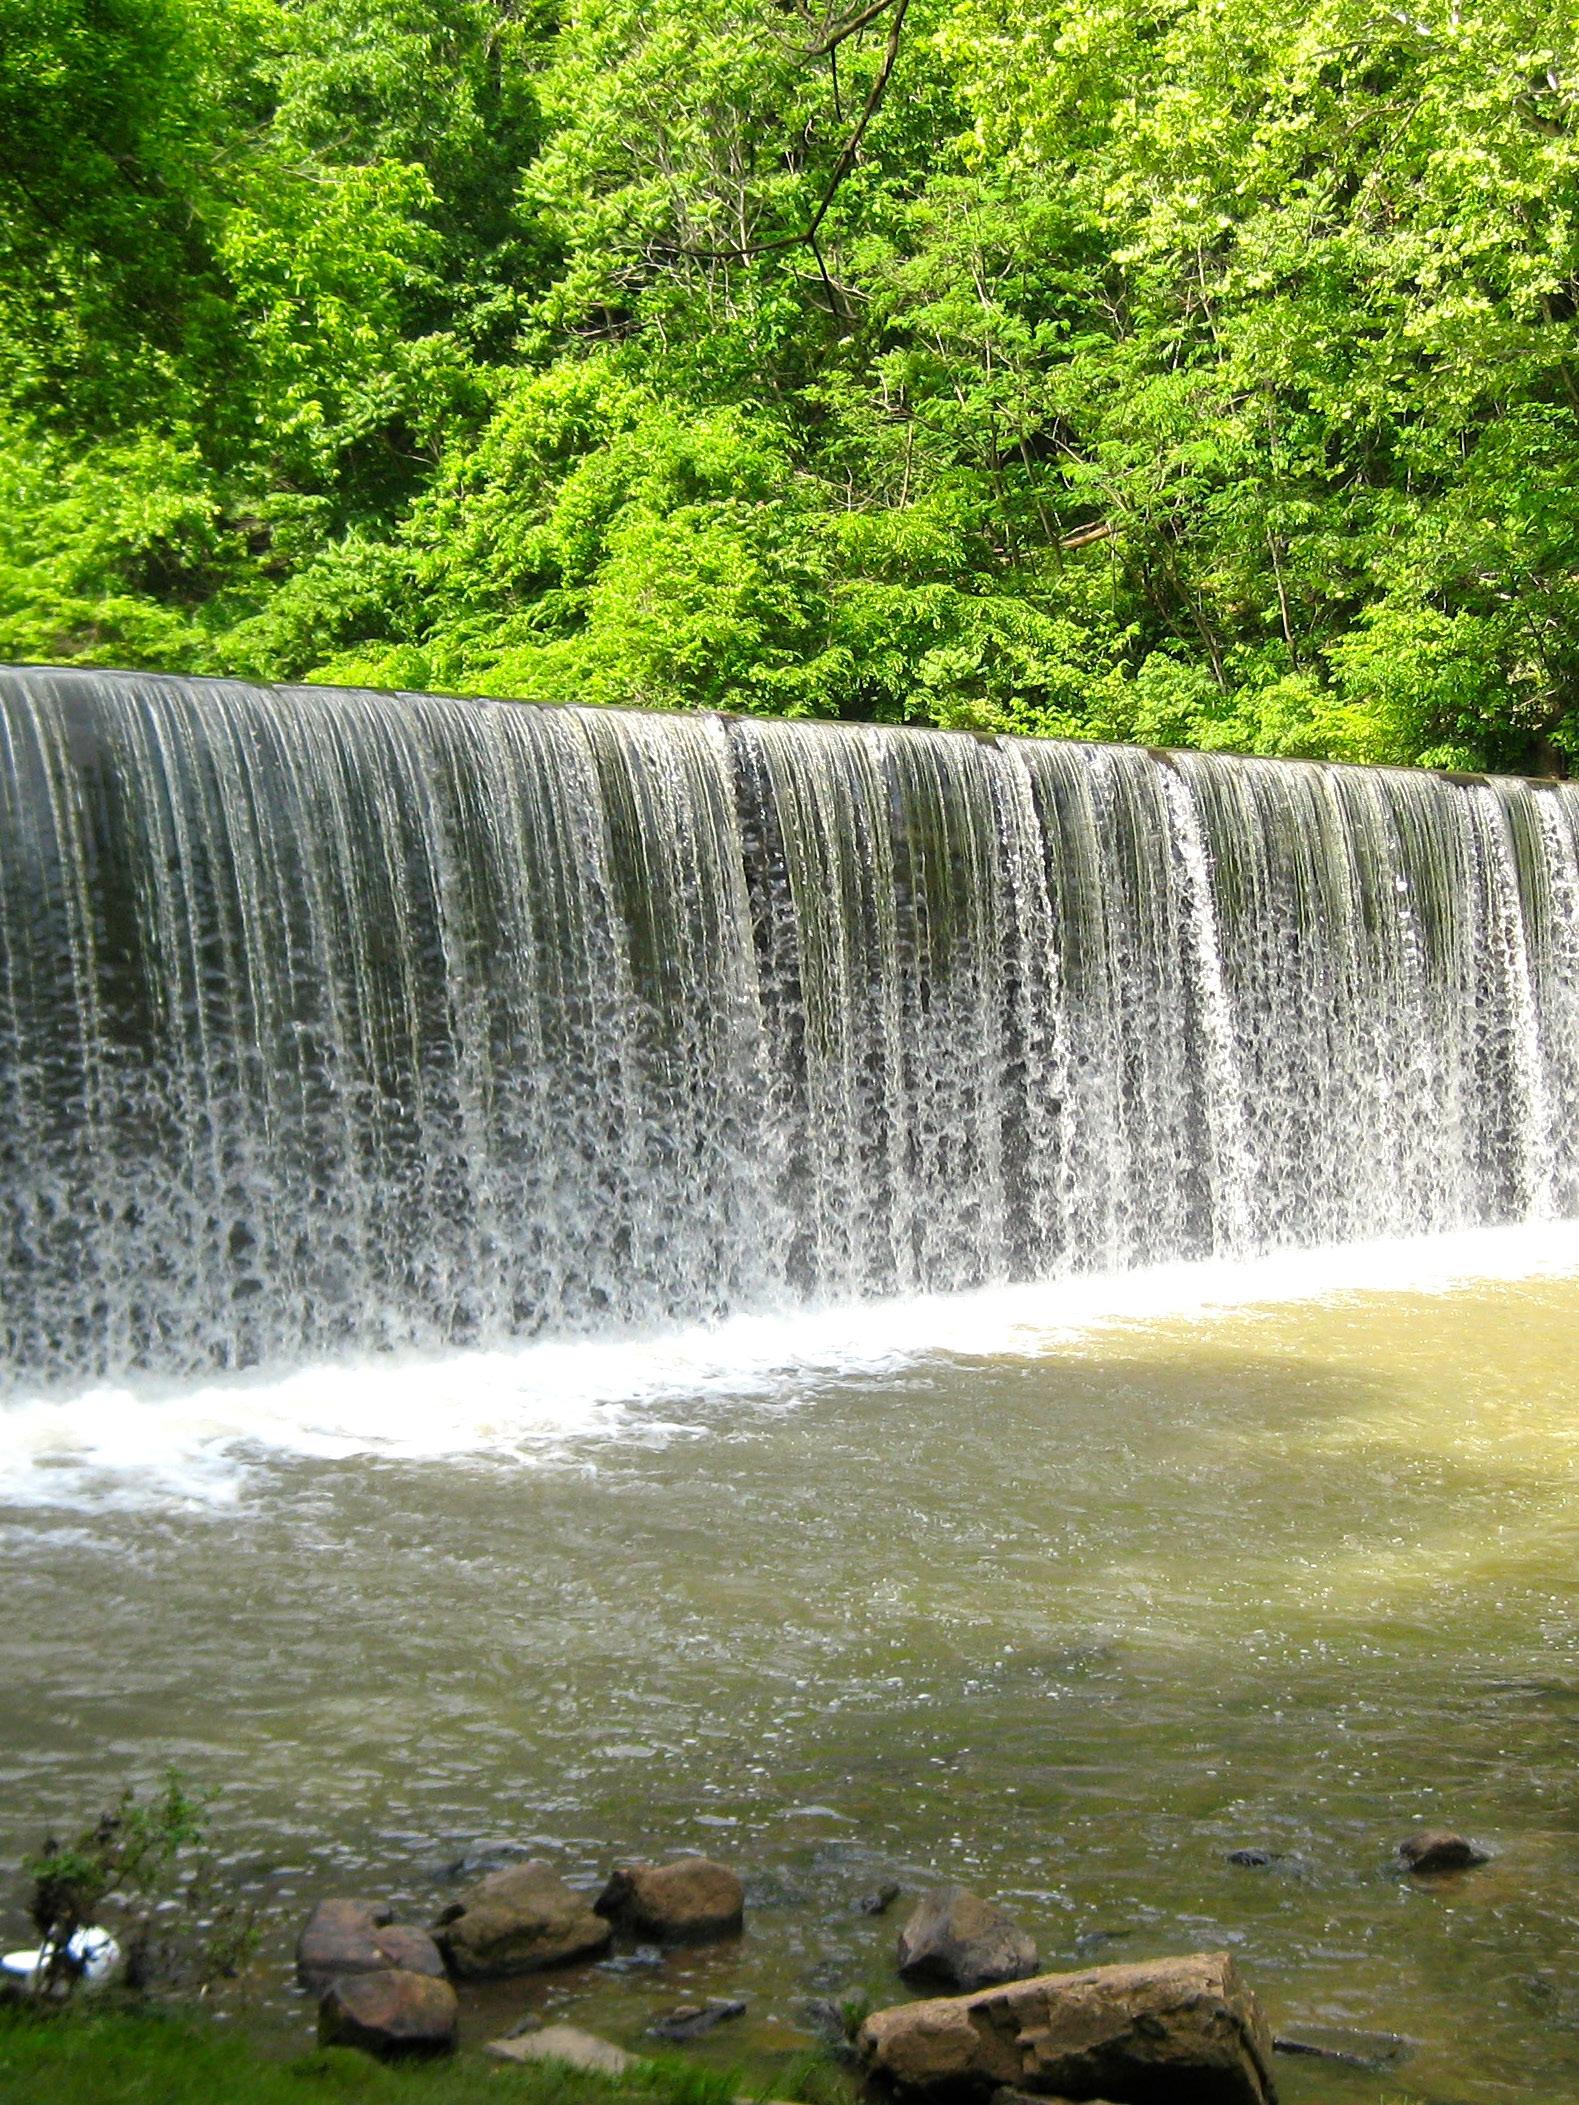
 Blackwater Creek, photo by David Murphy
THIS PAGE INTENTIONALLY LEFT BLANK
Effective service delivery is a critical component to the success of park and recreation providers. Understanding where services are available and how to best facilitate public access allows providers to efficiently deliver recreation opportunities in an equitable manner for the community’s benefit. To perform an assessment of a park system’s service, several tools are used to determine the status of the overall system and how to improve the system going forward.
Categorizing facilities into park typologies allows the planning team to assess the overall diversity and distribution of facilities throughout the community. Benchmark comparisons against national standards allows the planning team to identify surpluses or deficiencies in facility types and establishes a point of reference for decision makers. The National Park and Recreation Association (NRPA) collects and maintains a database of standards for park improvements and infrastructure. Next, a gap analysis is performed to determine if there are any areas in the community that are lacking in service coverage. Finally, a connectivity analysis is performed to determine if facilities are accessible to create an overall network of recreation services. This collective information allows the planning team to develop strategies for enhancing the current service delivery system and address any deficiencies identified.

In 1995, the National Recreation and Parks Association (NRPA) published Park, Recreation, Open Space and Greenway Guidelines by James D. Mertes, Ph.D., CLP and James R. Hall, CLP. The book outlined a template for typical park classifications, number of acres that a park system should have, and recommended service levels based on population size. Strictly intended as a guideline, the book does not consider the unique character of a place. Local trends and popularity of some activities often dictate a greater need for specific facilities. The guidelines outlined in Park, Recreation, Open Space and Greenway Guidelines serve as a good baseline for determining a minimum standard for a parks system. These guidelines, along with individual park assessments, and community input were used to develop service standards for the City of Lynchburg.
Critical to the service delivery of any recreation system is the identification of the four basic park categories:
• Mini park
• Neighborhood park
• Community park
• Regional park
Beyond these four basic park types are:

• Special-Use park
• Sports park/complex
• Natural area/preserve
• Greenway
• School park
• Private park/facility
Each park is classified based on types of amenities, size, service area, and facility access.
Table 4.1 shows a description of NRPA park classifications along with information on desirable size and service area criteria.
Mini Park
Neighborhood Park
Small parks with limited activity that should provide seating, landscape and possibly a playground, community garden or other passive recreation activities
Area for more intense recreational activities, such as playing fields, larger playgrounds, shelters, trails, swimming pools, restroom, etc.
5 acres or less ¼-mile service radius
5 to 20 acres ½-mile service radius
Community Park
Regional Park
Special-Use Park
All-inclusive facility that provides a mix of active and passive activities and attracts users of all ages, from sports fields to a community center
Unique outdoor recreation area with various amenities, which may include boating, fishing, swimming, camping, but may also include a water park, etc.
20 to 75 acres
1-mile to 3-mile service radius
50 to 250 acres Varies
Special-use parks are designed to meet the needs of a specific user group, such as an aquatic center, golf course, zoo or a museum Varies Varies
Sports Park/ Complex Parks that are dominated by athletic facilities Varies Varies
Natural Area/ Preserve
Greenway
School Park
Land with natural resources, historic landscapes, visual beauty, biodiversity, etc. Varies Varies
Linear corridors that loop and/or link to other amenities
50-feet wide ½-mile service radius
Typically found at middle and high schools with youth athletic fields that support team sports Varies Varies
Source: Table adapted from Mertes, J.D. and J.R. Hall. Park, Recreation, Open Space, and Greenway Guidelines. Alexandria, VA: National Recreation and Park Association, 1995
The following gives descriptions of the different park and facility types common to a park system.
The smallest type of park, a mini park, is typically less than five acres. These parks are designed primarily to attract residents who live within a quarter mile of the park. Vehicle parking facilities are typically limited or not provided. Mini park service levels range from 0.25 to 0.50 acres per 1,000 residents. Size normally prescribes these parks to be passive, limited-activity facilities. Common elements include benches, playgrounds, and tables in an attractively landscaped setting. The parks are sometimes themed to blend in with the surrounding neighborhood. Designs sometimes match the existing homes, fencing, sidewalk pavers, etc. A park of this size is not developed with fields for league play or community-wide events.
Neighborhood parks are found in most county and city systems. These parks normally include two to ten acres and typically serve a population living within a half-mile of the park. Neighborhood parks concentrate higher volume recreation activities and facilities into a limited amount of space. Facilities typical for this park classification include:
• Parking facilities
• Playgrounds
• Playing fields
• Restrooms/Concessions
• Shelters
• Swimming pool
• Walking paths
Vehicular parking is necessary for this park classification due to its scope of activities and size. The standard for parking is a minimum of seven spaces for the first 10 acres and one additional space for each acre over 10. This may vary based on intended activities and program appeal. If team sport facilities or distinctive features (such as a swimming pool) are included, 40+ parking spaces per field will be needed.
The scope of people served by a neighborhood park can vary based on densities and the number of other parks available. Typically, one neighborhood park should serve between 10,000 and 20,000 residents, or one to two acres per 1,000 people. Many neighborhood parks are less than five acres and typically do not include athletic fields.
Community parks are needed within a system to ensure that the recreational needs and interests of all users are met. This type of park expands beyond a local neighborhood and may include several neighborhoods. The concept for community parks is to include a “onestop-shop” for all recreation users. A community park should include a mix of active and passive activities and attract users of all ages. From sports fields to a community center, the park should provide as many recreation and support services as possible. A park of this size and scope commonly includes 30 to 50 acres. Community parks have both day and night activities. Large facilities, such as an indoor fitness/recreation center or multi-field sports complex, can be placed in such a facility because of the amount of space available and ability to buffer from the surrounding community. The service area for such a park can vary based on the size and scope of activities offered. However, a community park may serve anywhere from 50,000 to 80,000 people or five to eight acres per 1,000 people. User analyses are often based upon a service radius, while other analyses in more urban areas may be based upon drive times.
A regional park is typically the largest park within a system. These parks are normally found in the park systems of major urban cities, highly populated communities, or communities with pockets of high populations. The size of these parks varies from a minimum of 50 to 75 acres up to several hundred acres, depending on the type of activities and the amount of use. The service radius for this park classification is related to the facilities provided in the park and the overall community composition. In many large urban systems where multiple regional parks exist, each park will serve a five-mile or 15-minute to 30-minute drive time for core recreation services. Each regional park may also serve an entire community if a unique or oneof-a-kind facility is being provided. Regional competitive sports teams are often hosted at regional parks.
Special-use parks are designed to meet the needs of specific user groups. Examples include golf courses, zoos, and museums. Special-use parks are often good revenue generators. If maintained and properly staffed, these parks can provide a substantial cash flow for the designated entity. These facilities can vary in size according to the demand and type of layout. For example, a regulation size golf course (par 72) needs at least 140 acres, while an executive style layout (par 60) requires only 100 to 120 acres based on amenities such as driving ranges and practice facilities.
Sports parks/Complexes are parks that are dominated by athletic facilities. Most of these types of parks will also include a small amount of support facilities (e.g., walking tracks, playgrounds, and picnic facilities), but the primary function of the park is to facilitate organized sporting activities. Sports parks/Complexes vary in size, depending on the types of facilities being programmed. Rectangular fields can range between 1 to 2.5 acres while individual tennis courts are not even a tenth of an acre. Once the programming needs of a sports park/complex are determined, a more accurate area requirement can be calculated.
According to the NRPA, natural resource areas are defined as “lands set aside for preservation of significant natural resources, remnant landscapes, open space, and visual aesthetics/buffering.” These lands consist of:
• Individual sites exhibiting natural resources.
• Lands unsuitable for development but offering natural resource potential (e.g., parcels with steep slopes and natural vegetation, drainageways and ravines, surface water management areas, and utility easements).

• Protected land, such as wetlands, lowlands, and shorelines along waterways, lakes, and ponds.
Acquisition of natural resource areas/preserves serves to enhance the quality of the community by maintaining a portion of its natural amenities.
Greenways have become one of the most popular family recreation activities across the country. The value of greenways in terms of recreation, education, and resource protection is invaluable. Greenways serve as links between cities, parks, schools, commercial areas, and neighborhoods. They provide a safe mode of transportation that preserves the environment.
Typically, greenways vary between 10 to 14 feet wide of paved or natural surfaces. When developing a greenway system, corridors should be identified where people will access the area easily. Greenways connect elements within the community and incorporate all the characteristics of natural resource areas. Greenway corridors should be no less than 50 feet wide (except in neighborhoods, where 25 feet may be acceptable). In his article published in 1995, Julius Fabos, a former professor of Landscape Architecture at the University of Massachusetts, divides greenways into three categories – ecological, recreational, and cultural. While each group maintains its own definition, many greenways share characteristics of each.
• Ecological greenways are typically located along natural environments such as rivers, ridgelines, and coastal areas. These trails provide connections to nature, protect and maintain biodiversity, minimize development, and provide for wildlife migration across natural and humanmade boundaries.
• Recreational greenways commonly link elements that have diverse and significant landscapes. Many connect rural areas to more urban locales and range from local trails to larger systems. Most are paved trails that accommodate pedestrians, skaters, and bicycles.
• Cultural greenways connect areas of significant historic value and culture. Economic benefits from these types of trails may be significant if linkages can be directed toward areas of commerce to provide an infrastructure for commuting.
School park sites are an excellent way to combine resources and provide accessible recreation amenities to the community. Depending on the school type,
elementary, middle, or high school, the size of the park will be dictated by the available land adjacent to the school. Typically, middle and high schools are constructed with youth athletic fields to support team sports. School parks provide the basis for developing a community park or at the very least, youth athletic fields for recreation programs. The selection of school sites is determined by the school district, as well as the countywide or citywide distribution of students. The school site selection criteria may or may not meet the needs for parkland distribution. When school park development is possible, guidelines for neighborhood and community parks should be followed to meet the needs of residents. When joint developments occur, features common to other parks in the county and surrounding cities (e.g., signs) should be used to identify the property as a public facility.
As described by the NRPA, private parks/recreational facilities meet one of the two following characteristics:
“Private Parks, such as swimming pools, tennis courts, and party houses, are generally within a residential area developed for the exclusive use of residents and are maintained through a neighborhood association. They are not, however, a complete substitute for public recreation space. Private Recreation Facilities that are for-profit enterprises, include health and fitness clubs, golf courses, water parks, amusement parks and sports facilities. Not-for-profit private providers include the YMCA, churches, and private schools and colleges that offer sports and recreation facilities.”

Evaluating the level-of-service of a parks and recreation system helps determine whether that system is meeting the needs of the population it serves. The analysis begins with a review of existing facilities (indoor and outdoor) and the level-of-service offered by the City of Lynchburg Department of Parks and Recreation. Table 4.2 summarizes the inventory of indoor and outdoor facilities located in Lynchburg. The facility inventory includes 38 park properties with a total acreage of approximately 1,009 acres and approximately 40 miles of trails, of which, 16 miles are paved and 24 are earthen.
Once the existing facilities inventory was completed, the overall number and types of facilities were compared to NRPA park metric data. NRPA collects park facility, programming, staffing, budget, and agency funding data from parks and recreation agencies across the United States. This data allows parks and recreation departments to compare facility, programming, staffing and budget information against peer agencies and can assist parks and recreation professionals in managing resources. In addition to nation-wide comparisons, the data provided by NRPA allows agencies to perform comparisons to providers with similar sizes and functions. Recreation agencies can search for comparable agencies based on population size or agency type. For the purposes of this report, the planning team utilized metrics for similarly sized incorporated municipalities.
The comparison of the Department facilities to the NRPA data revealed surpluses and deficits of city facilities. For example, the Department has ten outdoor basketball courts, whereas the average NRPA park metric based on Lynchburg’s population is nine basketball courts. Therefore, the Department has a surplus of one basketball court. While these standards provide guidance on the quantity of facilities, they should not be used indiscriminately or without understanding facility quality, location and considering public input.

While these NRPA standards are good for planning, facility preferences differ from city to city. A facility assessment provides a starting point for further investigation. To determine demand, actual scheduling of facilities should be used as well. For example, if current sports fields are constantly programmed at full capacity, additional sports fields may need to be considered.
The largest deficiencies are playgrounds (-14) and youth baseball facilities (-9). The largest facility surpluses are tot lots (+2), outdoor basketball courts (+1), youth softball facilities (+1) and a stadium (+1). Addressing facility deficiencies should be weighed against the specific needs of the community. While the comparison to NRPA data indicates a significant need for additional youth baseball fields, the Depar tment should evaluate program participation numbers to determine a more realistic facility need to support community desires. The Department should evaluate facility surpluses by determining the specific community needs. For example, a community’s need for playgrounds may be driven by specific demographics (higher levels of households with children) or ease of accessibility by reducing drive-times in urbanized areas. If the Depar tment does identify a specific facility surplus as excessive, consideration should be given for renovating an existing facility to address one of the identified facility deficits. This approach may provide significant capital savings as compared to developing additional acreage to address community needs.
Recreation centers 1.5 2 0 2 -1
Community centers 1 2 -1 2 -1 Senior centers 1 1 0 1 0
Performance amphitheaters 1 1 0 2 -1 Nature centers 0 1 -1 1 -1 Stadiums 2 1 1 1 1
Ice rinks 0 1 -1 2 -2 Teen centers 0.5 1 -1 2 -1 Arenas 0 1 -1 1 -1
Adult baseball 1 4 -3 4 -3
Adult softball 5 6 -1 7 -2 Adult soccer 5 5 0 6 -1 Basketball courts 10 9 1 10 0 Community gardens 2 2 0 2 0 Cricket field 0 1 -1 1 -1 Dog park 1 1 0 2 -1 Field hockey 1 3 -2 4 -3 Football field 1 3 -2 3 -2 Lacrosse field 1 2 -1 3 -2
Multipurpose rectangular field 3 7 -4 8 -5 Multipurpose synthetic field 0 2 -2 2 -2
Multiuse courts: basketball and volleyball 0 3 -3 4 -4
Outdoor swimming pool 1 6 -5 7 -6
Outdoor tennis courts 13 14 -1 16 -3
Overlay field 1 8 -7 8 -7
Playgrounds 8 22 -14 25 -17
Skate park 1 1 0 1 0
Tot lots 8 6 2 7 1 Youth baseball 3 11 -8 12 -9 Youth soccer 2 10 -8 11 -9 Youth softball 2 7 -5 8 -6
Source: Lynchburg Department of Parks and Recreation; 2019 NRPA Agency Performance Review
Demand for some facilities listed in the inventory may fluctuate in from today to 2030. For example, while dog parks appear to be meeting the community’s current needs, it is anticipated the city’s growth may generate a need for an additional dog park by 2030. It is also important to note that some facilities listed in Table 4.2 are typically less popular in Virginia. For example, cricket fields might be indicated as a need based on the total population. However, if there is little interest in the sport, it would not make sense to invest in that facility type.
NRPA does not address pickleball or golf in the same manner. Therefore, it is necessary to assess the Department needs for these facilities in other ways, such as the public engagement exercises described in Chapter 3: Public Engagement.
Lynchburg exceeds reported national averages of parkland acreage. NRPA reports an average of one park for every 2,277 residents served and 9.9 acres of parkland for every 1,000 residents. Based on the 2020 population estimate of 81,445 people, approximately 36 parks and 806 acres of parkland are needed to meet national averages. With 38 parks and approximately 1,009 acres of parkland, Lynchburg has met the national averages in both the number of parks and amount of parkland available.

Current population estimates and population projections for the year 2030 were used to determine current facility deficits and surpluses in Lynchburg. Currently, the Department has a deficit in approximately 65% of indoor and outdoor facilities.
Some facilities, like performance amphitheaters, could be provided by other orgnaizations. Schools facilities can be valuable partners in filling some of the deficits identified in this exercise. For example, E.C. Glass has a performance space that could serve as a community concert venue if joint use agreements are agreed to.
Currently, the Department owns and maintains 38 park sites throughout the city. In general, these facilities are in central Lynchburg. Existing park locations and park types are shown on Figure 4.1. The distribution of these facilities is driven by population density with areas of higher density having more parks, and areas with lower density having fewer. This approach continues to be an effective delivery model in that city resources are planned where areas of higher service demands are required.
Areas with a higher level of service include east and west of the Business US 460 corridor and along the James River. Conversely, areas with potentially lower levels of service include less densely populated areas outside of the US 501 corridor (see Figure 4.4 for population density).
PARK
ASSIFICAT

S
1 KE MP ER S TR E ET STA TI ON
2 AUBR E Y BAR BO UR N EI GH BO RH O O D P AR K
3 DI AMO N D H LL N EI GH BO RH O O D P AR K
4 CO LL EG E H IL L N E IG HBO R H OO D PAR K
5 V ALL EYV IE W PLA YLO T 6 KE MP ER S TATI ON P AR K 7 JACK SO N H E GH TS N E IG HBO R HO O D PAR K 8 DA NI EL S H IL L NE IG H BOR H O OD PA RK 9 CL IFFS E DG E PO CKE T P AR K
CITY OF LYNCHB URG 29 TE MP LE TO N S EN IO R CE N TER S I TE 30 BL ACKWA TER C RE E K A TH L ETI C AR E A & D OG PA RK 31 C OM MUN ITY MAR KE T P LAZA 32 C ITY S TAD IUM CO MP LE X 33 JA ME S R IV ER C AN OE R AM P 34 R O TAR Y CE N TEN N IA L R IV E RFR O N T S KATE PAR K
NEIG HB ORHOOD PARK

FOR T A VE N UE N EI GH BO RH O O D P AR K
CO LL EG E PAR K
BIG GE RS NE IG H BOR H OO D PAR K
PE R RYM ON T P AR K
FAIR V IE W H E IGH TS N E GH BO R HO O D PAR K
WES TO VE R N E IG HBO R HO O D PAR K
YO UNG E R PAR K
JEF FER S O N PAR K
HO L LIN S M IL L P AR K
RI VE R S IDE P AR K
RI VE R FR ON T P AR K
MI LLE R CE N TE R SI TE
SA N DUS KY P AR K
PE AKS V IE W P AR K
HE R ITAG E PA RK
V Y CR E EK PA RK
MI LLE R P AR K
COMMUNITY PARK 27 PE R CIV AL' S IS LA ND N ATUR AL AR EA 28 BLAC KWATE R CR EE K NA TURA L A RE A

A gap analysis is an assessment of the service areas related to parks and recreation facilities to determine if there are areas of a community that are under-served. Figure 4.3 identifies gaps in the overall service standard for these park categories: mini parks, neighborhood parks, community parks, and regional parks. Remaining park types (i.e., special-use parks, sports parks, natural resource areas, etc.) serve regional needs and as such, the service areas for these types of parks do not need to be mapped for this gap analysis.
The service area analysis begins by classifying existing parks using the park classifications previously discussed. All existing parks were classified based on NRPA definitions, park offerings, and size. Service areas for each category were assigned accordingly and population distribution was reviewed to determine if park locations are accessible to most residents.
This gap analysis identifies potentially under-served areas. These areas are described as follows and indicated with corresponding red numbers on Figure 4.4 (Lynchburg Park Gaps):
Providing additional park facilities in these areas will enhance access to recreation opportunities and offer a more consistent level-of-service across the community. This analysis identified gaps that correspond with park deserts identified by the Trust for Public Land in a previous study.
The following facility investments are recommended for consideration based on findings of the gap analysis and input received from the public through the community engagement efforts. The proposed facilities can be categorized in three categories:
Indoor Facilities
• Templeton Senior Center Expansion
• Multipurpose Indoor Recreation Center
Neighborhood Parks
• Brookville
• Beechwood Hills
• Rivermont
Community Parks
•
• Windsor Hills/Leesville Road Community Park
The addition of these facilities would diversify recreation oppor tunities where they may be limited or not available (see Figure 4.5).
A multipurpose indoor facility would provide much needed indoor courts, fitness, and wellness class spaces. Such a facility should include indoor aquatics and a child care wing. The planning team recommends such a facility be located near City Stadium near Fort Hill. A recreational site plan was previously developed for this area. This facility should be considered as a potential special-use park.
The current senior center is undersized to serve Lynchburg’s current active adult population. Additionally, the space is not suited for health and fitness classes. Securing additional property would allow for an overhaul and expansion of the current facility that will serve Lynchburg residents well into the future.
The planning team recommends considering three new neighborhood parks. Two neighborhood parks are rec ommended in southwest Lynchburg near the Timberlake/Richland/Roundelay area Another neighborhood park, Monsview Park, is recommended in the Lower Rivermont section of Lynchburg (see Figure 4.2). These neighbor hood parks are recommended to provide more passive recreation opportunities in established residential areas. They would supplement larger community parks and private recreation providers by offering a smaller, more intimate public space for nonprogrammed recreation activities such as walking, picnicking, etc. These areas were identified as areas of interests in the community engagement process and were previously highlighted by the Trust for Public Land as park deserts.
Two future community parks are recommended. The Tyreeanna/Pleasant Valley area has identified the need for a public park and trail system in its Neighborhood Plan. The opportunity to reclaim a former landfill site for a large community park exists here and may represent an opportunity to effect positive change for the area. The Tyreean na/Pleasant Valley neighborhood is currently limited on access to public parks. The addition of a community park in this area would address this concern.
A second community park could be located in the southern portion of Lynchburg in the Timberlake/Cornerstone/ Wyndhurst area. Most of the recreation facilities in this area are privately owned. For example, the Lakeland Lake property, which includes a lake, a basketball court, a tennis court, a dock, and a small beach, serves neighborhood residents and escorted guests only. A similar passive recreation area is owned by the Cornerstone Property Own ers Association. The City should explore opportunities to partner with owners of existing facilities and/or develop a new facility to serve this area.
Source: Lynchburg Parks and Recreation

Figure 4.3: Lynchburg Gap Analysis Source:
PARK CL ASSIFICAT ION S
MINI PARK
1
AUBR E Y BAR BO UR N EI GH BO RH O O D P AR K
DI AMO N D HI LL N EI GH BO RH O O D P AR K
CO LL EG E H IL L N E IG HBO R H OO D PAR K
V ALL EYV IE W PLA YLO T
KE MP ER S TATI ON P AR K
JACK SO N H E IGH TS N E IG HBO R HO O D PAR K
DA NI EL S H IL L NE IG H BOR H O OD PA RK
29 TE MP LE TO N S EN IO R CE N TER S I TE 30 BL ACKWA TER C RE E K A TH L ETI C AR E A & D OG PA RK 31 C OM MUN ITY MAR KE T P LAZA 32 C ITY S TAD IUM CO MP LE X 33 JA ME S R IV ER C AN OE R AM P 34 R O TAR Y CE N TEN N IA L R IV E RFR O N T S KATE PAR K
9
FOR T A VE N UE N EI GH BO RH O O D P AR K
CO LL EG E PAR K
BIG GE RS NE IG H BOR H OO D PAR K
PE R RYM ON T P AR K 14 FAIR V IE W H E IGH TS N E IGH BO R HO O D PAR K 15 WES TO VE R N E IG HBO R HO O D PAR K 16 YO UNG E R PAR K 17 JEF FER S O N PAR K
NEIG HB ORHOOD PARK 18 HO L LIN S M L L P AR K 19 RI VE R S IDE P AR K 20 RI VE R FR ON T P AR K 21 MI LLE R CE N TE R SI TE 22 SA N DUS KY P AR K 23 PE AKS V IE W P AR K 24 HE R ITAG E PA RK 25 IV Y CR E EK PA RK 26 MI LLE R P AR K
MINI PARK 1/4 MI
NEIG HB ORHOOD PARK 1 /2 MI

COMMUNITY PARK 27 PE R CIV AL S IS LA ND N ATUR AL AR EA 28 BLAC KWATE R CR EE K NA TURA L A RE A
NAT UR AL RESOURCE AREA
20 Figure 4.4: Lynchburg Park Gaps
3
21
28
1 KE MP ER S TR E ET STA TI ON
AUBR E Y BAR BO UR N EI GH BO RH O O D P AR K
DI AMO N D H LL N EI GH BO RH O O D P AR K
CO LL EG E H IL L N E IG HBO R H OO D PAR K
V ALL EYV IE W PLA YLO T
JACK SO N H E GH TS N E IG HBO R HO O D PAR K
CL IFFS E DG E PO CKE T P AR K MINI PARK
FOR T A VE N UE N EI GH BO RH O O D P AR K
CO LL EG E PAR K
BIG GE RS NE IG H BOR H OO D PAR K
PE R RYM ON T P AR K
FAIR V IE W H E IGH TS N E GH BO R HO O D PAR K
WES TO VE R N E IG HBO R HO O D PAR K
YO UNG E R PAR K
JEF FER S O N PAR K
COMMUNITY PARK
RI VE R FR ON T P AR K
MI LLE R CE N TE R SI TE
SA N DUS KY P AR K
HE R ITAG E PA RK
MI LLE R P AR K
NAT UR AL RESOURCE AREA
PE R CIV AL' S IS LA ND N ATUR AL AR EA
BLAC KWATE R CR EE K NA TURA L A RE A
4 CO LL EG E H IL L N E IG HBO R H OO D PAR K Figure 4.5: Lynchburg Proposed Service Areas
MINI PARK
BL ACKWA TER C RE E K A
V ALL EYV IE W PLA YLO T
KE MP ER S TATI ON P AR K
DA NI EL 'S H IL L NE IG H BOR H O OD PA RK
ON T P AR K
FAIR V IE W H E IGH TS N E IGH BO R HO O D PAR K
WES TO VE R N E IG HBO R HO O D PAR K
AUBR E Y BAR BO UR N EI GH BO RH O O D P AR K 1/2 M I
2 SPECIAL USE PARK SERVICE AR EAS MINI PARK 1/4 MI NEIGHBORHOOD PARK 1/2 MI COMMUNITY PARK 3 MI FUTURE SPECIAL USE PAR K
YO UNG E R PAR K
JEF FER S O N PAR K
D AMO N D HI LL N EI GH BO RH O O D P AR K FUTURE NEIG HBORHOOD PARK 3 MI FUTURE COMMUNITY PARK 39 TYR E E AN NA /PL EA SA NT VAL LE Y 40 FU TU RE CO M MUN ITY PAR K 5 MI 41 FU TU RE I ND O OR FA CIL ITY Source: Lynchburg Parks and Recreation
3 FUT URE S ERVICE AR EAS 35 BR O O KVI LL E 36 BE E CH WO OD H IL LS 37 R IV E RM O NT 38 TE MP LE TO N EX TEN S IO N
Trails and greenways are a critical component of Lynchburg’s park system. They are highly valued by the community as described in the Public Engagement section of this repor t. There is a desire to expand the trail system, particularly paved trails, to new parts of the community. At the same time, there is a pressing need to maintain these trails to a higher standard. Storm events and significant rainfalls have damaged stream crossings at times in the past. These repairs are difficult at times and can be costly in terms of time and expense. Considering how important trails are to the community, trail maintenance should be included in the Department’s capital budget.
The National Recreation and Parks Association (NRPA) has established the “three pillars,” which are guiding principles for creating a better life for everyone to build strong, healthy, and resilient communities. One of these pillars, equity, establishes the principle of ensuring all people have fair and just access to the benefits of highquality, local parks and recreation. One way that parks and recreation providers strive to provide equitable service is to enhance the overall connectivity between public spaces, schools, places of business, and residential areas. Over the last few decades, community planners across the nation have recognized the need to facilitate this access through safe pedestrian corridors.
Comments related to trail connectivity were some of the most prevalent suggestions mentioned on the community engagement website. Commentors often gave specific destinations or neighborhoods where they feel additional trails are needed. Suggestions ranged from regional in scope to very local and provided good insight on how Lynchburg residents want to use their trail system. The Downtown 2040 Master Plan includes proposed trails expected to be completed by Community Development and include improvements for pedestrian connections to Amherst County via the John Lynch Memorial Bridge and the Carter Glass Bridge.
The planning team was made aware of the community desire to develop “inner” and “outer” loops of trails to serve the community.
The inner loop would provide greenway connections to neighborhoods, parks, and other valuable destinations within interior portions of Lynchburg.
The planning team has identified approximately seven miles of new paved trail alignments for the City to consider

as part of what could be the first phase of inner loop improements. The proposed trails will extend existing paved greenway trails and make important connections between some of Lynchburg’s most popular parks. Construction of these recommended greenway segments could be the next step in creating a trail loop through the City. These segments utilize stream corridors where possible. The three segments discussed in this plan are:
• Peaks View Park to Ivy Creek Park along Ivy Creek (1.9 miles) (Peaks to Creeks Trail)
• Langhorne Trestle to Peaks View Park along Ivy Creek (3.2 miles)
• Sandusky Park to Shirley Road Terminus/College Lake (1.8 miles)
The second phase of improvements for the Inner Loop include over eight miles of new greenways and bicycle/ pedestrian improvements in three segments. These routes build on Phase 1 and are described as follows:
• Ivy Creek Park to Sandusky Park (2.4 miles)
• Sandusky Park to Heritage Park along Burton Creek (2.6 miles)
• Complete streets redesign of Fort Avenue to include bike lanes and improved sidewalks (3.6 miles)
The route from Ivy Creek Park to Sandusky Park is complicated by the need to cross the Lynchburg Expressway and will need additional consideration. Roadway adjacent greenways may be a good option for a portion of this segment.
The segment from Sandusky Park to Heritage Park provides opportunities to connect three public schools with greenways. These schools would be Sandusky Middle School, Sandusky Elementary School, and Heritage High School. Safe Routes to School grants may assist in the construction of greenways that serve schools in this way.
Fort Avenue is a recognized transportation corridor that connects residents with multiple parks, schools, community centers, and transit stops. The current four-lane street configuration could be modified through a “road diet” that would provide a center turn lane, two travel lanes, two dedicated bike lanes, a curb and grass planting strip, and continuous sidewalks within the existing right-of-way. Traffic counts and other planned transportation projects should be considered as improvements to Fort Avenue are considered and move through the design process.
If constructed as proposed, trail users could access the trail system at Heritage Park, travel north past Sandusky Elementary School and Sandusky Middle School, continue to Ivy Creek and Peaks View Parks before passing near Linkhorne Middle School, and continuing through the Blackwater Creek Natural Area. From this point, the trail offers two routes for returning to Heritage Park. The user could follow the trail through the Blackwater Creek Athletic Area to Sandusky Park and back to Heritage Park. Alternatively, the user could take a longer route that travels by Valleyview Playlot, and Kemper Street Station. From here, pedestrian and bicycle improvements on Fort Avenue would provide a safe and enjoyable route past the City Stadium Complex and Fort Hill Community School before returning to Heritage Park. The full mileage of the inner loop is estimated at approximately 15.5 miles.
The Outer Loop is intended to function as more of a regional trail that will provide opportunities to connect to destinations outside of the city limits like Thomas Jefferson’s Poplar Forest estate.
The Outer Loop has been discussed for several years and the City of Lynchburg has included it as a proposed future trail on previous maps. The planning team used this reference as a starting point with the goal of connecting the inner loop trails proposed in this document to a proposed outer loop. The corridor for the outer loop was developed by identifying stream corridors, utility easements, and road rights-of-way that would allow for the
construction of a trail meeting the intent of previous planning efforts. The updated route for the outer loop is shown with the proposed inner loop trails on Figure 4.13.
Beginning where two Inner Loop segments are proposed to converge near Sandusky Park, the proposed Outer Loop meanders to the southwest along Tomahawk Creek until it reaches Enterprise Drive near the Wyndhurst development, which includes residences, dining, medical, and professional services. An entrance to Poplar Forest is directly across Enterprise Drive.
From this point, the planning team proposes the Outer Loop should follow Enterprise Drive with a roadside pave trail to accommodate both pedestrians and cyclists. It appears this portion of Lynchburg is developing rapidly and using existing rights-of-way may be the most cost-effective way to provide trail connectivity in this area. The City may also find opportunities to work with the development community to provide trails in this area that complement the intent of the routes shown here. Greenways often provide benefits to developers as well as the community if mutually beneficial arrangements can be identified through the development process.
The trail should turn away from Enterprise Drive near Laxton Road near Brookville High School while roughly following the city limits of Lynchburg. Crossing Timberlake Road, the route continues to Greenview Drive where the planning team anticipates a roadside greenway trail through this corridor. The Outer Loop could tie into the Cornerstone development providing connections to more commercial businesses and destinations while serving residents in this area.
The route for the Outer Loop then turns to the northeast along Leesville Road. From here the greenway would bounce between residential and commercial areas of the City before connecting to the Fairview Heights Neighborhood Park. The trail then continues to the Jackson Heights Neighborhood Park. At this point a connector could be provided to reach the previously discussed Pleasant Valley Greenway.
From Jackson Heights Neighborhood Park, the Outer Loop continues north to the riverfront and a crossing to Percival's Island. Crossing the river in this location is complicated by the CSX rail yard. However, the ridges along Concord Turnpike near Winston Ridge Road and Fishing Creek may provide opportunities to locate a greenway bridge that spans the river and the railyard.
Once the greenway reaches Percival’s Island, the Outer Loop is completed. The planning team has estimated the length of the Outer Loop at approximately 15.2 miles. This mileage will most likely change as segments are

designed and alternate routes are identified. The intent of this section is to provide a framework for the overall route and potential connections that will enrich experiences for trail users of all types.
In addition to the Tyreeanna area having little park access, there is no trail access at all. The Pleasant Valley Greenway would connect the neighborhood to the landfill park via a trail and could be part of a future regional connection with Amherst, connecting back to Downtown Lynchburg. See pages 48-49 of the Tyreeanna and Pleasant Valley Neighborhood Plan, and page 89 of the Downtown 2040 plan.
The long-term goal of the greenway is to link destinations within Tyreeanna/Pleasant Valley and establish connectivity to other parts of the City. The proposed route begins on Holcomb Path Road, crosses U.S. Route 29/U.S. 460 Bypass and crosses through the neighborhood to the east side of the river to link to the James River Heritage Trail. The Tyreeanna/Pleasant Valley Greenway is to be completed in four (4) phases:
Phase 1 converts two underutilized lanes on Pleasant Valley Road into a multipurpose pathway. This phase includes improvements starting at the west end of Pleasant Valley Road up to the bridge where the road crosses U.S. Route 29. This portion of the greenway will create opportunities to extend connections to future recreation sites and residential areas. Public art and streetscape elements can highlight the neighborhood’s history and brand in portions of the greenway near the proposed commercial area.
Phase 2 extends the greenway northwest along a new residential road and onto Tyreeanna Road on an off-street alignment.
Phase 3 connects the greenway system to Amherst County by providing a safe route for pedestrians and cyclists under the Monacan Bridge. The concept also proposes a trail link to the James River Heritage Trail in Downtown Lynchburg and the Pleasant Valley Historic Mile.

Phase 4 links the north and south sides of the neighborhood, currently split by Route U.S. 460 via a multi-modal bridge.
Phase 1, Source: Tyreanna and Pleasant Valley Neighborhood Plan
A fitting example of a project that can bring much-needed connectivity to an existing neighborhood is the Tinbridge Hill Trail Spur. This trail connector and overlook is currently in development and will provide access to the Blackwater Creek Bikeway. For more information, see https://issuu.com/cityoflynchburg/docs/tinbridge_hill_plan.

The Downtown 2040 plan, adopted in 2018, identifies two key pedestrian loops (see Trail Network map below). The first loop circulates through the central business district along 6th street, 12th street, and the Bluffwalk. The second loop crosses the James River and connects to Riveredge Park in Amherst County via the John Lynch Bridge. The second loop also includes a proposed pedestrian bridge to be constructed beneath the Carter Glass Bridge.

Also shown on the Trail Network map is the Canal Park Bike Trail Connection. The Dowtontown 2040 mentions using remnants of the Kanawha Canal and aquaduct that ran through downtown Lynchburg in the 1840s to create Canal Park. A master plan was created for Canal Park in 2015, which recommends the canal be repurposed as a continuation of Riverfront Park. Additional concepts for the park include adding amenities to interpret the industrial history of the land, enhancing the Rotary Centennial Riverfront Skatepark with visitor seating, and providing an additional outdoor play area for visitors of Amazement Square, the children's museum located directly adjacent to the proposed park.
The two loops proposed in the plan hope to connect people to under-visited portions of downtown in an effort to support downtown businesses, drive residential development, and enhance tourism within the City.
These recommended segments that will further develop the Inner Loop are illustrated in Figure 4.6 through Figure 4.12. These maps demonstrate how the development of these segments will increase connectivity to several parks, schools, and residential areas, while expanding the trail network into central and southern portions of Lynchburg.
Over 33 additional paved miles of trail are proposed in this plan. This is largely due to the value the community places on the trail system and the desire to expand and improve trail experiences. It is clear trails and greenways will continue to be a hallmark of Lynchburg’s recreation portfolio.
AUBR E Y BAR BO UR N EI GH BO RH O OD PA RK
DI AMO N D H LL N EI GH BO RH O O D P AR K
CO LL EG E H IL L N E IG HBO R H OO D PAR K
VA LL EYV IE W P LAY LO T
KE MP ER S TAT ON P AR K
JACK SO N H E IGH TS N E IGH BO R HO O D PAR K
DA NI EL S H IL L NE IG H BOR H O OD PA RK
CL IFFS E DG E PO CKE T PA RK
FOR T A VE N UE N E GH BO RH O OD PA RK

CO LL EG E PAR K
BIGG E RS N E IG HBO R H OO D PAR K
PE RR YM ON T P AR K
FAIR V IE W H E IGH TS N E IGH BO R HO O D P AR K
WES TO VE R N E IGH BO R HO O D P AR K
YOU NG ER PAR K
JEF FER S ON PAR K
HO L LIN S M IL L P AR K
RI VE R SI DE P AR K 20 RI VE R FR ON T P ARK 21 MI LLE R CE N TER SI TE 22 SA ND US KY P AR K 23 PE AKS V IE W P AR K 24 HE R ITAG E PAR K 25 IV Y CR E EK PAR K 26 MI LLE R P ARK 27 PE RC IV AL' S IS LAN D N ATUR AL AR EA 28 BLAC KWATE R CR EE K N ATUR AL AR E A 29 TE MP LE TO N SE N IO R CE N TER S ITE 30 BL ACKWA TER C RE E K ATH L ETI C AR E A & D OG PA RK
C OM MUN ITY MAR KE T PL AZA
C ITY S TAD IUM CO MPL E X
JA ME S R IV ER CA NO E R AM P
R O TAR Y CE N TEN N IAL R IV E RFR O NT


For t Hi ll Com m un it y Sch o ol
San du sky Ele m en ta ry Sch o ol San du sky Mi dd le Sch o ol

Park San du sky Ele m en ta ry Sch o ol
T.C . M il le r Ele m en ta ry Sch o ol San du sky Mi dd le Sch o ol
For t Hi ll Com m un it y Sch o ol
DI AMO N D H LL N EI GH BO RH O O D P AR K
CO LL EG E H IL L N E IG HBO R H OO D PAR K
VA LL EYV IE W P LAY LO T
KE MP ER S TAT ON P AR K
JACK SO N H E IGH TS N E IGH BO R HO O D PAR K
DA NI EL S H IL L NE IG H BOR H O OD PA RK
CL IFFS E DG E PO CKE T PA RK
FOR T A VE N UE N E GH BO RH O OD PA RK
CO LL EG E PAR K
BIGG E RS N E IG HBO R H OO D PAR K
PE RR YM ON T P AR K
FAIR V IE W H E IGH TS N E IGH BO R HO O D P AR K
WES TO VE R N E IGH BO R HO O D P AR K
YOU NG ER PAR K
JEF FER S ON PAR K
HO L LIN S M IL L P AR K
RI VE R SI DE P AR K
RI VE R FR ON T P ARK
MI LLE R CE N TER SI TE
SA ND US KY P AR K
PE AKS V IE W P AR K
HE R ITAG E PAR K
IV Y CR E EK PAR K
MI LLE R P ARK
PE RC IV AL' S IS LAN D N ATUR AL AR EA
BLAC KWATE R CR EE K N ATUR AL AR E A
TE MP LE TO N SE N IO R CE N TER S ITE
BL ACKWA TER C RE E K ATH L ETI C AR E A
D
Park and recreation agencies continuously strive to provide safe, accessible, and enjoyable recreation opportunities to enhance their community’s overall quality of life. To ensure that this goal is being met, facility assessments are regularly performed to determine if a park is functioning as intended and what, if any, renovations are needed to improve the park user experience.
Facility assessments are performed in the field to review general park conditions in terms of facility age, overall safety, maintenance practices, and compliance with requirements of the Americans with Disabilities Act (ADA). This information is used by the planning team to develop recommendations for repairs and renovations, as well as establishing guiding principles to improve park quality.


Address: 109 Jackson Street, Lynchburg, VA 24504
Classification: Mini Park
Acreage: 0.92 acre
Description: The Aubrey Barbour Neighborhood Park is located at the Yoder Community Center in the Tinbridge neighborhood and was named after Aubrey Barbour, lifelong resident of the Tinbridge Hill neighborhood and 42year supervisor of the Yoder Community Center. With the dedication of the Aubrey Barbour Park in 2011, the Yoder Center received new playground equipment, landscaping, a picnic pavilion with grills, a newly resurfaced basketball court, and ADA compliant sidewalks and walkways.
Observations: This park is well organized in the way the playground area, plaza, and basketball court are layed out. The ornamental fencing delineates the boundary of the park nicely. Parking is easy to access and convenient to park amenities. Sidewalks are present in the neighborhood, but appear to be disconnected at times.
There appear to be only a couple of street lights in this area. The park may be very dark at night, which may invite unwanted activities.
Recommendations: Recommendations to consider for this park include:

• Add fully shielded light fixtures to illuminate the park without impacting neighboring residents.
• See general notes regarding ADA requirements in Appendix J.
Address: 501 5th Street, Lynchburg, VA 24504

Classification: Neighborhood Park Acreage: 0.94 acre
Description: Biggers Park is in the Garland Hill neighborhood. The shady park is completely fenced and is surrounded by an old stone wall with three access points for neighborhood residents. This neighborhood park is designed for family-friendly activities and provides recreation for all age groups. Biggers Park includes a basketball court, a picnic area, grills, and a playground.
Observations: The park fencing is not consistent in style. The main entrance to the park from 5th Street is ornamental, while the three other sides of the park are chainlink. On-street parking is informal but readily available.
ADA accessible pathways are available once inside the park. Entrances into the park may be challenging for some.
Recommendations: Recommendations to consider for this park include:
• Consider installing formal on-street parking with meters along Clay Street and Lucado Place.
• Replace chainlink fencing with an ornamental fence of appropriate height.
• Install permanent restrooms for park users.
• Add additional park lighting for security.
• Add sport court lighting to extend hours of play.
• See general notes regarding ADA requirements in Appendix J.
Address: 515 Monticello Avenue, Lynchburg, VA 24501
Classification: Special-Use Park
Acreage: 16.85 acres
Description: The Blackwater Creek Athletic Area (BCAA) and Dog Park includes Phase I of the only off-leash dog area in Lynchburg. The park includes a multipurpose lighted field that accommodates football or soccer, restrooms, and a connection to the Creekside Trail, which leads to the Blackwater Creek Natural Area.


Observations:This park was recovering from a signiicant rainfall event during the park assessment. The dog park appears to be the primary use of this site. The athletic area and mulituse field appear to be designed for less competitive play and are more appropriate for practices or unprogrammed pick-up games.
The park appears to be very low in the watershed of Blackwater Creek. Evidence of flooding was observed during the site assessment. While parks are often located in floodplains, consideration should be given to what recreational uses are most appropriate in low lying areas that may flood regularly. Dog parks and athletic fields require fencing, which can be damaged by flooding events. Flood levels on new flood maps have increased two to three feet along Blackwater Creek. There will be increases in water levels in various areas downstream from College Lake. It is understood the athletic field and dog park will be relocated. New locations for these facilities should be a priority.
Recommendations: Recommendations to consider for this park include:
• Consider rethinking this park as a natural area with an emphasis on natural floodplain restoration and protection.
• Find new locations for the multipurpose field and dog park.
• Consider the addition of canoe/kayak launches in support of blueway development.
• See general notes regarding ADA requirements in Appendix J.
Address: Trail Entrances: Ed Page – 1720 Langhorne Road East Randolph Place – 340 East Randolph Place Downtown Lynchburg – Jefferson St. and 8th St. Linkhorne Middle School – 2525 Linkhorne Drive
Classification: Natural Resource Area Acreage: 394.77 acres
Description: The Blackwater Creek Natural Area includes almost 400 acres of forested land situated within a narrow stream valley along Blackwater Creek. An extensive trail system, several miles in length, can accommodate hikers, joggers, and bikers, and is accessible in some areas. Within the natural area is the 155-acre Ruskin Freer Nature Preserve, which is a plant and animal sanctuary.
Observations: The planning team was able to experience many of the trails in the Blackwater Creek Natural Area. The trails are incredibly popular and used by a variety of trail users including cyclists, runners, walkers, and hikers. Trail lighting is very limited. The trail can seem very dark during early morning and late afternoon hours.
Land adjacent to the trail could be used for expanding single track mountain biking opportunities in the City.

Blackwater Creek is also used as a blueway both above and below the Hollins Mill Dam. Blueway users may benefit from launch improvements, stream guages, and informational signage about optimal stream conditions for paddling.
Recommendations: Recommendations to consider for this park include:
• Consider lighting or emergency call boxes for certain paved trail sections.
• Install blueway signage and improved access on Blackwater Creek where appropriate.

• Work closely with the Central Virginia Planning District to have the new Blackwater Creek Watershed blueway opportunities included.
• Work with local mountain bike partners to expand single track mountain bike options.
• See general notes regarding ADA requirements in Appendix J.
Address: 3176 Fort Avenue, Lynchburg, VA 24501
Classification: Special-Use Park
Acreage: 26.90 acres
Description: The City Stadium Complex is in the Fort Avenue neighborhood and hosts a baseball and football field. The football side of the City Stadium Complex is primarily used by Heritage and E.C. Glass high schools for varsity games as well as limited use by other groups for sporting events. Bleachers can seat audiences of up to 10,000. The facility includes two press boxes as well as a scoreboard, natural turf grass field, and gravel track. The baseball side of the City Stadium Complex is the home of the Lynchburg Hillcats, affiliated with the Cleveland Indians. In addition to the two fields, the City Stadium lawn is used as an event space for larger events up to 5,000 people. With lots of parking and attractive, newly renovated facilities, the Lynchburg City Stadium Complex is a great place for team practices and games, large company picnics, and other events.


Observations: City Stadium does a great job of relaying local sports history in a modern facility. The field, plaza areas, and spectator areas will serve the community for years. The City Stadium Complex is adjacent to additional city-owned property that could be incorporated into this complex for even more recreational offerings.
Recommendations: Recommendations to consider for this park include:
• Find ways to expand access to City Stadium for additional athletic and special events including concerts which are desired by the community.
• Look to incorporate adjacent properties for additional recreation uses.
• Add a parking garage.
• Add security improvements including a security camera system and security room.
• Continue planned football stadium visitor side improvements.
• See general notes regarding ADA requirements in Appendix J.
Address: Behind 100 Fifth Street, Lynchburg, VA 24504 (Accessible from the James River Heritage Trail)
Classification: Mini Park Acreage: 0.44 acre

Description: The Cliff’s Edge Pocket Park is located adjacent to the Cliff’s Edge Lofts on Commerce Street next to the James River Heritage Trail. The park offers a covered bench, shade trees, a water fountain, and an earthen path. Directly across from the park is a James River Heritage Trail bridge that crosses Blackwater Creek.
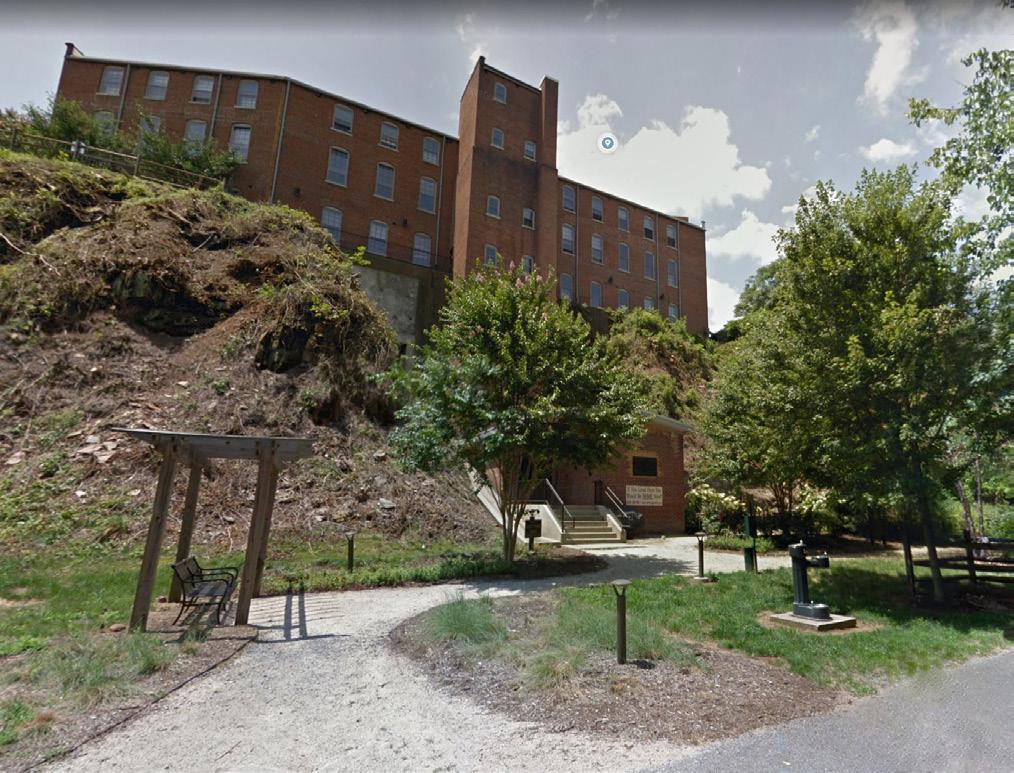
Observations: This mini park provides a great setting along the James River Heritage Trail greenway.The park is connected to a residential development. Park furnishings and fixtures appear to be in good condition.
Recommendations: Recommendations to consider for this park include:
• Consider adding a restroom building at this location.
• See general notes regarding ADA requirements in Appendix J.
Address: 811 Jackson Street, Lynchburg, VA 24504
Classification: Mini Park
Acreage: 0.68 acre
Description: The College Hill Neighborhood Park is located at the College Hill Community Center. The park includes a playground and a basketball court.

Observations: The playground equipment appears to be in good condition but may need to be replaced in coming years. The property is not fully fenced, which is not the case at other similar parks. Basketball court fencing and backboards are showning signs of age and should be replaced when possible.
Recommendations:Recommendations to consider for this park include:
• Plan to update playground equipment in coming years as necessary.
• Add ornamental fencing to define the edge of the park similar to other parks of this size in the City.
• Replace basketball court fencing and backboards.
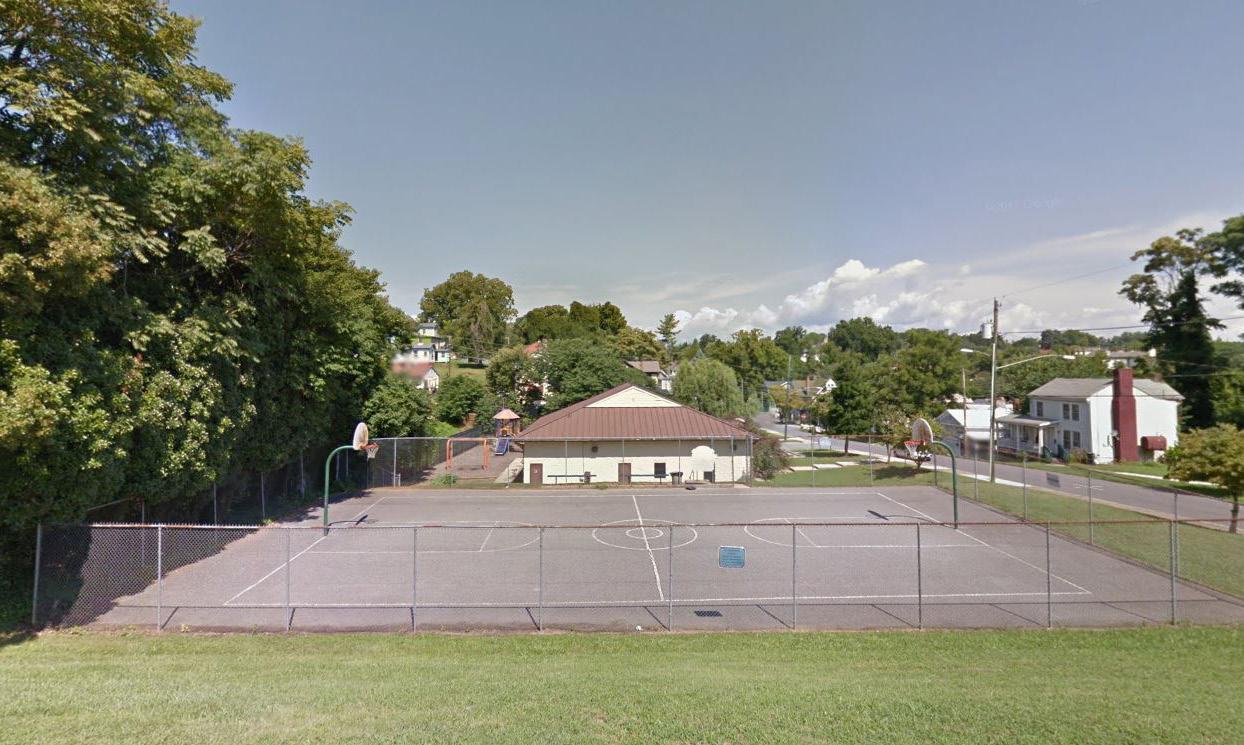
• Resurface basketball court.
• See general notes regarding ADA requirements in Appendix J.
Address: 101 Breckenbridge Street, Lynchburg, VA 24501
Classification: Neighborhood Park Acreage: 3.08 acres
Description: This small, linear park is located near Lynchburg College, between Amelia Street and Breckenbridge Street, and contains three separate picnic areas with grills, and a basketball court. A small tributary of Blackwater Creek meanders through the center of the park, with large trees providing shade.

Observations: The park is currently pretty sparse. The main feature of the park is the stream tributary. There are also benches and a basketball court. There are no designated pathways to access part of the park. It is easy to mistake this property as nothing more than a median to the roadway.
A master plan was completed for College Park in 2007. The plan highlights opportunities for stream restoration, pedestrian pathways, and formal landscaping. In a joint effort with the Department of Water Resources, the College Park Master Plan is currently being updated. This update involves reassessment of park uses, streams, green infrastructure, stormwater capabilities, and public outreach in a "Walkable Watershed" plan. Adoption of the updated plan is expected in late 2022.
Recommendations: Recommendations to consider for this park include:
• Complete and implement the master plan for College Park.
• See general notes regarding ADA requirements in Appendix J.
Address: 1219 Main Street, Lynchburg, VA 24504
Classification: Special-Use Park
Acreage: 1.61 acres
Description: The Community Market has played a key role in the development and growth of downtown Lynchburg since 1783. The market has been located numerous places around Lynchburg since then but has always remained a central social gathering place for the community. Today, farmers, artisan food vendors, restaurants and shops, a crafters gallery, and an artist alley can all be found at the market. The market features the We Got the Beet campaign, which is a collaborative effort between the City of Lynchburg, Central Virginia Health District of the Virginia Department of Health, and Virginia Cooperative Extension, to raise awareness about eating locally produced fresh and healthy foods.

Observations: The market interior is inviting and vendors are easy to identify and access. The plaza entrance to the market could be improved. The plaza structure that hosts the farmer's market is outdated. Modern structures could allow for improved circulation space under a roof while improving sight lines through to the indoor market.
The plaza surface and fountain could use some reconditioning.
Recommendations: Recommendations to consider for this park include:
• Update the market plaza shade structure.
• Improve sight lines to the indoor market entrance and implement remaining recommendations of the 2006 redevelopment plan.

• Evaluate viability of charging for parking during nonfarmers market hours.
• Bring the Wendell Plan to 100% completion holistically looking at the connectivity of adjacent City properties.
• See general notes regarding ADA requirements in Appendix J.
Address: 317 Norwood Street, Lynchburg, VA 24504
Classification: Mini Park Acreage: 1.35 acres
Description: Daniel’s Hill Neighborhood Park is located on Norwood Street and D Street in the historic Daniel’s Hill Neighborhood. The park has a full basketball court, a half basketball court, a playground, and picnic tables with a grill.


Observations: This park is similar to other small parks in the system. The basketball courts, playground, and picnic tables appear to be in good condition. The lawn is a good size and allows for passive recreation in a nice setting.
The park lacks shade trees and may benefit from additional shade during summer months. The fencing is not consistent with other parks of this size or the historic nature of the surrounding neighborhood.
Recommendations: Recommendations to consider for this park include:
• Replace chainlink fencing with the ornamental fencing used at similare sized parks in other parts of the City.
• Add accessible routes to all park amenities.
• Consider adding a shade structure over the playground area.
• Consider adding shade structures, grills, and tables to improve the picnic area.
• See general notes regarding ADA requirements in Appendix J.
Address: 1005 17th Street, Lynchburg, VA 24504
Classification: Mini Park
Acreage: 0.66 acre
Description: The Diamond Hill Neighborhood Park is located at the Diamond Hill Community Center on 17th Street. This park has a basketball court, a playground, benches, picnic tables, and a grill.


Observations: The park is well maintained and inviting in appearance. Fencing, trash cans, tables, and lighting complement each other well. Landscaping is well maintained. Overall, this park is a good example to emulate at other parks in the system.
Recommendations: Recommendations to consider for this park include:
• Use this park as the standard for mini parks located at neighborhood centers.
• Consider implementing community feedback gained at the Strong Neighborhood Alliance meetings. (Community Tool Shed checkout and Washer and Dryer availability in the neighborhood center).
• Consider adding shade structures, grills, and tables to improve the picnic area.
• See general notes regarding ADA requirements in Appendix J.
Address: 3621 Campbell Avenue, Lynchburg, VA 24501
Classification: Neighborhood Park
Acreage: 7.45 acres
Description: Fairview Heights Neighborhood Park is located at the Fairview Heights Recreation Center. This park has a playground, picnic tables, tennis courts, a full basketball court, and a half basketball court.


Observations: The park is well maintained. Park features are connected by walkways. There are several steps in the park that may be difficult to navigate by some visitors.
A large open lawn is located on the south side or rear of the property. This area seems suitable for casual pick-up games of football or soccer. The addition of a backstop in one of the corners would allow for baseball and softball practices or informal games as well. This area is also large enough to host special events for the neighborhood. However, parking would need to be addressed if large events were hosted here.
Recommendations: Recommendations to consider for this park include:
• Create a multipurpose field with sports lighting.
• Evaluate the need for ADA accessible ramps in place of stairs.
• Complete fencing around the functional portions of the property.
• Add striping for pickleball to existing tennis courts to meet needs identified by community input.
• Convert tennis courts to tennis/pickleball courts by resurfacing and adding new fencing and nets.
• See general notes regarding ADA requirements in Appendix J.
Address: 4831 Fort Avenue, Lynchburg, VA 24501
Classification: Neighborhood Park
Acreage: 0.41 acre
Description: Fort Avenue Park is located on Fort Avenue, past the City Stadium and Fort Early. This completely fenced neighborhood park is a popular spot for nearby residents to hold family reunions, picnics, or enjoy a game of basketball. There is also a play area in Fort Avenue Park.

Observations: This park is in overall good condition. The tables, basketball court, and playground appear to be in good condition. A shade structure over the playground might be beneificial on hot summer days. Accessible walkways do not connect the playground or basketball court. The park is terraced and slopes may be difficult for some to navigate.
Recommendations: Recommendations to consider for this park include:
• Install accessible walkways to all park features including the playground and basketball courts.
• Replace chain-link fence with black powder-coated fence.
• See general notes regarding ADA requirements in Appendix J.
Address: 557 Leesville Road, Lynchburg, VA 24502
Classification: Community Park Acreage: 22.61 acres
Description: This 59-acre site provides recreation for both school and park users. Extensive hiking and mountain bike trails are found in Heritage Park, which is located behind Heritage High School. Heritage Park’s bike trails are for beginner, intermediate, and advanced riders. While mountain bike trails have been a focus of this heavily wooded park in the past, new uses like disc golf are now being considered for this location.
Observations: This park is heavily wooded with rolling terrain. The park and high school campus appear to function as one property. Opportunities for partnership with the school would seem very good at this location.

The high school currently maintains a football field to the west of Heritage Park. This is not the primary football facility for the school and may make sense to transfer responsiblity of this area to the Parks Department. This area could be used by the Department for youth sports (football or soccer) or more passive activities to complement the vast wooded area targeted for disc golf.
The paved sidewalk to the high school from the Heritage Park parking area requires several steps, which may be difficult for some to navigate.
Recommendations: Recommendations to consider for this park include:
• Evaluate wooded area for use as a disc golf facility.
• Discuss opportunities for the future management of the small football fields located west of the parking area with the school. This might fill the need for a dedicated youth football facility.
• Create and implement a new master plan for the park.
• See general notes regarding ADA requirements in Appendix J.
Address: 521 Hollins Mill Road, Lynchburg, VA 24503
Classification: Community Park
Acreage: 9.63 acres
Description: This popular park provides large shade trees, a lush open field, fishing access, and wonderful views of Blackwater Creek and historic Hollins Mill Dam. Picnic tables and grills are accessible. Visitors can enjoy the old stonework of the dam as the water surges over the edge. The park also includes trail connections to the Blackwater Creek Bikeway, including the Point of Honor Trail section.

Observations: This park is a great location to access a trail, enjoy good access to the water, or have a picnic in the open field. There is a good amount of parking for these uses. The trail uses a low water crossing to traverse the creek. While this alignment provides interesting views of the historic dam, the low water crossing is less than ideal for trail users after heavy rains.
A portable toilet serves this park. A more permanent but environmentally sensitive solution would serve the public better.
Blackwater Creek is easily accessed here. The park could function as a more formal take out location for paddlers finishing trips that began upstream. A designated portage around the dam could also assist paddlers seeking to extend their trip below the structure.
Recommendations: Recommendations to consider for this park include:
• Replace the low water crossing with a bicycle/pedestrian bridge that is connected to the upstream side of the Hollins Mill Road bridge.
• Consider replacing the portable restroom with a permanent restroom structure. A waterless vault toilet may meet demand at this location.
• Improve boat launch and signage.

• Consider adding a picnic shelter along the trail in the park to allow for picnics or gatherings during times of uncertain weather.
• See general notes regarding ADA requirements in Appendix J.
Address: 118 Clemmons Lake Place, Lynchburg, VA 24501
Classification: Community Park
Acreage: 29.12 acres
Description: Ivy Creek Park (the nature park) is in the Lynchpin Industrial Park, which houses nine major businesses with over 1,400 employees. Ivy Creek Park is a green oasis that includes the six-acre Clemmons Lake, multi-use trails, picnic and play areas, and an auxiliary site for the naturalists of the Nature Zone. Clemmons Lake provides opportunities to canoe or kayak, fish from the pier, or enjoy a picnic lunch on the shore. The grounds of Ivy Creek Park incorporate green design principles such as aggregate paving in the parking lot to help reduce stormwater runoff along with landscaping that includes native plants and trees selected to attract wildlife and provide food and shelter.

Observations: The park setting is interesting due to the number of employers in the area. A multi-use paved trail connects the park to the sidewalk network at Jefferson Ridge Parkway. The trail extends beyond the parking area and around the lake.
There appears to be ample room to construct a formal nature center here in the future.

Recommendations: Recommendations to consider for this park include:
• Evaluate need for a permanent nature center at this location for future investment.
• Consider adding solar installations to this park as a pilot project.
• Work with adjacent landowners to create an access road for people with disabilities to enter the park on the same grade as the pier.
• Plan and install sustainable features such as solar panels, stormwater measures, pollinator gardens, etc. for sustainability and for educational purposes.
• See general notes regarding ADA requirements in Appendix J.
Address: 720 Winston Ridge Road, Lynchburg, VA 24501
Classification: Mini Park
Acreage: 3.31 acres


Description: The Jackson Heights Neighborhood Park is home to the Jackson Heights Art Studio, which specializes in pottery and stained glass. This unique neighborhood art studio features ten potter’s wheels, a slab roller table, extruder, and a variety of clay and glazes for creating hand-built and wheel projects. Stained glass artists are provided with grinders, light boxes, an array of textured and colored glass sheets, solder, and tools to make colorful window hangings. Instructors practice hand over hand instruction, and work to cultivate a space of creativity and growth.
Observations: The art studio is the primary attraction to this park. The studio is highly valued and should be expanded based on analysis of participation demand. There appears to be suitable room for expansion at this location.
A small pavilion provides shelter for a picnic table. The pavilion is not connected to the parking area with an accessible route. Accessing the pavilion could be difficult for some visitors.
This property is larger than it first appears. Approximately half the site is wooded and may be suitable for a small nature trail.
Recommendations: Recommendations to consider for this park include:
• Expand the art studio.
• Consider adding a playground and nature trail in this location to diversify recreation at this park.
• See general notes regarding ADA requirements in Appendix J.
Address: Classification: Special-Use Park Acreage: 0.56 acre
Description: The James River Canoe Ramp is located at the end of 7th Street, just upriver from Langley Foundation. There are 11 parking spaces allocated for vehicles and the facility is open from dawn to dusk. No fishing, camping, wading, or swimming is allowed at the ramp.

Observations: The parking area is paved and appears to be in good condition. This area could be very dark in early morning hours. Additional lighting may be helpful for safety.
Recommendations: Recommendations to consider for this park include:
• Add lighting and security cameras in the parking area.
• Add well marked parking spaces.
• Improve the launch area.
• Install signage so ramp can be located.
• Create and implement a blueway plan for creeks and rivers throughout Lynchburg that includes additional formal put-ins, mapping, signage, etc.
• See general notes regarding ADA requirements in Appendix J.
Address: 405 York Street, Lynchburg, VA 24502
Classification: Neighborhood Park
Acreage: 14.50 acres
Description: Jefferson Park is home to the Jefferson Park Neighborhood Center that serves as the hub for much of the activity in the park. The park includes a playground, athletic fields, two tennis courts, horseshoe pits, and a basketball court for active recreation. An open field for play is located next to the neighborhood center. The picnic shelter and grills accommodate up to 80 people, ideal for a family reunion or neighborhood gathering. The Jefferson Park Trail is in Jefferson Park and provides access to the Blackwater Creek Natural Area and Creekside Trail.
Observations: The park property is connected to the surrounding neighborhood by an existing sidewalk network. This pedestrian network could be improved by addressing gaps.
The Dearington Nieghborhood Plan includes recommendations for this park that should be carried forward as improvements are made at this location.


Recommendations: Recommendations to consider for this park include:
• Pave the existing trail connection to Creekside trail.
• Implement new Jefferson Park Master Plan in phases as funding allows.
• Consider additional lighting for this park to extend hours of use.
• Implement the new master plan, which was part of the Dearington Neighborhood master planning process.
• Plan and install sustainable features such as solar panels, stormwater measures, pollinator gardens, etc. for sustainability and for educational purposes.
• Implement wildflower field on bank behind apartments.
• See general notes regarding ADA requirements in Appendix J.
Address: 301 Grove Street, Lynchburg, VA 24501

Classification: Community Park
Acreage: 1.28 acres
Description: Located in Midtown adjacent to historic Miller Park, the Miller Center serves as the Lynchburg Parks and Recreation headquarters. The newly renovated Miller Center is also home to the Nature Zone environmental education center, which has a newly restored 186-seat theatre, fully equipped classroom space, and a new dance/fitness studio. The center was originally built as an elementary school building and was completed in 1911. Current renovations began in 2012. A key component of the 2012 renovation was to follow the recommendations of the Miller Park Master Plan, which called for a stronger connection between the Miller Center and Miller Park.
Observations: The Miller Center is a great facility for administrative functions required of a recreation system this size. The center also provides quality classroom spaces and room for the nature program. Recreation programs that are based at the Miller Center keep the facility active and provide good access to residents of the immediate area and beyond.
The building is easy to access. Accommodations are available for visitors with physical limitations. The building is clean and appears to be well maintained.
Recommendations: Recommendations to consider for this park include:
• Maintain the historic attributes of the building.
• Plan and install sustainable features on-site such as solar panels, stormwater measures, pollinator gardens, etc. for sustainability and for educational purposes.
• See general notes regarding ADA requirements in Appendix J.
Address: 2100 Park Avenue, Lynchburg, VA 24501
Classification: Community Park
Acreage: 29.70 acres
Description: Miller Park has almost 30 acres and includes two picnic shelters that can be rented as well as the historic Aviary, which can be used for weddings and other events. Miller Park Pool is the only public outdoor pool in Lynchburg and can be rented for special occasions. Miller Park includes baseball fields, a basketball court, horseshoe pits, an Olympic size pool and diving well, and playgrounds.

Observations: This park is a very large park in a highly developed part of the City. The amount of development surrounding the park makes investing in Miller Park very important. The park has a good mix of active and passive recreation.
Parking seems limited for some uses like the three diamond fields. Youth sports require a lot of parking and a different location may be more suitable for these fields.
Trails within the park are in need of repair in a number of locations. ADA requirements should be addressed in conjunction with repairs when necessary.
Recommendations: Recommendations to consider for this park include:
• Consider finding a new location for the three diamond fields.
• Consider using a bubble or other seasonal enclosure to extend use of the Olympic pool.

• Actively maintain the Aviary and Fireman's Fountain as special features of the park.
• Address needed trail repairs.
• Plan and implement the replacement of the pool.
• Develop the Miller Mile Trail around the park and mark with 1/10 mile markers.
• Implement recommendations found in the Security Assessment for Miller Park (2021) in Appendix F.
• See general notes regarding ADA requirements in Appendix J.
Address: 170 Ivy Creek Lane, Lynchburg, VA 24502
Classification: Community Park Acreage: 253.66 acres
Description: Peaks View Park is the second largest park in Lynchburg and offers both passive and active recreation. The park has three lighted tennis courts, four multipurpose fields (soccer and football), seven softball fields, a basketball court, mountain bike trails, and a disc golf course. The park also has a popular playground and picnic shelters. The Ivy Creek greenway can be accessed from Peaks View Park.
Observations: The park is very large and could benefit from wayfinding signage to assist visitors in understanding what is available and how to access it.
There are seven diamond fields located in the park. All of these fields are very low and are prone to occassional flooding. Flooding is especially hard on softball fields because of the dirt required for the infields. The planning team observed areas where this dirt had been washed into the nearby creek in numerous instances. Parking is not convenient to the northernmost and sothernmost fields.
The upper portions of the park appear to be in good condition. The tennis courts, newer playground, and rectangular fields are all in good condition and ready for use.
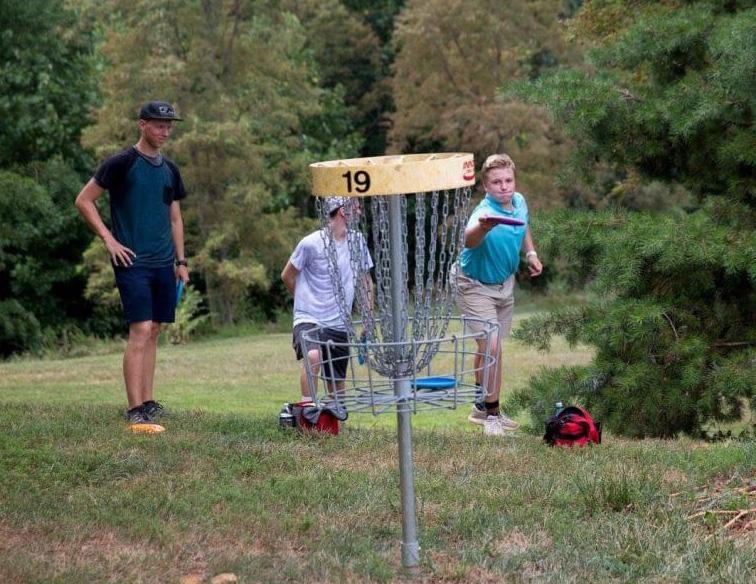

Recommendations: Recommendations to consider for this park include:
• Build up diamond fields to prevent future damage during rain events.
• Upgrade field lighting and remove unused poles.
• Improve trail drainage.
• Provide wayfinding signage within the park.
• Plan and implement stream restoration throughout the park.
• Plan and implement repairs and flooding measures for park features.
• Implement recommendations found in the Security Needs Assignment in Appendix F.
• See general notes regarding ADA requirements in Appendix J.
Address: 1600 Concord Turnpike, Lynchburg, VA 24504
Classification: Natural Resource Area
Acreage: 60.52 acres
Description: Percival’s Island Natural Area is a beautiful, heavily wooded island located along the James River in eastern Lynchburg. Once a private home and later a rail yard, the island is approximately 1.5 miles long and is Lynchburg’s newest park (opened in 1998). Percival’s Island houses the trailhead for the James River Heritage Trail. Visitors may see herons, migrating waterfowl, and many different plants and animals as they follow the paved Riverwalk Trail, which bisects the natural area and is accessible.
Observations: The island is an easily accessible way to experience views of the river from a greenway trail. The island overlook from the greenway bridge is well constructed and accessible to all. The trail itself is a good width for two-way traffic.


Some concerns about invasive and non-native flora were shared with the planning team. Percival's Island provides a great venue to engage with conservationists and naturalists to use their passion and knowelege to benefit the community through structured efforts like weed wrangles and nature walks.
Recommendations: Recommendations to consider for this park include:
• Explore options for removing the low dam on the south side of the island.
• Add communal swing set near the 4.5-mile marker in the grassy area and remove concrete slab.
• Add Youth Remembrance Trail and Seven Rails Trail signage at trailhead.
• Develop a management plan for the natural area.
• Plan and implement sustainable/natural features, which could be used for educational programming.
• See general notes regarding ADA requirements in Appendix J.
Address: 409 Perrymont Avenue, Lynchburg, VA 24502
Classification: Neighborhood Park Acreage: 18.95 acres

Description: Located on Perrymont Avenue, adjacent to Perrymont Elementary School, this park includes a wooded grassy area, an athletic field, and a playground.
Observations: A previous master plan has been completed for Perrymont Park. The plan discusses additional parking off of Meadowview Drive, revisions to the trail system to improve issues with erosion, and programmatic elements of the park.
Sandusky Park and Perrymont Park could be connected by a paved trail along a tributary of Blackwater Creek. This should be explored as a future opportunity.
Recommendations: Recommendations to consider for this park include:
• Continue implementing recommendations from the previous master plan for this park.
• Construct a trail connecting to the Sandusky Park trail system.
• See general notes regarding ADA requirements in Appendix J.
Address: 1100 Jefferson Street, Lynchburg, VA 24504
Classification: Community Park
Acreage: 7.27 acres
Description: Riverfront Park is located near the river in downtown Lynchburg and includes a large open field suitable for festivals and other special events. The park connects to the Riverwalk Trail along its northern edge. The Riverwalk Trail leads to Percival’s Island in the James River. The level ground near the river is ideal for an easy stroll or bike ride. Recent renovations to Riverfront Park include several boardwalks, rain gardens with native wildlife plantings, benches, new shade trees, and a stage area for events. A zero-depth fountain is open seasonally near the stage area for young and old to enjoy.
Observations: The park is well maintained and provides much needed open space to residents and visitors of downtown Lynchburg. The rail lines adjacent to the park separate Riverfront Park from the river and Percival's Island. While it is possible to access Percival's Island via an at-grade rail crossing located at Washington Street, a grade-separated bridge for bicycles and pedestrians running from the Lower Bluffwalk stairs at Jefferson Street to the James River Heritage Trail would connect Riverfront Park to Percival's Island, providing a safe crossing for trail users.
The City should consider purchasing additional property along the riverfront as it becomes available for park development to increase park and trail connectivity and allow for additional river-based recreation opportunities.
Recommendations: Recommendations to consider for this park include:

• Provide improvements to accommodate concerts and other community events at Riverfront Park.

• Develop a grade-separated crossing from Riverfront Park to Percival's Island as a long-term goal.
• Purchase additional riverfront properties as they become available.
• Implement recommendations from the Downtown 2040 Master Plan.
• See general notes regarding ADA requirements in Appendix J.
Address: 2238 Rivermont Avenue, Lynchburg, VA 24503
Classification: Community Park Acreage: 49.86 acres
Description: One of the most beloved parks in Lynchburg, and the second oldest, Riverside Park has over 49 acres of rolling parkland with walking trails that provide views of the wooded hillsides and the river beyond. Active recreation opportunities include tennis and basketball, with extensive playground equipment for younger children located in the front of the park. The latest addition to the park is the first fully accessible playground in Lynchburg. The park also includes the sprayground.The transportation exhibit in the park includes a train locomotive, tender, caboose, the Fink Deck Truss Bridge, which is a national engineering landmark, and the hull of the packet boat, Marshall. Two picnic shelters and a gazebo can be rented for picnics, birthday parties, or family reunions.

Observations: The park grounds are well maintained. Landscaping appeared to be healthy and crews were on site during the assessment. The playgrounds appeared to be in good condition as well. The sprayground was being renovated at the time of the assessment.

The park's exhibits provide insight into Lynchburg's engineering and transportation histories. Trails and walkways were in overall good condition. Public input suggested paving the gravel section of Treasure Island Road to make it easier for trail users with strollers.
Recommendations: Recommendations to consider for this park include:
• Add additional exhibits to the former pool, which was decommissioned in the 1960s.
• Add a senior communal swing set under the large tree canopy.
• Pave gravel sections of Treasure Island Road.
• Add additional play equipment for young children.
• Install a shade structure for the sprayground area.
• Install lighting infrastructure for Celebration of Lights.
• Continue to plan and implement improvements to the transportation displays (train, trestle, and packet boat).
• See general notes regarding ADA requirements in Appendix J.


Address: 11 9th Street, Lynchburg, VA 24504
Classification: Special-Use Park
Acreage: 0.77 acre
Description: Rotary Centennial Riverfront Skatepark was opened in 2008 on land donated by the City and funded by the City and two Lynchburg rotary clubs. The skatepark is currently a 14,000 square foot complex with a street course and a bowl. The park is an outdoor hybrid that was designed by Artifex and built by California Skateparks. The street course (a 9,000 square foot pad) includes multiple flat bars, a bench pyramid with hubba, two quarter pipes, a loading dock with a kicker ramp, a complete platform with ledge, and concrete bank stairs. The concrete bowl includes a shallow five-foot section, two hips, and a deep eight-foot section.
Observations: The skatepark equipment and fixtures appear to be in good condition. The planning team observed users at different times giving an indication the park is used for the intended purpose and fills a need within the community.
The park is located on Blackwater Creek. The public engagment process identified a need for additional river access points. Additionally, this site was suggested as a possible location for a canoe/kayak launch. A launch would be a complementary use to the skatepark and could be provided just east of the skatepark.
Recommendations: Recommendations to consider for this park include:
• Add a shade structure to the skate park.
• Consider adding a canoe/kayak launch in this location.
• Continue improvements and additions of skating features over time.
• Install permanent restrooms for park users.
• Implement recommendations found in the Security Needs Assignment in Appendix F.
• See general notes regarding ADA requirements in Appendix J.
Address: 5805 Rhonda Road, Lynchburg, VA 24502
Classification: Community Park Acreage: 21.47 acres

Description: Sandusky Park features athletic fields, a picnic area, a paved pathway, and an 18-hole disc golf course. The park is a lovely place to take a walk near Blackwater Creek. Benches provide resting spots for visitors to admire the many native plants and trees, including viburnum, hypericum, sycamores, and dogwoods. The paved pathway follows along Blackwater Creek and ends at a large open green field perfect for pick-up soccer games. With over 21 acres of parkland to explore, Sandusky Park offers plenty of space for families to spend some time outdoors exploring the flora and fauna native to the area.
Observations: The park is sizable, allowing for diverse recreation opportunities. The native plants and trees coincide with the informal athletic fields nicely. A large playground could further expand recreational opportunities here and address comments raised in the public input process.
Sandusky Park and Perrymont Park could be connected by a paved trail along a tributary of Blackwater Creek. This should be explored as a future opportunity.
Recommendations: Recommendations to consider for this park include:
• Begin exploring development of a greenway connection to Perrymont Park.
• See general notes regarding ADA requirements in Appendix J.

Address: 225 Wiggington Road, Lynchburg, VA 24502
Classification: Special-Use Park
Acreage: 0.81 acre
Description: The Templeton Senior Center serves seniors and adults of all ages in the Lynchburg area. This location has served as a gathering place in the community since 2004 and offers participants a great place to gather and have fun. The center is the hub of activity for both the community and bridge enthusiasts alike. A variety of activities are planned monthly. Templeton also offers Zumba, yoga, cardio fitness and tone classes, and even video chair exercise. Beading, watercolors, botanicals, oil painting, and acrylic painting are also offered at the center. Outdoor amenities include a gazebo and community gardens. Off-site activities include softball, bowling, pickleball, putt-putt, Golden Gourmets, and a chapter book group.

Observations: The facility is well maintained and efficiently used to provide a number of programs and services to senior residents of Lynchburg. Staff expressed concerns about outgrowing the current building. Adjacent property is available, which would allow for expansion of the current site and parking areas.
With additional land, a small mini park could be developed around the center to activate the site as a multigenerational facility.
Recommendations: Recommendations to consider for this park include:
• Purchase adjacent land for facility expansion.
• Expand the current building to serve seniors at this location for years to come.

• Develop a small park with playgrounds designed for older users and picnic tables.
• Request a bus stop be added in front of center.
• See general notes regarding ADA requirements in Appendix J.
Address: 1417 4th Street, Lynchburg, VA 24501
Classification: Mini Park Acreage: 0.16 acre
Description: The Valleyview Playlot is a small park located between 4th Street and Valley Street that offers a picnic area with a grill and a playground.
Observations: This park is located on what appears to be a quiet street in a residential area.

Recommendations: Recommendations to consider for this park include:
• Standardize the fencing, trash cans, and picnic table to match those used in other parks of this size.
• Provide level concrete pads for the picnic table and bench.
• Update playground equipment to modern standards.
• See general notes regarding ADA requirements in Appendix J.
Address: 3117 Memorial Avenue, Lynchburg, VA 24501

Classification: Neighborhood Park
Acreage: 0.30 acre
Description: Westover Neighborhood Park is completely fenced and includes playground equipment for younger children as well as a picnic table. A half basketball court, located in the center of the park, provides entertainment for older children. Small trees provide shade for the playground and picnic table.

Observations: The park is highly visible from public roads and is generally well maintained. Fencing, trash cans, and lighting is not consistent with other similar parks in the system.
Overall, the park seems well situated to serve residents who live within walking distance.
Recommendations: Recommendations to consider for this park include:
• Standardize the fencing, trash cans, and picnic tables to match those used in other parks of this size.
• Install new picnic areas that include shade structures, grills, and tables.
• Add an appropriate mural to the brick wall.
• Implement recommendations found in the Security Needs Assignment in Appendix F.
• See general notes regarding ADA requirements in Appendix J.
Address: 2338 Light Street, Lynchburg, VA 24501
Classification: Neighborhood Park Acreage: 7.50 acres
Description: Located in the quiet Fairview Heights neighborhood, Younger Park is surrounded by the backyards of adjacent homes. The park has over seven acres of land with several large canopy trees on a rolling terrain. Younger Park underwent master planning in the fall of 2004. Capital funding from the City of Lynchburg was used to complete the renovations in the summer of 2011. Designated as a neighborhood park, the renovations added a new basketball court and playground, two picnic tables and grills, and a small trike track for younger children. Also included was new lighting, signage, park amenities, and a new parking area with additional spaces.
Observations: The park renovations completed in 2011 appear to serve the residents well. The playground equipment is aging, but should last several more years. The basketball court and parking lot are also in good condition.
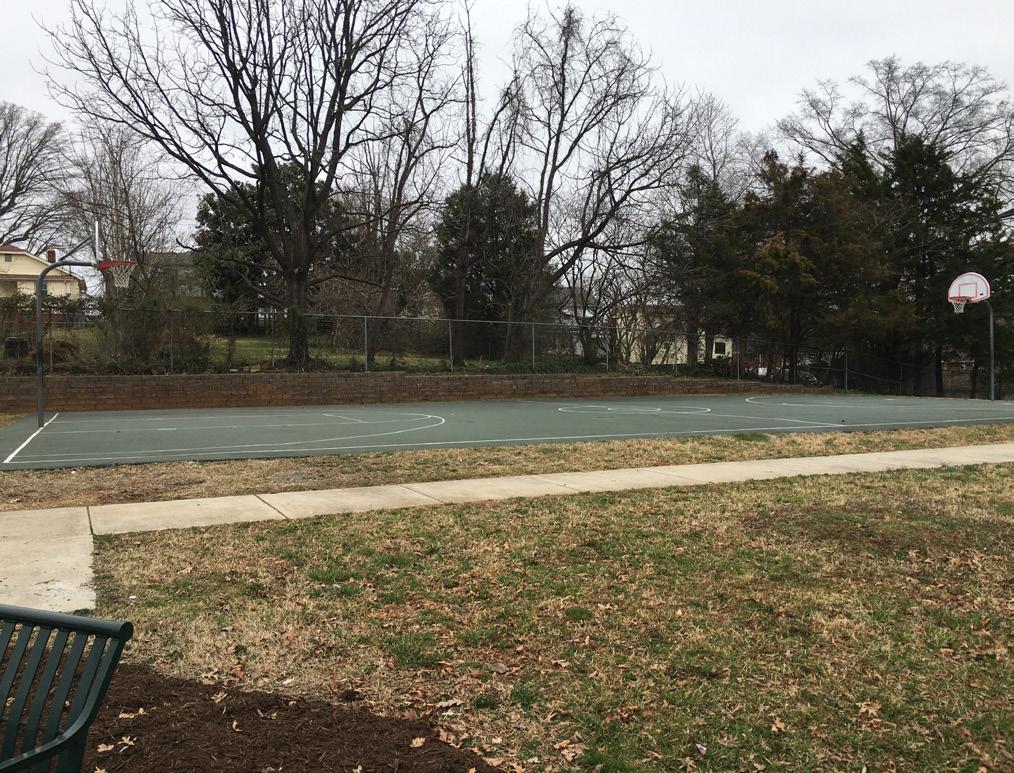

Site furnishings such as bike racks, trash cans, and signage appear to meet Department standards for parks of this type.
The undeveloped portion of the park appears suitable for community events.
Recommendations: Recommendations to consider for this park include:
• Monitor need to upgrade playground equipment.
• Upgrade lighting throughout park.
• Install permanent restrooms for park users.
• Implement recommendations found in the Security Needs Assignment in Appendix F.
• See general notes regarding ADA requirements in Appendix J.
The facility assessment findings identified some general trends throughout the system. Overall, the facilities are in fair condition. The responsibilities for addressing park maintenance lies mostly with the Public Works Department. The Public Works Department is responsible for addressing maintenance concerns for the entire community and must divide staff hours and budget allocations to meet this significant demand. Additionally, park maintenance requires specialized training, skills, and equipment to deliver a high standard of care. Additional maintenance staff with specialized park maintenance training and equipment should be added as budgets and funding allow.
The planning team noted that these parks have a broad range in age, maintenance levels, design standards, and compliance with safety and ADA codes, which is not uncommon for a park system of this size. The Department regularly undertakes renovation projects to rehabilitate old or non-functional park facilities to current standards and improve the overall quality of the system. Although specific needs vary between parks, several issues were found to be consistent through the city, including stormwater issues, the need for general maintenance, and ADA accessibility issues. The following summary recommendations should be evaluated by Department staff and implemented where feasible:
A large issue facing both public and private recreation providers is the ability to enhance access for disabled patrons. Park and recreation departments are not exempt from this requirement, and legislation dictates that primary park amenities be barrier-free. The park system recommendations address how best to ensure compliance with accessibility requirements of the Americans with Disabilities Act (ADA). These system-wide recommendations address existing conditions, use patterns, and the potential for redevelopment and expansion. Equitable access should be prioritized to reduce the limitations of service. Due to the age of many of the facilities in the City’s park inventory, many still contain original design elements that are not in compliance with current accessibility codes. The planning team observed multiple instances of non-compliant parking spaces and pedestrian routes to primary use areas. Many athletic facilities did not have accessible routes to team and spectator areas. Re-evaluation of the total system on a recurring basis is recommended to continue to monitor park conditions for code compliance. See Appendix J for ADA compliance standards.
The Parks and Recreation Department is working to ensure park users have a safe and welcoming experience in all of city parks. Parks and Recreation has sought input from the Lynchburg Police Department to address a variety of crimes that have recently occurred in the parks. These crimes range from alcohol and drug related offenses to violent assaults and a shooting. The collaboration with the Police Department has identified several areas of investment to address this concern. Investments recommended include:
• Special Park Officers
• Lighting Systems
• Fencing Improvements
• Security Camera Systems
• Landscaping Improvements
These items are further detailed in Appendix F: Security Needs.
Another prominent issue within some park systems is the non-compliance of playground equipment to safety standards by organizations such as the American Society for Testing and Materials (ASTM), the U.S. Consumer Product Safety Commission (CPSC), and the International Play Equipment Manufacturers’ Association (IPEMA). The standards proposed by these organizations are meant to serve as a guideline to help create atmospheres that are safe and pose a minimal threat of injury. Studies show that many injuries sustained on public playgrounds are to the head — a result of falls from the play structure to the ground. For this reason, consideration has been given as to what the critical fall height would be in which a fatal head injury might occur. Guidelines have been established measuring the impact performance of various materials. As with ADA issues, alternatives should be studied, and a standard established for implementation of safe play environments throughout the parks system.
Safety surfaces should be under specific consideration, with options lying under two main categories:
• unitary materials (mats, tiles, poured-in-place rubber surfacing, etc.) or
• loose-fill surfacing materials (engineered wood fiber, rubber mulch, pea gravel).
The use of the latter is common in many park systems, but it should be noted that these materials require much higher maintenance to maintain safety ratings. Newer poured-in-place rubber surfaces are becoming more cost effective, as they involve a higher initial cost but eliminate the need for annual maintenance and material costs. As playgrounds are added to the system and older equipment is updated, this type of surfacing should be examined as an alternative. The planning team recommends that at least one Department staff person maintain a playground safety certification (Certified Playground Safety Inspector, CPSI) to monitor and report playground conditions and limit liability. The certified staff person should minimally hold a supervisory position for oversight and delegation of safety-related tasks and maintenance. This is a standard practice in public park agencies across the country.
The Department has a number of park properties in early stages of design that warrant additional planning and public input. The parks and properties listed below are recommended for further consideration and public discussion as the Department works to increase access to parks throughout the community.
• Foundry Park
• Tyreanna/Pleasant Valley Park (Landfill Park)
• Clay Street Reservoir Park
• City Stadium Park
• Perrymont Park
• Chambersville Park
After accessing facilities in the Lynchburg parks system, the planning team has developed a series of recommendations for improving access to facilities and programs desired by the community. The planning team identified seven areas where parks or recreation facilities are needed based on spatial analysis and public consensus. The planning team also identified a new indoor multipurpose recreation facility and expansion of the Templeton Senior Center as projects to undertake over the next ten years. Additional recommendations were made for individual park properties. The planning team also identified ways to increase trail connectivity based on current trail alignments and public comments indicating where additional trails are needed. The findings of the section are carried forward in the Capital Improvement Plan provided in Section 8 of this master plan.

THIS PAGE INTENTIONALLY LEFT BLANK
The Lynchburg Department of Parks and Recreation's mission is to steward and manage essential parks, spaces, and services to improve the health and happiness of its diverse community.

The City of Lynchburg (the City) has two divisions within the Depar tment that provide recreation programs and services to Lynchburg residents including Recreation Services and Neighborhood Centers. These two divisions are supervised by the manager of Recreation Services and the manager of Neighborhood Centers, both of whom report to the Parks and Recreation Director.
The missions of the two divisions are distinctly different. The purpose of the six Neighborhood Centers (College Hill, Daniel’s Hill, Diamond Hill, Fairview Center, Jefferson Park, and Yoder Center) is to provide services, spaces, and connections, which build strong neighborhoods. The three focus areas include supporting work, family, and education for the residents who live in the surrounding neighborhood. The mission of Recreation Services is to build community through recreation. The Recreation Services Division is composed of four subdivisions which include Athletics and Aquatics, Citywide Recreation, Environmental Education and Outdoor Recreation, and Volunteer Services. Recreation Services offers educational and enrichment programming, which focuses on the pillars of equity, wellness, and conservation. Programs offered through Recreation Services provide equitable recreational opportunities for all Lynchburg residents.
BerryDunn assessed the recreation programs offered by the Department through a series of individual analyses using programming data from 2017 – 2019 (pre-pandemic). The outline of this chapter is as follows:
• Recreation Services Overview
• Marketing Challenges
• Program Categories
• Core Program Areas
• Distribution of Core Programs
• Program Age Segment Analysis
• National Recreation and Park Association (NRPA) Park Metrics
• Neighborhood Centers Overview
• Future Program Alignment with Public Engagement
• Positioning Future Programs
• Recommendations
Most of this chapter focuses on the programming data provided by Support Services. The data for Neighborhood Centers is complex as it is a combination of manual daily attendance tracking via sign-in sheets (for most programs) and registration software tracking. Mixing the two types of data is a difficult way to determine the number and type of programs offered and the number of people being served. If the registration that is tracked manually were combined with the information from the registration software system, some course and registrants would be included twice. This is different from the programs offered by Recreation Services where all course participation is entered into the registration software system and a child who signs up for a 10-week class is only counted once, whereas a child who comes to after-school care at one of the Neighborhood Centers every day for the entire school year could be counted as many as 180 times.
The Recreation Services Division includes one full-time manager who directly supervises four full-time staff including a Chief Naturalist (responsible for the management of two environmental education centers, animal care, and boat rentals), an Athletics and Aquatics Supervisor (responsible for three aquatic facilities, youth and adult athletic leagues, athletic events, and tournaments), a Volunteer Coordinator (responsible for volunteers, workstudy students, and interns), and a Citywide Recreation Supervisor (responsible for the management of three City facilities: Templeton Senior Center, Jackson Heights Art Studio, and Miller Center).
Recreation Services staff value collaboration to accomplish their goals and mission. This division works closely with other divisions within the Department and with many other City departments. The Recreation Services staff coordinate athletic field and park usage with the Parks Services Division, Public Works, and the Buildings and Grounds Department. The staff also have a partnership with the Water Resources Department, who assist with classes and events including trail cleanups, rain barrel workshops, and stormwater landscaping. The Aquatics staff work with the Fire Department on emergency training and the Naturalists partner with the Aquatics staff to provide the Lynchburg Plunge event. The Lynchburg Police Department is utilized for some special events, RAD self-defense classes, facility security recommendations, and security as needed. The Naturalist staff works with the Fire Department to ensure safety during events.
The Marketing team (who report to the Support Services Manager) includes two staff members: one full-time and one part-time. The team is not currently large enough to handle everything that is needed to successfully promote the Department’s programs and services (including the seasonal program guide, social media, posters, photography and videography of programs and events, updating the website, etc.). This creates a burden on the Recreation Services staff who must create and manage alternative marketing strategies in order to inform the public of programs and classes including managing multiple social media pages on Instagram and Facebook, submitting information to local online calendars, developing engaging social media content, creating newsletters, flyers, and direct phone and email communication with customers.
Table 5.1 shows a list of major program categories that parks and recreation agencies throughout the country typically provide. This list helps to identify if there are any common program areas not offered by an agency. Most agencies offer a majority of the programs. In matching the City’s Recreation Services Division inventory against this list, over three quarters of the program areas, 76.6%, are represented. (Red text represents programs not offered.) The planning team is not suggesting that Recreation Services offer all of these programs – 80.9% is a very high percentage compared to the database of completed recreation assessments from across the country. As the City seeks out new program ideas, the activities in red would be appropriate areas of focus.
Active Adult Gymnastics/Tumbling Seniors Aquatics Historical Programs Specialty/Community Events
Before-/After-School Homeschool Programs Specialty Camps
Biking Horseback Riding Sports Instruction Birthday Party Services Ice Skating/Hockey Sports Leagues/Adult Childcare Language Arts Sports Leagues/Youth
Cooking Lifelong Learning STEM/STEAM* Dance Martial Arts Summer Camp (day-long)
Day/School Break Camps Music Sustainability/Green Esports Open Gym Teen
Early Childhood Outdoor Adventure Tennis Environmental/Nature Pets Therapeutic Recreation
Extreme Sports Performing Arts Trips Fitness Pickleball Visual Arts General Interest Preschool (9-month) Wellness Golf Running/Walking
Source: BerryDunn
*Note: Naturalists provide STEM/STEAM programs to schools and organizations in the region by request.
This section provides details about the core recreation programs offered by Recreation Services. Department leadership identified core program areas as:
• Aquatics
• Arts
• Adult Athletics
• Youth Athletics
• Camps
• Enrichment
• Events
• Health and Fitness
• Nature
• Seniors
• Therapeutic Recreation
The City owns and manages one outdoor public pool, the Miller Park Pool. Located in mid-town, this facility includes an Olympic size pool, a children’s swimming area, a water slide, high dive, and an area for very small children that includes a waterfall. This facility has an ADA accessible hydraulic life chair allowing those with special needs access to the pool. Miller Park Pool also has a concession stand for drinks and snacks. Historically, this facility opened and closed based on the Lynchburg Community Schools schedule. This facility is anticipated to be open to the public from Memorial Day to Labor Day from 1:00 pm to 6:00 pm beginning in 2022.
In addition to public swim, Recreation Services offers a variety of swim lessons for children ages 18 months through 15 years. Recreation Services also offers adult Learn to Swim classes as well. For children not ready to participate in swim lessons alone, there is a parent-child class for young children 18 to 48 months and a parent. For teens, there are several lifeguard training programs (training, certification, and re-certification) as well as a Water Safety Instructor class. An open swim time is offered for those that like to swim for exercise. Family events have included a dive-in movie, a Paws in the Pool pet event, the Great Cardboard Boat Race, and holiday celebrations.

The Riverside Park Sprayground provides summer fun for all ages. This facility includes dumping buckets, pop jets, and tulip sprays. Riverside Park Sprayground opens for the summer season May 1 to Labor Day and is open daily from 10:00 am to 7:00 pm.
Riverfront Park, located near the river in downtown Lynchburg, includes a fountain, which is open to the public. When the City hosts special events at this location, which occurs frequently, this area is closed to the public.

Lynchburg is known as an arts community and provides a wide variety of opportunities for artists of all ages. There are numerous arts academies, clubs, galleries located in Lynchburg. Dance, culinary, and a variety of preschool art-related classes are staples at Miller Center. Currently, the Department is fostering a partnership with the Renaissance Theatre Company as their theater-in-residence program to utilize Miller Center Theater as a community theatre performance. A year-long dance education program is offered in partnership with Kuumba Dance that provides studio quality dance education to participants who are unable to afford private studio education. This is a successful program that includes ballet, modern, tap, and AfroCaribbean classes for ages two years and older.
There is a plethora of art classes offered for adults including a number of acrylic and stained glass classes, a variety of pottery classes, several levels of tap dancing, DIY workshops, and painting. In all age groups, there are one-time art workshops with different themes, often relating to the season or a specific holiday.

The Jackson Heights Art Studio was originally built as an elementary school known as Jacksontown School. It was transformed into a community center in the 1960s and became the art studio in 2015. This facility provides opportunities to create pottery and stained glass. For pottery, the studio features 10 potter’s wheels, a slab roller, extruder, and a variety of clay and glazes for creating hand-built and wheel-thrown projects. To make stained glass, artists have access to grinders, light boxes, an array of textured and colored glass sheets, solder, and tools to make colorful window hangings. Per the staff who manages the facility and the art programs held at Jackson Heights Art Studio, there is a high demand for additional pottery and stained glass programs. However, due to limited space, and lack of a full-time staff member dedicated to the center, holding additional classes to fulfill this demand is currently not possible.
Additional art classes are held at Miller Center and Templeton Senior Center, but are highly focused on painting and crafting classes due to their lack of equipment and electrical work needed to offer additional pottery and stained glass classes out of these centers. The 7 Hills Art Club meets monthly at the Miller Center. The Neighborhood Centers offer some art classes on occasion as well.

The Adult Athletic programming in Lynchburg consists of many offerings including several levels of tennis instruction, and leagues for kickball, flag football, dodgeball, softball, and volleyball (only played at Lynchburg City Schools facilities). Some of the leagues are just for women, some just for men, and some are co-ed. Drop-in programs are offered such as pickleball. Adult athletic programs are held at Peaks View Park, Blackwater Creek Athletic Area, and the Armory. Fifty-Plus Athletics includes the Lynchburg Legends Softball League for men 50 and older and a drop-in senior softball pick-up game at Peaks View Park. Annually, athletic fields are open for play from March 15 to November 15.
The Athletics subdivision depends on the use of local school facilities to provide youth sports activities. Accessing the schools is becoming difficult due to scheduling conflicts. The City operates two gymnasiums, the Armstrong Place Gym, which is a middle school-sized junior basketball cour t and the City Armory, which has one full size and one junior size court. The use of the City Armory is limited to evenings and weekends. The Armstrong Place Gym is rented by the Department for recreation programs and leagues.
Outdoor field sports are played at Miller Park (which has three baseball fields), Peaks View Park (which has seven softball fields, three multipurpose athletic fields, four tennis cour ts, an 18-hole disc golf course, and over 20 miles of mountain bike trails), and Blackwater Athletic Area (which is slated to close in 2022).
Lynchburg offers a comprehensive instructional tennis program for youth ages 4 through 18 years on the courts at Peaks View Park. The tennis program has more than doubled in participation in the past five years under the leadership of the current head tennis professional.
In addition to a youth basketball instructional program for ages 6 through 8, the agency offers youth basketball teams for girls and boys ages 9 through 18 years. Additional athletic programs include disc golf lessons and kickball.
Lynchburg Parks and Recreation also partners with the following athletic organizations to offer youth athletic programming to the community:
• Blue Ridge Lacrosse Club
• Central Virginia United
• Challenged Sports Exchange (for people with disabilities)
• Girls on the Run
• Healthy Kids Running Series
• Lynchburg Little League Baseball
• Southwest Virginia Association Hill City Football and Cheerleading
• Greater Lynchburg Off-Road Cyclists (This group has an arrangement with Parks Services, which includes assisting with trail maintenance)
• Lynchburg Area Youth Sports Initiative (LAYSI)
There are concerns that barriers to participation in youth athletics exist for some in the community. These barriers appear to be based on transportation to and from athletic fields. This issue could be partially solved by organizing transportation for player in need. Additionally, development of practice fields in neighborhood parks may also allow for increased participation in youth athletics.
Lynchburg camp programs attract over 200 children each summer. Offerings include several specialty enrichment camps including:
• Local Superheroes! Emergency Services Camp
• Survivor Camp
• Make and Bake Camp
• Project Runway Jr. Camp
• Master Chef Jr. Camp

• Stop Motion Film Animation Camp
• Kayak and Canoe Paddling Camp
• Archery Camp
There are also camps (both half-day and full-day) offered by the Neighborhood Centers at several facilities including Fairview Center, Yoder Center, Diamond Hill Center, and Armstrong Gym.
Enrichment programs are offered for all ages in Lynchburg and attract over 1,000 participants annually. This is a very large program area Lynchburg categorizes enrichment programs into nine categories including:
• Culinary
• Enrichment
• Games
• Gardening
• Literary
• Preschoolers
• Presentations
• Technology
• Trips
Culinary programs are offered for all ages. For young children, programs include Family Culinary Night, Kids in the Kitchen (with several different themes), German Soft Pretzels, and Brunch. For teens, programs include knife skills, searing, frying, cupping and Mexican Fusion. For adults, offerings include Insta Pot Basics, Bean Burgers, Family Meal Planning on a Budget, Hearty Fall Salads, Break Making, DIY Wedding Cupcakes, Beyond the Box (Mac and Cheese and Lasagnas), Wine Making, Cast Iron Cooking, Couples Date Night, Backyard Charcoal Grilling, Smoked BBQ and Ribs, and Family Culinary Night. All of these programs are offered at the Miller Center except for German Soft Pretzels, which was offered at the Community Market.
The most popular general Enrichment offerings for youth include several programs focused on American Girl Dolls and Character Counts. For young adults, enrichment courses include Dengue: What you Need to Know, Rape Aggression Defense Class, and Family Internet Safety. For older adults, popular enrichment offerings include Bladder Fitness, Blessing Bags for the Homeless Assembly, Speaking Italian, Speaking German, the Benefits of Laughter, and Gardens of the World.
The enrichment programs that focus on Games include several levels of Bridge, Mahjong, and Canasta and are offered primarily for seniors.
Gardening enrichment programs are very popular in Lynchburg and include: flower arranging, rain barrel workshops, beekeeping, gardening by the season, and Lynchburg native plants.
Literary enrichment programs include poetry and novel writing.
The Preschool enrichment classes include several sessions that include a story and an activity or a story and a snack. Other offerings include a series themed “When I Grow Up” and “Build a Lunch.” The Naturalist and Citywide Recreation subdivisions have partnered to offer expansive preschool enrichment opportunities that are offered weekly. Programs include Preschool Ballet, Bake with Me, Interactive Story Time, Sensory Play, Nature Education, and Crafts.
Free enrichment Presentation programs include topics relating to history (Buffalo Soldiers of America’s West) or place (Cuba), something to celebrate (Black History Month), or topics related to health and wellness.
The free Technology enrichment offerings include Internet Safety, Cover Letters, and Resume Writing. In 2020, Templeton Senior Center staff developed a technology series called “Rec Tech.” In the fall of 2021, Templeton Senior Center staff partnered with the University of Lynchburg Beard Center of Aging to offer a new program within the Rec Tech series called “Help Desk” in which participants schedule an individualized appointment with a college student to receive technology assistance with items such as smartphone basics, using social media, Zoom, and email. This partnership with the University is expected to grow.
The Trip enrichment programs appear to be designed for a senior audience and include theater performances, festivals, luncheons, a Cruise on the Virginia Dare, and day trips to popular locations within a short distance (one to two hours) from Lynchburg.
Events are also very popular in Lynchburg, attracting thousands of attendees annually. Many events are free including the Movies in the Park, Celebration of Lights, Art in the Park (new), Glow Ride, Veteran’s Appreciation Luncheon, Haunted Trail (new), Easter Egg Roll, and Bunny Hop. Fees for other events are minimal and the most popular are Daddy Daughter Dance, Celebration of Lights Carriage Ride, and the Lynchburg Plunge. The Recreation Services staff rely on support from multiple divisions in the implementation of these events. These events are supported by the General Fund, sponsorships, and some vendor fees.
One athletic event, which is made possible by a partnership with Virginia Amateur Sports, is hosting the Commonwealth Games, an annual event held in July and open to all ages and skill levels. From archery to wrestling, this event offers sports competition venues for over 45 different Olympic and Pan American sports. The Games are held at Liberty University, Peaks View Park, Miller Park Pool, and various Lynchburg City School locations. The Athletics staff rely on the assistance of Parks Services, Buildings and Grounds, Lynchburg City Schools, and Liberty University to host this event. Although this event depends on the services of both the Athletics subdivision and the Parks Services Division, the City did not increase funding to these budgets to provide these services.
The focus of the Lynchburg Recreation Services Health and Fitness courses is active adults. Group fitness classes currently include Tai Chi, Modern Line Dance, Video Chair Exercise, Yoga, and Aerobics. Prior to the pandemic, fitness classes attracted over 560 registrants annually.
Lynchburg Wellness offerings include a wide variety of topics such as hearing health, headache relief, spinal screenings, CPR and AED classes, detoxing your diet, the importance of sleep, Herbalism, super foods, protein, fall prevention and recovery, breast feeding, and staying healthy and active. These programs are typically free, with many drop-in participants, and attendance is not accurately tracked in ReCPro.
With the eastern edge of Lynchburg bordering the Blue Ridge Mountains, easy access to the Appalachian Trail, and several bodies of water in and around the community, nature and outdoor recreation programming are also very popular with residents. Nature programming is divided into two categories: environmental education and outdoor recreation.
Environmental education programs for young children include Fish Printing, Creek Critters, Toddler Treasure Hunt, Nature Crafts, a series titled I Spy focusing on a different topic in each class (treasure hunt, family night hike, owls, the moon, and birding) and a variety of classes focusing on items found in nature such as owls, the moon, and birds. Outdoor Recreation for young children includes a Family Campout.
For youth, environmental education programming includes Birding for Beginners and outdoor recreation includes kayaking, canoeing, and archery. The Great Cardboard Boat Race is a popular nature event offered for ages eight and older. The Lynchburg Trail Challenge was a popular event in 2019 with over 150 participants.

In addition to the nature programs offered by Recreation Services to the general public, another 80 nature programs were provided in 2019 to Scout groups, school groups, birthday parties, and others, generating over $11,000 in additional revenue. The naturalists on staff have the ability to teach programs on a wide range of topics that appeal to a wide range of ages.
Nature programming for adults includes Birding 101, Deck the Halls Naturally, and Master Gardner Training. Outdoor recreation offerings for adults include: backpacking, campfire cooking, hiking, archery, biking, kayaking, canoeing, and several Outdoor Survival Skills classes (DIY Fire Starters, Build Your Own Stove, Ten Essentials for the Trail, and Pack Your Backpack). A few courses are offered specifically for women. Boat rentals are another popular outdoor activity with over 415 customers in 2019.
Templeton Senior Center is the City of Lynchburg’s only designated “senior” center, focusing on serving active adults aged 50 years and older. Within this age range, there are three demographics that the center serves: working 50+ adults, active retirees, and adults 70+. Within this range are three generations: newly Gen-X, baby boomers, and “The Greatest Generation” that survived WWII and the Great Depression. The mission of the Templeton Senior Center is to contribute to a healthy, active, and educated aging community by providing a community gathering space and creating opportunities for adults to participate in rich variety of recreational activities.
The 50+ generation is aging radically different than previous generations. Today’s older generation start businesses, run marathons, and travel widely. Active adults (baby boomers) have fast become the most soughtafter consumer group in the country. They make up over half of the U.S. population and have more disposable income than any other generation. With increased longevity and substantial wealth, they put a premium on health, wellness, and nutrition. The Department data indicates that this generation is not being served as much as it could be.
Senior programming in Lynchburg is comprehensive and includes art classes, athletics, enrichment (including culinary, games, presentations, and technology), fitness, wellness and trips. Programs are held in a variety of locations including Miller Center, Fairview Center, Templeton Senior Center, Peaks View Park, Yoder Center, Daniel’s Hill Center, Diamond Hill Center, and a few off-site locations (trips). Program fees are minimal and, often, programs are free of charge.
Currently, fitness and dance classes are offered in classroom space in Templeton Senior Center, which are not designed for these types of activities. Adding a new multipurpose facility with classroom space, meeting rooms, a dance studio, and gymnasium would allow the City to better serve seniors in the community.
Therapeutic Recreation is considered a core program by the citizens, staff, and the Director. Due to a lack of therapeutic recreation staff, only four programs in this category were offered in 2019 for children ages 10 and older including: Sensory Play, Pumpkin Rice Crispy Treats, Pottery, and Positive Paint. Of these four free classes, only two received registrations (3 each). This is an area where Lynchburg could focus efforts for future programming. In order to do so the following changes are recommended in order to ensure programming success including:

• Hire a full-time position for a Certified Therapeutic Recreation Specialist (CTRS).
• Add an additional budget line item for interpreters for the programs, as this service is required by the ADA.
• Purchase an accessible vehicle to transport participants to and from programs and events. Currently, the Department has bus with a wheelchair lift, but it is not accessible to participants due to the addition of a bus bench which was installed to create additional seating.
Table 5.2 shows the core programs offered by Recreation Services by season, along with the corresponding percentage of the whole, by both program area and season.
Table 5.2: Program Types by Season (2019)
Core Program Area
2019
Winter/Spring Summer Fall Total
offered % offered % offered % offered %
Aquatics 0 0.0% 37 15.3% 0 0.0% 37 5.1% Arts 70 28.0% 46 19.0% 61 26.9% 177 24.6%
Athletics/Adult 10 4.0% 9 3.7% 11 4.8% 30 4.2% Athletics/Youth 11 4.4% 13 5.4% 9 4.0% 33 4.6%
Camps 5 2.0% 11 4.5% 0 0.0% 16 2.2% Enrichment 58 23.2% 33 13.6% 59 26.0% 150 20.9% Events 7 2.8% 12 5.0% 8 3.5% 27 3.8% Health and Fitness 33 13.2% 28 11.6% 27 11.9% 88 12.2% Nature 19 7.6% 19 7.9% 11 4.8% 49 6.8% Seniors 37 14.8% 34 14.0% 37 16.3% 108 15.0% Therapeutic Rec 0 0.0% 0 0.0% 4 1.8% 4 0.6%
Total 250 34.8% 242 33.7% 227 31.6% 719 100.0%
Source: Lynchburg Parks and Recreation
Total programming across the three seasons was very consistent. Art had the highest total quantity of programs (177), which accounted for nearly 25% of the total and anywhere from 19% to 28% of the program menu in any given season. Enrichment programming is a close second at nearly 21% (or 150 programs) of the total offerings. Conversely, the area with the lowest quantity of programming is Therapeutic Recreation with 4 (0.6%). Athletics (both adult and youth), along with aquatics, camps and events all ranged from 3.3% to 4.9% of total programming. It should be noted that Lynchburg has an outdoor pool, but is lacking access to an indoor pool, so there are no aquatic programs offered during fall or winter/spring.
Figure 5.1 captures the quantity of total programming offered by Recreation Services during the year examined and how the programming was distributed across core program area categories.
Source: Lynchburg Parks and Recreation
Arts Enrichment Seniors Health & Fitness Nature Aquatics Events Athletics/Youth Athletics/Adult Camps Therapeutic Rec
The age segment analysis shows the distribution of program offerings according to the age segments serviced. For the purpose of this assessment, age categories were delineated according to the following age structure:
• Early Childhood, ages 0 – 5 years
• Youth, ages 6 – 12 years
• Teen, ages 13 – 17 years
• Adult, ages 18 – 49 years
• Active Adults, ages 50+ years
Table 5.3 shows the City’s 2019 program menu and percentage of programs offered per season and in total according to each age segment. This information was developed by reviewing the program data provided from the Lynchburg Support Services Manager. The number of program opportunities geared toward particular age groups were tallied for the three seasons. If a program section spanned clearly across two age categories (e.g., 8—14), that section was counted once in the youth and once in the teen categories. Special Events typically service participants of all ages and were, therefore, included in the all ages category. The age distribution within program offerings is as follows:
Ages
Fall Age Segment Total offered % offered % offered % offered %
Winter/Spring Summer
0 - 5 years 9 3.2% 22 7.7% 18 7.1% 49 6.0% 6 - 12 years 33 11.7% 56 19.5% 26 10.2% 115 14.0% 13 - 17 years 55 19.6% 56 19.5% 46 18.1% 157 19.1% 18 - 49 years 122 43.4% 103 35.9% 109 42.9% 334 40.6% 50+ years 37 13.2% 34 11.8% 37 14.6% 108 13.1% All ages 25 8.9% 16 5.6% 18 7.1% 59 7.2%
Season Total 281 100.0% 287 100.0% 254 100.0% 822 100.0%
Source: Lynchburg Parks and Recreation
The Adult category (ages 18 - 49 years) was the age group that had the highest quantity of programs planned at 334 programs or 40.6% of all programs offered. Programs for teens (ages 13 – 17 years) was the second-highest total offering, with 157 or 19.1% of the total. The Early Childhood category (ages 0 – 5 years) was the least likely to have programs with 6.0% of total programs available.
The planning team observed that the teen category tends to be a “spillover” age group rather than an age group where programs were designed specifically for this age range. Based on the program descriptions or the time offered, several of the programs that included 16 and 17 year-olds were specifically designed for adults. Some examples of these programs include adult sports leagues, a number of art and cooking classes, and all of the fitness classes. This is an important note to keep in mind when reviewing the segmentation analysis in this report. Figure 5.2 represents the full year’s programmatic opportunities by specific age segments.
Adult (18 - 49 years)
Teen (13 - 17 years)
Youth (6 - 12 years)
Active Adult (50+ years)
All Ages
Early Childhood (0 - 5 years)
Source: Lynchburg Parks and Recreation
A typical goal of a public recreation provider is to offer programs for all ages in a manner that balances resident demand with an equitable supply. Figure 5.2 depicts the programming age segmentation that currently exists. The segmentation review can be used to assess the extent to which each age group is being serviced. The segmentation does not necessarily need to mirror the community’s age demographic segmentation in an exact manner; however, an ongoing goal can be to balance the menu toward a reflection of the community makeup. The side-by-side comparison of the City’s actual population and Recreation Services program offerings in Figure 5.3 demonstrates the current scenario.

Youth 48.6% of population 40.6% of programs

27.3% of population 39.1% of programs


Adult 24.1% of population 13.1% of programs
Senior
As Recreation Services considers opportunities for program expansion, Figure 5.3 can help identify target areas for enhancements, additions, and/or innovations. Extending the programmatic reach to those age segments that have the highest spread between offerings and population is more likely to result in a higher potential of market capture (e.g., seniors with a current 10.9 percentage point difference).
Considering the age demographic data of the City, staff should give attention to programming for the growing population of residents over the age of 50.
While conducting this exercise, the planning team noticed that there is not much conformity to how age ranges are applied to programs and it was impossible to determine which programs were cancelled due to low enrollment.
In 2019, 47 programs were offered for ages zero to 250 years. This information is included in the registration software but not seen by the public in the program guide. Some of these programs were clearly not for young children including Smoked BBQ and Ribs, Beachbody Fit Club, and The Legendary Buffalo Soldiers of America’s West. Looking back at the data of the ages of the participants in these programs could provide staff some direction on a more appropriate age range.
In reviewing the same data from 2019, there are several programs that range in age from 5 to 17 years. This is a very large span and the difference between 5 year olds and 17 year olds is vast. Going back to the data to see what the ages were of the actual class participants and tightening up future age ranges may be worthwhile. Some other interesting observations for programs for those ages 7 to 250 years included Square Dancing, several American Girl Doll classes, and Zombie Laser Tag. The age range of 8 to 17 years was also common in this data and included programs such as Birding, Kayaking, and several Archery programs.
The age group for all of the therapeutic recreation courses offered in 2019 was 10 to 110 years. Based on the titles of the courses, a more appropriate age range would be 10 to 14 years. The Teen Paint Night age range was for ages 11 years to 250 years. A more appropriate range would be 11 to 15 or 16 years.
Currently, the Recreation Services part-time staff and contractors select the ages they feel are appropriate for their programs. The planning team recommends that the Recreation Services staff come up with some firm guidelines regarding age ranges. It’s understandable that some may fit outside the range (like Kids Free Tennis Day), but creating some target choices will help ensure the integrity of the program data.
A total of 155 programs offered in 2019 were free-of-charge and many others had very low fees. It would be a good exercise for the team to reevaluate all of these free programs as none are covering the cost of electricity, heat, custodial, building repairs, promotion, or registration staff.
From 2017 through 2019, the number of total programs offered by Recreation Services only differed a bit. From 2017 to 2018, program offerings dipped 13% (from 836 to 779). From 2018 to 2019, program offerings dipped again but by less at 7.3%. Total program attendance increased from 2017 to 2018 by 11.5% (up 710 program participants). From 2018 to 2019, program attendance decreased by 6.7% (down 462 program participants). Figure 5.4 shows programs offered and program participation over the three-year period.
Figure 5.4: Recreation Services Program Trends
Source: Lynchburg Parks and Recreation
It is important to note that these totals do not include offline nature programming, which are the nature programs that are not offered to the general public but requested by school groups, birthday parties, or scout groups. In the registration software, the total programs requested are tracked, but the participation totals are not, so those were removed for these figures. A total of 33 offline courses were requested in 2017, 41 in 2018 and 32 in 2019. These courses have been a good source of revenue for this growing program area and an indication of the importance of these programs in the community.
In Figure 5.5, the total number of program areas for all of the core programs are charted for 2017, 2018, and 2019 showing fairly stable offerings with dips in arts, health and fitness, and seniors.
2017 2018 2019
Figure 5.6 includes program participation for 2017, 2018 and 2019. For the most part, the participation trends are in close alignment with programs offered with a couple of exceptions. The number of events offered stayed about the same, but the participation increased over the three-year period. With seniors, the number of programs offered decreased over the three-year period, but there was an increase in participation from 2017 to 2018.
2017 2018 2019
Source: Lynchburg Parks and Recreation
Overall, the Recreation Services staff provide a variety of programs that are well-attended and program offerings and program registration remain stable. There is concern among the staff members that marketing and promotion is lacking and that not all programs are included in the three seasonal program guides. If this issue is addressed, and the guide size (number of pages) is increased to its former number of pages, one would expect participation to increase. Although there is a desire and push to get residents to visit the website, across the country, the seasonal program guide is still the most important tool for people to use to find information regarding recreation programs and services. Another suggestion would be for the Department to develop an app for classes and programs that includes information such as time, location, reminders about upcoming programs, etc.
In order to benchmark Lynchburg Recreation Services to similar providers, the NRPA Park Metrics program was used. This program replaced the former NRPA Standards in 2009 because it was determined that there is not a single set of standards for parks and recreation that could possibly encompass the uniqueness found in every community across the country. Communities vary greatly in size, needs, and desires; so too should their recreation offerings. To assume that agencies in Virginia, Washington, and Florida should hold themselves to the same standard is unrealistic, impractical, and potentially detrimental. The NRPA Park Metrics program is the most comprehensive source of data benchmarks and insight for park and recreation agencies.
The NRPA Park Metrics program breaks down data into a lower quartile (the lowest 25%), a median (the standard), and an upper quartile (the top 25%) and provides agencies an opportunity to look at their peers and to evaluate how they compare.
For this analysis, the following information was entered into the Park Metrics database: city systems with a population of 50,000 to 100,000 in Virginia and in the surrounding states for 2019. The following seven park and recreation systems came up as comparable agencies to Lynchburg from the Park Metrics Database:
• City of Bartlett, TN Parks and Recreation (population: 59,102)
• City of Gastonia, NC (population: 75,887)
• Greenville, NC Recreation and Parks Department (population: 91,921)
• City of Kannapolis, NC Parks and Recreation (population: 48,630)
• Kingsport, TN Parks and Recreation (Population: 53,376)
• Rockville, MD Recreation and Parks Department (population: 67,542)
• City of Rocky Mount, NC Parks and Recreation (population: 54,548)
It should be noted that not all agencies enter their system’s data into the system (for example Lynchburg is not in the database). Table 5.4 shows how Lynchburg compares to similar park and recreation systems within Virginia and in the immediate surrounding states. Table 5.4 includes respondents in the lower quartile (bottom 25%), the median (or average), and the upper quartile (top 25%).
Lower Quartile Median Upper Quartile Lynchburg
Percentage of agen cy’s total operating expenditures for the following categories:
Parks 31.0 40.0 48.5 25% Recreation 38.5 50.0 61.5 65% Other 6.5 13.0 15.8 10%
Agency’s total annual non-tax revenues $448,206 $973,000 $3,529,395 $518,000
Total number of full-time equivalent employees (FTEs) 48.5 73.2 129.8 52.6
Total number of pro grams offered 111 200 336.3 567
Number of volun teers 137.5 341 2,112.5 1,055
Total hours worked by volunteers 1,459 2,500 17,651.5 16,357
Source: https://www.nrpa.org
To summarize Table 5.4:
• Lynchburg spends less on parks than all others, but a good portion of park maintenance in Lynchburg is provided by Public Works, which is not included here.
• Lynchburg spends more on Recreation than all others because it does not have a comparable park maintenance budget.
• Although providing more than double the programs, Lynchburg is near the bottom quartile in full-time staff.
• Lynchburg relies heavily on volunteers. In 2019, Lynchburg had a total of 1,055 volunteers (much higher than the standard but below the upper quartile) who provided a total of 16,357 hours of time. This total is much higher than the median and only slightly below the upper quar tile. This is an area where additional staffing should be considered to keep up with the demands.
The overall story of the NRPA Park Metric data is that the investment into recreation programming has paid off with a very high number of program offerings, which have been summarized in earlier sections of this report.
The Lynchburg Parks and Recreation Department includes the management and oversight of six Neighborhood Centers including: College Hill, Fairview Heights, Diamond Hill, Daniel’s Hill, Jefferson Park, and Yoder. The purpose of the six Neighborhood Centers is to provide services, spaces, and connections, which build strong neighborhoods. Services are connected to three broad areas including supporting work, family, and education.
The six Neighborhood Centers were established in central neighborhoods between 1964 and 1991. The facilities range in size from 3,500 square feet to 4,500 square feet, are of similar design and construction, and serve as activity hubs for neighborhood residents of all ages. Much needed upgrades were made to all six sites over the past three years. Each center includes a large recreation room, a small classroom, a kitchen, bathrooms, and an office. The large open recreation room has been designed as a flexible space to serve as one large room for community gatherings or as a series of interconnected areas for small-group activities. Each center is supervised by a full-time senior recreation specialist and two part-time staff. Additionally, there are volunteers who provide assistance with Neighborhood Center programming.
The Neighborhood Centers are located in low- to moderate-income neighborhoods. Staff members are committed to improving the quality of life for neighborhood residents, by working with nonprofit and government partners, to deliver relevant services.
Although much of the programming framework at the six centers is similar, each senior recreation specialist has the ability to add programs and events as needed. Typically, programming includes the following:
• After-school programming
• Classes and workshops
• Open recreation
• Caregiver-attended preschool programs
• Summer camp
• Senior programs
• Holiday celebrations
• Special Events
• Neighborhood meetings
A description of services provided at neighborhood centers is included in Appendix G.
Select centers may also offer meal nights, serve as neighborhood watch meeting locations, and provide additional out-of-school time services.
Program registration is conducted through the Department’s RecPro system for some programs. In addition, daily participation and center attendance are tracked manually, via sign-in sheets and entered into a database.
The high level of contact hours at the Neighborhood Centers is also important to note. For example, a child who comes to an after-school program could be at the center for 2.5 to 3 hours after school five days a week for the entire school year (up to or exceeding 450 hours). This is vastly different than a child who signs up for a 30-minute eight-week swimming class or a 90-minute, ten-week art program. These are important items to note as the participation data for the Neighborhood Centers is reviewed and comparisons are made between the two service areas.
Table 5.5 shows program participation detail for 2019. During this time period, Jefferson Park was closed for renovation, so there is no data for that facility. All neighborhood centers were renovated over a three-year period from 2019 to 2021. Participation data reflects these temporary closures.
Center Activity
Youth Teen Adult 50+ Total % of Total
College Hill After-School Program 619 1,438 351 22
Classes/Workshops 0 0 191 10 Holiday Celebration 15 25 20 15 Open Recreation 141 277 69 0 Preschool Playgroup 16 0 11 0 Special Event 0 786 9 0 Summer Camp 211 0 0 0
College Hill Totals: 1,002 2,526 651 47 4,226 16%
Daniel’s Hill After-School Program 2,144 345 59 2
Early Dismissal 12 12 0 0
Center Meal Night 0 0 24 8 Classes/Workshops 31 0 32 19 Open Recreation 28 12 0 0 Preschool Playgroup 862 20 811 7 Senior Program 11 0 29 293 Special Event 0 0 18 0 Summer Camp 537 123 0 0
Daniel’s Hill Totals: 3,625 512 973 329 5,439 21%
Diamond Hill After-School Program 1,740 754 458 278 Classes/Workshops 0 0 27 111 Holiday Celebration 22 15 26 36 Neighborhood Watch 0 0 20 5 Open Recreation 0 0 21 43 Senior Program 0 0 63 296 Special Event 16 17 209 82 Summer Camp 923 147 32 24
Diamond Hill Totals: 2,701 933 856 875 5,365 20%
Fairview After-School Program 3,797 6 162 0
Early Dismissal 61 0 4 0
Center Meal Night 117 0 96 0
Classes/Workshops 0 0 4 971
School’s Out 578 0 50 0 Senior Program 5 0 81 1,255 Special Event 3 0 12 0 Summer Camp 489 0 0 0
Fairview Totals: 5,050 6 409 2,226 7,691 29%
Table 5.5:
Yoder
After-School Program 1,587 713 18 17
Preschool Playgroup 11 0 11 0 Senior Program 0 0 0 313 Special Event 0 0 38 0 Summer Camp 790 0 0 0
Yoder Totals: 2,388 713 67 330 3,498 13% Grand Totals: 14,766 4,690 2,956 3,807 26,219
Percent of Total: 56% 18% 11% 15%
Source: Lynchburg Parks and Recreation
Review of this data indicates that the programs for children are the most popular, making up over 56% of all attendance. Fairview is the most visited site overall with 29% of the total and has the greatest attendance for the After-school program and Senior programming.
There are some very large differences in participation between a couple of the centers for specific program areas such as the preschool playgroup that attracted:
• 11 at Yoder
• 16 at College Hill
• 862 at Daniel’s Hill
Staff have relayed that center facility renewal programs disrupted these services from 2017 to 2020. The Yoder playgroup was started in 2019; Daniel’s Hill playgroup was started in 2013; and College Hill does not have a playgroup.
Regarding the special events for teens, the numbers are as follows:
• Daniel’s Center, Fairview and Yoder attracted zero
• Diamond Hill attracted 17
• College Hill attracted 786
• Approximately 300 visits at Daniel’s Hill, Diamond Hill, and Yoder
• Over 1,200 visits at Fairview
According to staff, College Hill was not fully staffed and did not have a senior program. Daniel’s Hill, Diamond Hill, and Yoder Center held senior programming one day per week, while Fairview Heights Center held senior programming three days a week.
There is a great deal of collaboration between the Neighborhood Centers and other City departments including Community Development, Lynchburg City Schools, and Lynchburg Health Department as well as with nonprofit partners. The Centers are providing food to the neighborhoods through partnerships with the National School Lunch program and the Blue Ridge Area Food bank.
At times, it can be difficult for the Neighborhood Centers to get services from Park Services. Park Services is responsible for cleaning the Centers and Public Works is tasked with making facility repairs, but repairs don't always occur. Park Services has two staff who clean all six Centers in the evening and if one staff is out, not all Centers get cleaned. This means that the Center staff must clean their own facilities on top of the rest of their responsibilities. It appears improved communication systems would help these two important staff groups work together more efficiently. For example, at the time of the staff interviews there were several outstanding maintenance requests: leaky pipes in one center, missing ceiling tiles in another, and a set of lights out at a third.
Although there is already a collaboration with Recreation Services (for aquatic and environmental programming), there is an opportunity to find ways to work together. Since the centers are located outside of the Department headquarters, where the majority of offices and staff are housed, connection must be thoughtfully addressed.
In a post-pandemic world, Center staff are looking forward to offering new programming in outdoor spaces and creating programs that focus on culture and nature and how they connect. All staff are anxious for the City to connect all of the Neighborhood Centers to the main trail system and plan to work to connect people to other public spaces via the trail.
The COVID-19 pandemic hit in March of 2020 and programming changed. The Centers have remained open throughout the pandemic and have adapted to various safety requirements. Initially, the Centers were hubs for light-touch services, including Lynchburg Cares Covid-Safety Kits, fresh produce and pantry items, recreation-to-go supplies, and meals for children. Outdoor programs were later incorporated and eventually indoor/outdoor services resumed.
These Centers play a vital role in each of the neighborhoods they serve. The City has recently reinvested in the Neighborhood Centers through facility renewals and staff. Each site is now staffed with one full-time staff and two part-time staff. Staff are now connected to the neighborhoods and to their goals, which makes the future very bright. It was noted during the staff focus groups that additional centers may be needed in other low-income neighborhoods in Lynchburg, such as the areas of White Rock Hill, Midtown, Bedford Avenue, Tyreeanna/Pleasant Valley, and College Park.
To obtain input from residents, the Lynchburg staff hosted a total of 18 pop-up events between April 1 and May 6, 2021. These events were held at a variety of Lynchburg parks, at the Community Market, and at several Neighborhood Centers. Over 2,000 people participated in these events and shared their thoughts regarding recreation programming and facility needs. The highest attendance occurred at Yoder Center on April 14 with 90 people in attendance.
The top eight requested programs from the pop-up events include:
• Concerts
• Movies in the Park
• Gardening classes
• Arts festival
• Programs for people with special needs
• Cooking and nutrition classes
• Adult fitness/wellness
• Nature programs
The free concerts and movies that public park and recreation agencies offer are commonly enjoyed by residents across the country. Residents are often eager for more of these types of events, especially with the notion of being outdoors in conjunction with the COVID-19 pandemic. Securing sponsors and adding movies at the Neighborhood Centers might be an ideal way to connect with all of the families in the area. Although Recreation Services offers an art festival called Art in the Park, there appears to be a desire for more of these types of events.
Riverfront Park, Lynchburg City Stadium, and E.C. Glass School could be the major venues for concerts going forward. Riverfront Park and Lynchburg City Stadium could host during warm weather months while E.C. Glass could provide an indoor setting for winter months or specific acts that are better suited for an indoor venue.
Recreation Services already offers many gardening classes, but more research might be conducted to determine if the programs are offered on the appropriate day, and at the appropriate time and location. A total of 16 gardenrelated classes were offered in 2019 and there were no waitlists. Although a third of the programs offered had a solid enrollment of 10 or more participants, three had one or two participants. Half of the courses were about creating a rain barrel, so it is possible residents are interested in more in-depth gardening classes.
Programs for people with special needs rated highly during the engagement and based on the program data, this should be an area of focus for Lynchburg. Although this is considered a core program area, only four programs for people with special needs were offered in 2019. Adding a therapeutic recreation programmer to increase programming in this area is recommended.

Nature programs also rated highly during the pop-up engagement. This is another area where the Department excels. A desire for a Nature Center also rated in the top ten requested facilities. This is clearly an area where residents are seeking more in terms of programming and indoor facility space. A logical addition to Recreation Services is a Nature Center and additional staff to meet the increasing programming demands of the community.
Community service or clean-up events are typical as many in the active adult age group are looking for ways to give back to the community. These types of events are already held at the Neighborhood Centers and through Citywide Recreation and Volunteer Services, but it appears more of these types of events are desired.
An interest in more fitness and wellness was also a very common response during public engagement regarding parks and recreation needs. Recreation Services offers a wide variety of health and wellness programs throughout the year. In looking at the data for 2017, 2018, and 2019, there were virtually no waitlists for fitness classes and between 21 (2019) and 41 (2017) of the classes offered had four people or less registered. If the community does desire more health and fitness classes, more research should be conducted to determine what people are looking for, when they want it offered, and where they are willing to go to participate.
There is already a great deal of successful programming in place in Lynchburg – at both the Neighborhood Centers and through Recreation Services. The Neighborhood Centers staff should continue to survey their program participants to see what program offerings are missing. Future programming in Recreation Services should focus on adding programs for early childhood, youth sports, STEAM/STEM, therapeutic recreation, and active adult programs. Table 5.6 lists some examples of possible new offerings.
Music Science Sign Language
Youth Sports
Toddler Open Gym Tumbling Nature Based Preschool
Badminton Dodgeball Gymnastics/Tumbling Pickleball ESports
Lego ® Model Building Minecraft Movie making Robotics 3D Printing Video Game Design
Therapeutic Recreation
Bowling Horseback Riding Socials Day Camps Overnight Trips Special Olympics Sports Programs Special Events Performing Arts
The Lynchburg Recreation Services Division offers a wide variety of programs for active adults (technology, lunch events, fifty-plus softball, many fitness classes, trips, discussion groups, games, estate planning, Medicare, and fall prevention to name a few). No program recommendations have been made for the active adult group.
The planning team suggests this group of participants be surveyed or some focus groups scheduled to learn more about their needs when it comes to recreation programming. It should also be noted that many seniors are served by the Neighborhood Centers in Lynchburg and not included in this data.
The following recommendations are listed as recommendations for Recreation Ser vices, recommendations for Neighborhood Centers, and recommendations for both.
1. Create a phased staffing plan to support therapeutic recreation, volunteer coordination, neighborhood centers, athletics, and aquatics.
2. Add indoor programming space to include a new gym with multiple sports courts; a new, larger facility for the arts studio (with multiple classroom spaces, adequate storage, and a kiln room); a new facility for the Senior Center (to include a full range of programs and services); and construction of the Ivy Creek Nature Center.
3. Add additional lighted multipurpose athletic fields.
4. Increase access to local bodies of water for kayaking and canoeing, specifically on the James River. Include water access, a large parking area, easy boat launch access, restroom facilities, an indoor facility with boat storage, and picnic tables. Boat launches should be easily identified from downtown with signage along roadways. Also include boat launch information online.
5. Evaluate the capacity of the existing ReCPro software system to determine if this is the proper recreation registration software for Lynchburg. Provide designated staff support for the system and/or replace (with a more suitable software solution).
6. Develop a more comprehensive cost recovery policy that highlights opportunities for low-cost or no cost programming for youth and families.
7. Improve customer service by extending registration hours beyond 5:00 pm on weekday evenings. Provide more opportunities for customers to access services online such as renting a room or an athletic field and scholarship applications.
8. Perform an annual review of programs and use focus groups to determine new programming, as well as what should be eliminated based on low enrollment. Senior and adult fitness programming, childcare, Esports, extreme sports, gymnastics/tumbling, pet programming, preschool (early childhood), STEM/ STEAM, gardening classes, and therapeutic recreation programs were all suggested during the public engagement process.
9. Review program participation data and create some firm age ranges for future programs and encourage part-time staff and contractors to select from those ranges.
10. Increase the number of pages in the program guides and include a complete list of programs. Feedback during public engagement indicated the primary means which parents and seniors learn about programs and services are the seasonal program guides.
1. Enhance the means through which visitors sign-in for programs and services. Work with staff to improve the efficiency of data tracking through a database such as ReCPro or a similar system.
2. Improve the communication between Public Works staff and Neighborhood Center staff. Track when requests are made and when completed. Work with staff to reduce the gap in time from request to completion. If additional staff positions are needed, look to add these with the other staffing needs.
3. Add additional neighborhood services in other Lynchburg neighborhoods such as White Rock Hill, Midtown, Lower Rivermont (Bedford Avenue), Tyreeanna and Pleasant Valley, and College Park.
1. Increase the collaboration and connection between the Neighborhood Centers and Recreation Services. Identify opportunities for these groups to work together more frequently, from simply changing the time of the department staff meeting to staff training, onboarding, staff development, and event planning.
 Lynchburg skyline
THIS PAGE INTENTIONALLY LEFT BLANK
As with any parks and recreation department, the planning and implementation of capital improvements for Lynchburg are critical to the execution of its service delivery to the community. The Park Classifications and Service Criteria section findings suggests multiple proposed investments in facilities to address current and future community needs. Additional findings identified a potential need for more neighborhood parks for underserved areas in the community. Future expansion will address deficiencies in the Lynchburg Parks and Recreation Department's (the Department's) established levels of service as well as its service area coverage. At a minimum, these new neighborhood parks should contain a mixture of both active and passive multi-generational recreation facilities, including, but not limited to, open greenspace, walking trails, pavilions, restrooms, playgrounds, and fitness equipment. The connectivity analysis and public input identified several opportunities to expand trails and greenways. Implementation of these findings will require strategic phasing and funding over several years.

In response to these recommendations, a ten-year capital spending plan is provided, which defines costs for recommended improvements to existing and proposed parks and park facilities. The Department will have to provide additional facilities to meet citizen needs and improve service delivery where not adequately provided. Additionally, the community has identified a need to leverage the James River as a regional recreational asset. It is important to the community to have public access to this regionally significant resource. The needs for capital investment correspond with an identified need to invest in existing park and recreation facilities to improve the quality of service, foster a sense of community, and enhance the overall health of residents.
The recommended funding distribution for these projects is presented in three prioritization levels or tiers. Tier 1 is generally intended to address immediate needs, such as ADA access improvements, general safety renovations, urgent renovation projects, and planning efforts for upcoming projects. Funding shown in Tier 2 is for the development of new facilities that are currently in the planning stages as well as initial development of the expanded trail and greenway network. Additional funding for continued renovations to existing parks is in this tier as well. Tier 3 projects have been identified as upcoming needs that are not currently funded. As with Tier 2, the third tier also includes funding for continued renovation to existing facilities and sport field conversion. The capital improvement budgets shown are recommendations from the planning team based on experience with similar scale projects in the region.
This capital improvement plan (see Table 6.1) identifies approximately $107,150,000 in renovations and new facility development. Projects in Tiers 1 and 2 have an approximate value of $63,050,000. Tier 3 projects have approximately $44,100,000 in anticipated costs. A "future" category is provided in the table that can be used for important efforts that fall just outside higher priority needs. This allows decision makers to recognize longer term needs that may require more time to address. The approximate value of these future projects is $4,000,000.
The planning team learned during the community engagement process that 59% of survey respondents support additional spending to fund recreation and parks system improvements. Most of these respondents were willing to pay between an additional $1 and $15 per month. The City could collect this amount in a number of ways. One way could be through a “Friends of the Parks” 501c3 organization. The planning team estimates this might generate between $200,000 to $3 million in additional annual revenue for park improvement efforts if 60% of Lynchburg households participated. Four hypothetical scenarios are shown for illustrative purposes in Figure 6.1. $1 increase per month $5 increase per month $10 increase per month Total HH 60% of HH 1 5 10 28273 16,964 203,565.60 $ 1,017,828.00 $ 2,035,656.00 $
Figure 6.1: Potential Increased Annual Revenue
$3,500,000.00
$3,000,000.00
$2,500,000.00
$2,000,000.00
$1,500,000.00
$1,000,000.00
$500,000.00
$203,565.60
$1,017,828.00
$2,035,656.00
$3,053,484.00 $-
$1 increase per month $5 increase per month $10 increase per month $15 increase per month
The spending plan highlights the safety and accessible items identified by the planning team during the facility site visits and discussed in the facility assessments. Those items are identified for potential spending in the first two years of the spending plan as well as several maintenance issues. Other expenditures are distributed in the table over the course of the remaining years.
The following provides a summary of the total costs identified in the spending plan:
• Accessibility and general park improvements: $11,000,000
• Existing park renovations: $36,500,000
• New park and facility development: $54,400,000
• Trail development: $9,250,000
The top Capital Improvement Plan projects in each of the four categories above are as follows:
Accessibility and general park improvements: $11,000,000
• ADA and general park improvements - $5,000,000
• Security for parks improvements - $2,500,000
Existing park renovations: $36,500,000
• Heritage Park expansion - $3,000,000
• Miller Park Pool Reimagined - $7,000,000
New park and facility development: $54,400,000
• Multipurpose recreation center - $25,000,000
• Brookville Neighborhood Park - $3,075,000
• Rivermont Neighborhood Park - $3,075,000
Trail development: $9,250,000
• Greenways - $3,000,000
• Blueways - Water recreation trail - $250,000
THIS PAGE INTENTIONALLY LEFT BLANK
Table 6.1: Lynchburg, Virginia - Ten-Year Capital Spending Plan
Accessibility Improvements and General Improvements
$1,500,000
on-going investment $5,000,000
Park and Trail Security Initiative $2,500,000
$500,000 $500,000 $200,000
Athletic Field Maintenance/Improvements on-going investment $2,500,000
Sustainability Improvements (solar, stormwater, etc.) on-going investment $1,000,000
$11, 000 000
Templeton Senior Center Expansion $10,000,000
Heritage Park Expansion $3,000,000
$10,000,000 $2,500,000
College Park - Master Plan Implementation $3,000,000
Milller Park Pool Reimagined $7,000,000
$1,250,000 $1,250,000 $500,000 $3,000,000 $7,000,000
Community Market Renovation $4,500,000
$750,000 $1,750,000
City Stadium - Visitor Side Improvements $750,000
City Stadium - Sports Turf Replacement $1,750,000
$750,000 $750,000 $300,000 $2 200, 000 $3,500,000 $1,000,000 $2,500,000
$500,000 $3 250, 000
Jackson Heights Art Studio Expansion $2,500,000
Jefferson Park - Phase 2 and 3 $4,000,000 $4,000,000
$5 500, 000
$4 000, 000 $36, 500 000
Multipurpose Recreation Center (with Aquatics) $25,000,000
Whitewater Park and Riverfront Improvements $5,100,000
$75,000
Land acquisition costs not included.
Opinion of cost estimates as of January 2022.
Brookville Neighborhood Park $3,075,000
Beechwood Hills Neighborhood Park $3,075,000
$3,000,000 $3,000,000
Rivermont Neighborhood Park $3,075,000
$2,500,000 $3, 300 000 $5 500, 000 $29 000, 000
$100,000 $3,000,000 $5,000,000
$75,000 $75,000
$1,000,000 $4,000,000
Tyreeanna/Pleasant Valley Community Park $10,000,000
Windsor Hills/Leesville Road Community Park $5,075,000
$2,000,000
$75,000 $7 775, 000
$54,
$3,000,000 $75,000 $75,000
*Based on current market trends, anticipate construction cost escalation of approximately 5-7% annually for budgeting.
$250 000 $2 075, 000 $55, 275 000
$25, 150 000 $3, 075 000
Greenways Expansion (7 miles) on-going investment $9,000,000
Blueways - Water Recreation Trail (signage, launch upgrades, etc.) $250,000
$5,000,000 $10,000,000 $4 100, 000 $100,000
$23, 750 000 $25,000,000 $44 100, 000
The City should consider a combination of funding resources, which includes increasing revenues, considering utilization of special taxes, and securing grants and private funding to meet the capital improvement goals identified in this report. The combination of these funding sources would increase the ability to make identified improvements.
Many funding sources are available that the City should consider for funding capital improvements of parks and recreation facilities. While this document lists the following as options to consider, local leaders must decide which options best suit local needs. Historically, the main sources of capital funding for parks and recreation agencies in the state of Virginia are:
• General Fund Tax Dollars
• General Obligation Bonds
• Sales Tax
• Program User Fees
• Impact/Development Fees
• Tax Dollars from Special Excise taxes (such as hotel, liquor, food, and rental taxes)
• State and Federal Grants
These options offer stable funding for parks and recreation depar tments to cover operational costs and some capital improvements associated with routine maintenance projects or minor renovation projects. In general, these funding sources may not support larger projects unless leveraged with significant bond programs.
Communities across the country fund capital projects using general obligation bonds to build public facilities while spreading the facility cost over an extended period.
The use of a bond program would be a viable option to initiate a major capital program for parks and recreation facilities. The City could initiate a bond to fund a portion of the capital projects outlined in this master plan. The bond would be paid back by the City over a 20- or 25-year period and would allow the City to begin to meet the facility needs of the community.
Sales taxes are applied to almost everything that is purchased as a good or service. There are often exemptions for necessities such as groceries. Lynchburg currently has a 1% sales tax in addition to the Virginia sales tax of 4.3%. Sales taxes are paid by Lynchburg residents along with individuals or businesses visiting the City. In this way, a sales tax can leverage dollars from outside of the community to fund local improvements.
User fees assessed by parks and recreation agencies vary across the state. Fees can be charged by the Department to support facility maintenance, added to program registrations, or required for park access on a daily or annual basis. Other user fees include memberships to special facilities and centers and program fees charged for instructional programs. The combination of these fees can generate major revenue for the City.
Program user fees are a collection of entry fees and program registrations. These fees are primarily used by the City to offset the operating costs required to provide services to Lynchburg residents.
The Lynchburg Parks and Recreation Department currently has a broad-based cost recovery plan that could be used as a guideline for setting fees and systemic resource allocation. An expanded description of the cost recovery and subsidy allocation policy is provided in Appendix H.

Venue fees for special events are being considered by the Department. These fees would set flat rate fees for events like trail races or neighborhood events held in a small park or larger city-wide park. These fees are intended to cover cost related to event set up, take down, and clean up.
Impact fees are payments required by local governments of new development for the purpose of providing new or expanded public capital facilities required to serve that development. The fees typically require cash payments in advance of the completion of development, are based on a methodology and calculation derived from the cost of the facility and the nature and size of the development, and are used to finance improvements offsite of, but to the benefit of the development.
The Commonwealth of Virginia allows communities to impose and collect impact fees in amounts consistent with the methodologies used in its comprehensive plan to defray the capital costs of public facilities related to residential development. Such fees can only be used by the City for public facilities that are impacted by residential development. State legislation in Virginia includes parks, open space, and recreation areas and related facilities.
Many communities across the country are incorporating lodging taxes to pay for tourism-related programs, including parks and recreation improvements. This method is typically popular because it typically places the cost on visitors and not residents. Counties have implemented, or are considering instituting, a lodging tax to fund future capital improvements that may lead to increased tourism. Silverthorne, Colorado, for example, passed a 2% lodging tax in 1999. Total collections have been divided: 85% going towards capital projects relating to parks, trails,
open space, and recreation and 15% to help market the Town of Silverthorne and its amenities. Other communities from Washington to Texas have adopted similar funding measures that have helped develop large-scale recreation facilities that have attracted more visitors.
Grant programs for parks and recreation improvements are available through various state and federal agencies. Many state agency grants allocate federal dollars for projects such as transportation enhancement grants, trails and greenways, and parks improvements. Grants are also available through non-profit and not-for-profit agencies. Because grants are typically highly competitive, any pursuit to acquire grant funding should begin with an understanding of the grant requirements, including matching fund requirements, understanding what the grant will and will not cover, the time frame for completion, and what obligations may be required in the future, such as deed restrictions, maintenance and reporting.
A few examples of alternative funding sources include the following:
• Transportation Grants /SAFETEA-LU
• Transportation Enhancements (TE)
• Recreational Trails Program
• Community Development Block Grants (CDBG)
• Environmental Education Grants
• Land and Water Conservation Fund
The Safe, Accountable, Flexible, Efficient Transportation Equity Act: A Legacy for Users (SAFETEA-LU) provides funds for various transportation projects, including greenways. Built upon the foundations of the Transportation Equity Act for the 21st Century (TEA-21), SAFETEA-LU was signed into law in August 2005.
The Transportation Enhancements (TE) program funds a wide variety of transportation related community projects. This program is the largest source of funding for trails and related facilities. Transportation Enhancement projects must relate to surface transportation and compete against numerous other projects. Greenways and other recreational trails are eligible for TE funding, if the project has a transportation element being funded.
There are 12 eligible Transportation Enhancement categories. The three that most relate to greenways and recreational trails are: pedestrian and bicycle facilities; pedestrian and bicycle safety and educational activities; and conversion of abandoned railway corridors to trails. These grants are 80% federal and 20% local funding. Therefore, the City receives $4.00 for every $1.00 invested.
This program was initiated through the TEA-21 legislation. Funds are awarded for the construction of trails and support facilities. Emphasis is on the construction of multi-use trails such as biking, hiking, equestrian, motorized, etc.
Although this program specifically funds housing, public facilities, economic development and community projects, recreation could be a minor component of the project seeking grant funding. The City has used these funds to facilitate baseline renovations to the neighborhood centers, to expand trails, and for the renovation of athletic and community park facilities.
This program is sponsored by the Environmental Protection Agency's (EPA) Environmental Education Division (EED), Office of Children's Health Protection and Environmental Education. The program supports environmental education projects that enhance the public's awareness, knowledge, and skills to help people make informed decisions that positively affect environmental quality. The EPA awards grants each year based on funding appropriated by Congress. Annual funding for the program ranges between $2 and $3 million. Most grants awarded will be in the $15,000 to $25,000 range.
Since the mid-1960s, the Land and Water Conservation Fund (LWCF) program has provided funds for outdoor recreation acquisition and development. Congress is responsible for setting the funding level each year. Should the Commonwealth receive funds from the federal government, this would be another useful source of funding for the City.
The identified capital improvements needed to address the current needs of the parks system for the City of Lynchburg is $111,150,000 (see Table 8.1). Accomplishing this goal will require a balanced approach to acquiring additional funding sources for land acquisition, planning and design, and development. Alternative funding sources will likely be required to execute this program. The City should look for opportunities to use fees, grants, and lodging taxes for additional recreation funds to support future development. Funds from the American Rescue Plan Act could possibly cover the cost associated with years one and two of the Capital Improvement Plan. Additionally, there appears to be public support for dedicated funding of parks improvements. With dedicated leadership and a unified vision, Lynchburg Parks and Recreation can accomplish the physical improvements discussed in this master plan.

THIS PAGE INTENTIONALLY LEFT BLANK
“ACE | Certified Personal Trainer | ACE Personal Trainer.” ACE | Certified Personal Trainer | ACE Personal Trainer, https://www.acefitness.org. Accessed 1 Feb. 2022.
“ACSM | The American College of Sports Medicine.” ACSM_CMS, https://www.acsm.org/. Accessed 1 Feb. 2022. “American Rivers | Rivers Connect Us.” American Rivers, https://www.facebook.com/AmericanRivers, http://www. americanrivers.org. Accessed 1 Feb. 2022.
Bureau, U. C. 2015-2019 ACS 5-year Estimates. Retrieved from https://data.census.gov/ cedsci/ “County Health Rankings & Roadmaps.” County Health Rankings & Roadmaps, http://countyhealthrankings.org. Accessed 1 Feb. 2022.
“GIS Mapping Software, Location Intelligence & Spatial Analytics | Esri.” GIS Mapping Software, Location Intelligence & Spatial Analytics | Esri, http://www.esri.com. Accessed 1 Feb. 2022.
“History | City of Lynchburg, Virginia.” City of Lynchburg, Virginia | A Great Place to Live, Work and Play., https:// www.lynchburgva.gov/history. Accessed 1 Feb. 2022.
“Home - Outdoor Industry Association.” Outdoor Industry Association, http://outdoorindustry.org. Accessed 1 Feb. 2022.
“Home HarrisPoll - The Harris Poll.” The Harris Poll, http://theharrispoll.com. Accessed 1 Feb. 2022.
“Homepage | Taking Charge of Your Health & Wellbeing.” Taking Charge of Your Health & Wellbeing, http:// takingcharge.csh.umn.edu. Accessed 1 Feb. 2022.
“James River Association |.” James River Association |, https://thejamesriver.org. Accessed 1 Feb. 2022.
“Living in Lynchburg.” Walk Score, http://walkscore.com. Accessed 1 Feb. 2022.
“LRN Global – Learning Resource Network.” LRN Global – Learning Resource Network, http://lrnglobal.org. Accessed 1 Feb. 2022.
"LYH – Lynchburg Tourism. (2022, January 25). African American history in Lynchburg." LYH – Lynchburg Tourism. Retrieved March 7, 2022, from https://www.lynchburgvirginia.org/african-american-history-in-lynchburg/
“Lynchburg: The City of Seven Hills- Envision the James River.” Envision the James River, http://www. envisionthejames.org/detail/lynchburg-the-city-of-seven-hills/evj08db315f237673a38/. Accessed 1 Feb. 2022.
LynchburgHistorical. “History of Lynchburg, VA.” Lynchburg Historical Foundation - Preserving Lynchburg’s Past, 16 Dec. 2015, http://lynchburghistoricalfoundation.org/history.
Mertes, James D., and James R. Hall. Park, Recreation, Open Space and Greenway Guidelines. Urban Land Inst, 1996.
“National Center for Biotechnology Information.” National Center for Biotechnology Information, http://ncbi.nlm.nih. gov. Accessed 1 Feb. 2022.
“National Recreation and Park Association.” National Recreation and Park Association, http://www.nrpa.org. Accessed 1 Feb. 2022.
“News and Advance | Breaking News | Breaking News, Sports and Advertising for the Lynchburg, Virginia Region.” NewsAdvance.Com , http://www.facebook.com/newsadvance, http://newsadvance.com. Accessed 1 Feb. 2022.
“Physical Education and Health Education-Shape America.” Physical Education and Health Education-Shape America, http://shapeamerica.org. Accessed 1 Feb. 2022.
“Power 9® - Blue Zones.” Blue Zones - Live Better, Longer, https://www.facebook.com/BlueZones, 10 Nov. 2016, http://www.bluezones.com/2016/11/power-9.
“Psychiatrist.Com: JCP, PCC, and The CME Institute.” Psychiatrist.Com, http://www.psychiatrist.com. Accessed 1 Feb. 2022.
Simpson, K. (2021, March). How the American Rescue Plan Will Help Parks and Recreation. Retrieved February 1, 2022, from https://www.nrpa.org/blog/how-the-american-rescue-plan-will-help-parks-and-recreation/.
“The Aspen Institute.” The Aspen Institute, http://aspeninstitute.org. Accessed 1 Feb. 2022.
“The New York Times - Breaking News, US News, World News and Videos.” The New York Times - Breaking News, US News, World News and Videos, https://www.nytimes.com/. Accessed 1 Feb. 2022.
Tourism, – Lynchburg. “Lynchburg History: The James River Batteau - LYH – Lynchburg Tourism.” LYH – Lynchburg Tourism, 19 June 2020, https://www.lynchburgvirginia.org/lynchburg-history-the-james-river-batteau/.
“USA Pickleball Association | Become a Member Today.” USA Pickleball, USA Pickleball, 10 June 2020, http:// usapickleball.org.
“Virginia Population Projections | Weldon Cooper Center for Public Service.” Demographics | Homepage | Weldon Cooper Center for Public Service, http://demographics.coopercenter.org/virginia-population-projections. Accessed 1 Feb. 2022.
