Upon request, any data point can be supplied with links to view the properties. Lehoa.Gacki@elliman.com
Westside:
LeHoa’s Neighborhood Data Charts
All areas are based on neighborhoods mapped out by the Los Angeles Times Mapping L.A. but with Holmby Hills added.

Douglas Elliman Real Estate

DRE #01422855
www.lehoagacki.com
Lehoa.Gacki@elliman.com 424.276.7587
LNDC
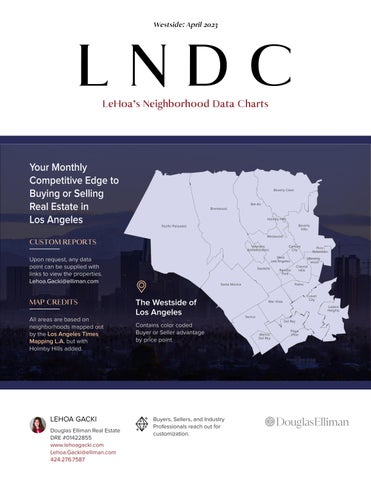
April 2023 The Westside of Los Angeles Contains color coded Buyer or Seller advantage by price point Brentwood Westwood Beverly Hills Beverlywood Beverly Crest Pacific Palisades Sawtelle Santa Monica Mar Vista Del Rey Marina Del Rey Palms Venice Cheviot Hills Culver City Playa Vista Ladera Heights Rancho Park PicoRobertson Century City West Los Angeles Veterans Administration Bel-Air Holmby Hills
REPORTS
CUSTOM
CREDITS Your Monthly Competitive Edge to Buying or Selling Real Estate in Los Angeles Buyers, Sellers, and Industry
out for
GACKI
MAP
Professionals reach
customization. LEHOA
About LNDC
LeHoa’s Neighborhood Data Charts (LNDC) helps any Buyer, Seller, Investor, or Industry Professional navigate Los Angeles Real Estate.

Each area is 6 pages and provides invaluable information for anyone interested in the intricate Los Angeles Real Estate market. LNDC instantly advises what neighboring areas are priced at, what your money buys you the past month, plus 4 year historical fluctuations. LNDC also provides a Buyer or Seller advantage based on price bracket. Including, a bonus “Realtors Digest” separating new construction from resale and showing properties under contract, past 3 months sold transactions, Days on Market (DOM) prior to sale all separated by price bracket.
For questions, comments, a tailor-made report for your home area, or a complimentary home valuation please contact LeHoa Gacki.
Visit www.issuu.com/lehoagacki to view more publications. Other LNDC publications include Westside, San Fernando Valley, Central L.A., Northeast L.A., and Santa Monica Mountains.
Westside
Table of Contents
Bel-Air
Beverly Crest
Beverly Hills
Beverlywood
Brentwood
Century City
Cheviot Hills
Culver City
Del Rey
Ladera Heights
Mar Vista
Pacific Palisades
Palms
Pico-Robertson
Playa Vista
Rancho Park
Santa Monica
Sawtelle
Venice
West Los Angeles
Westwood
About LeHoa
Frequently Asked Questions
Bel-Air
Beverly Crest
Beverly Hills
Beverlywood
Brentwood
Century City
Cheviot Hills
Culver City
Del Rey
Ladera Heights
Mar Vista
Pacific Palisades
Palms
Pico-Robertson
Playa Vista
Rancho Park
Santa Monica
Sawtelle
Venice
West Los Angeles

Westwood
About LeHoa
Frequently Asked Questions
→ → → → → → → → → → → → → → → → → → → → → → →
NEIGHBORING AREAS:
**Overbid/Underbid: 100 is list price paid. Under 100 means sold for less than asking, over 100 sold probably in multiples and over asking.
Note: Square Footage calculation could be more or less (+-) 20% difference. (Based on calculation.)
Source: TheMLS/CLAW (Combined Los Angeles Westside)


LeHoa’s Neighborhood Data Charts Los Angeles Real Estate LNDC APRIL 2023
questions, comments,
tailor-made report for
area,
home valuation
LeHoa Gacki LeHoa Gacki Douglas Elliman Real Estate DRE #01422855 Lehoa.Gacki@elliman.com www.LeHoaGacki.com 424.276.7587 Bel-Air A neighborhood in the City of Los Angeles BEL-AIR Brentwood Encino Westwood Beverly Crest Beverly Hills Sherman Oaks Holmby Hills Single Family Homes April 2023 $3,716,500 TYPICAL HOME PRICE (MEDIAN) $703 SOLD PRICE PER SQUARE FOOT 109 DAYS ON MARKET BEFORE SOLD (DOM) $2,533,000 MID-LOW $4,900,000 MID-HIGH WHAT YOUR MONEY BUYS YOU THIS MONTH CLICK HERE FOR MORE Bel-Air Home Analysis from: April 01, 2023 to April 30, 2023 2 Sold Sold Price **Overbid/ Underbid Square Feet Price per/SqFt YB LotSqFt BD BA Days on Market Actual Lowest Sold $2,533,000 88 4,790 $529 1978 23,465 5 6 179 Typical Home Price (Median)* $3,716,500 94 5,186 $703 989 18,672 5 5 109 Actual Highest Sold $4,900,000 100 5,582 $878 0 13,878 4 4 38 Average $3,716,500 94 5,186 $703 1978 18,672 5 5 109
For
a
your home
or a complimentary
please contact
Area Typical Home Price (Median) Price per/ SqFt Days on Market Mid-Low Mid-High Homes Sold Brentwood $3,377,500 $1,313 18 $2,555,875 $4,912,499 12 Encino $1,881,250 $810 13 $1,297,250 $3,064,000 34 Sherman Oaks $1,620,000 $784 12 $1,310,000 $2,060,000 35 Beverly Crest $1,682,130 $891 9 $1,400,000 $1,863,500 7 Beverly Hills $8,250,000 $1,448 66 $3,331,000 $9,600,000 11 Westwood $3,333,300 $1,080 9 $2,374,000 $3,620,590 7 Holmby Hills - - - 0
Buyer or Seller Advantage by Price Point for Bel-Air as of April 30, 2023
Based on last 3 months of homes sales, Bel-Air has 10.6 months supply of inventory.
Months supply of Inventory =
4-6 = BALANCED MARKET
3 and under FAVORS SELLER
7 and over FAVORS BUYER
ADVANTAGE
BUYER ADVANTAGE $4,500,000 $4,999,999 BUYER ADVANTAGE $4,000,000 $4,499,999 $3,500,000 $3,999,999 SELLER ADVANTAGE $3,000,000 $3,499,999 SELLER ADVANTAGE $2,500,000 $2,999,999 SELLER ADVANTAGE $2,000,000 $2,499,999 $1,500,000 $1,999,999 $1,000,000 $1,499,999 SELLER ADVANTAGE $500,000 $999,999
HOME PRICE RANGE BUYER ADVANTAGE $100,000,000
$80,000,000
BUYER ADVANTAGE $60,000,000
BUYER ADVANTAGE $50,000,000
ADVANTAGE
ADVANTAGE $35,000,000
ADVANTAGE
BUYER
$12,500,000
SELLER ADVANTAGE $10,000,000
$9,000,000
BUYER ADVANTAGE $8,000,000 $8,999,999 BUYER ADVANTAGE $7,000,000 $7,999,999 $6,500,000 $6,999,999 SELLER ADVANTAGE BUYER ADVANTAGE $6,000,000 $6,499,999 $5,500,000 $5,999,999 $5,000,000 $5,499,999 SELLER
$200,000,000
$99,999,999
$79,999,999
$59,999,999 BUYER
$40,000,000 $49,999,999 BUYER
$39,999,999 BUYER
$30,000,000 $34,999,999 BUYER ADVANTAGE $25,000,000 $29,999,999 BUYER ADVANTAGE $20,000,000 $24,999,999
ADVANTAGE $15,000,000 $19,999,999
$14,999,999
$12,499,999
$9,999,999
View homes below Contact for up to date homes for sale
Bel-Air Inventory for New Construction and Resale of Homes as of SELLER
SUPPLY & DEMAND
Source: TheMLS/CLAW (Combined Los Angeles Westside) Under Contract Pending - Closing Soon New Construction New Con DOM Resale Resale DOM Home Price Range Homes Resold 4 2 6 76 61 104 7 $500,000 $999,999 1 1 1 11 $1,000,000 $1,499,999 $1,500,000 $1,999,999 2 103 $2,000,000 $2,499,999 1 1 $2,500,000 $2,999,999 3 2 92 $3,000,000 $3,499,999 2 44 $3,500,000 $3,999,999 1 4 20 $4,000,000 $4,499,999 6 59 $4,500,000 $4,999,999 1 168 $5,000,000 $5,499,999 1 1 4 66 $5,500,000 $5,999,999 3 69 $6,000,000 $6,499,999 1 89 $6,500,000 $6,999,999 2 89 $7,000,000 $7,999,999 3 74 $8,000,000 $8,999,999 2 60 $9,000,000 $9,999,999 1 2 231 $10,000,000 $12,499,999 1 2 171 $12,500,000 $14,999,999 1 2 121 9 84 $15,000,000 $19,999,999 2 348 $20,000,000 $24,999,999 1 11 2 101 $25,000,000 $29,999,999 1 84 $30,000,000 $34,999,999 2 47 5 188 $35,000,000 $39,999,999 2 88 $40,000,000 $49,999,999 2 177 $50,000,000 $59,999,999 1 110 $60,000,000 $79,999,999 $80,000,000 $99,999,999 1 173 $100,000,000 $200,000,000 REALTORS
ADVANTAGE
For Sale
of April 30, 2023
Based on last 3 months of homes sales, Bel-Air has 7.9 months supply of inventory.
BUYER / INVESTOR ADVANTAGE
DEMAND
Sold Homes Days on Market Before Sold = DOM February March April Resold DOM New Cons New DOM Homes Resold Resold DOM New Cons New DOM Homes Resold Resold DOM New Cons New DOM 75 9 72 1 21 2 109 11 82 1 179 2 10 10 1 122 1 38 1 38 186 1 37 1 64 1 42 1 326 69 1 0 1 21 REALTORS
DIGEST
4 YEAR TREND
**Overbid / Underbid: 100 is list price paid. Under 100 means sold for less than asking, over 100 sold probably in multiples and over asking.
Note: Square Footage calculation could be more or less (+-) 20% difference. (Based on calculation.)
* Middle Range Variance $5,150,000 Middle Range Variance is future range Typical Home Price (Median) Price will vary by. Never more, Never less.


For questions, comments, a tailor-made report for your home area, or a complimentary home valuation please contact LeHoa Gacki

$2,181,250 $2,285,000 $3,000,000 $2,750,000 $3,490,000 $3,125,000 $4,400,000 $4,350,000 $6,575,000 $5,411,000 $7,000,000 $7,900,000 $$1,000,000 $2,000,000 $3,000,000 $4,000,000 $5,000,000 $6,000,000 $7,000,000 $8,000,000 $9,000,000 May 01, 2019 to Apr 30, 2020 May 01, 2020 to Apr 30, 2021 May 01, 2021 to Apr 30, 2022 May 01, 2022 to Apr 30, 2023 Mid-Low Typical Home Price-Median Mid-High
LeHoa Gacki, DRE #01422855 Douglas Elliman Real Estate 11990 San Vicente Blvd., #100, L.A., Ca 90049 Email: Lehoa.Gacki@elliman.com Tel | Fax: (424) 276-7587 www.Lehoagacki.com | Lehoagacki.elliman.com 4 YEAR OBSERVATION Bel-Air Number of Homes Sold: 120 129 135 91 May 01, 2019 to Apr 30, 2020 May 01, 2020 to Apr 30, 2021 May 01, 2021 to Apr 30, 2022 May 01, 2022 to Apr 30, 2023 Actual Lowest Sold $655,000 $750,000 $1,005,000 $552,000 Mid-Low $2,181,250 $2,285,000 $3,000,000 $2,750,000 Typical Home Price-Median $3,490,000 $3,125,000 $4,400,000 $4,350,000 Mid-High $6,575,000 $5,411,000 $7,000,000 $7,900,000 Actual Highest Sold $150,000,000 $36,000,000 $141,000,000 $52,000,000 Average Price Sold $8,389,918 $5,178,229 $7,191,138 $7,739,703 12 MONTH OBSERVATION Bel-Air Cumulative 12 months sold home analysis from: May 01, 2022 to April 30, 2023 91 Sold Sold Price **Overbid / Underbid Square Feet Price per/SqFt YB LotSqFt BD BA Days on Market Actual Lowest Sold $552,000 79 1,087 $508 1937 8,549 2 1 9 Mid-Low* $2,750,000 89 2,789 $817 1949 12,749 3 3 14 Typical Home Price-Median* $4,350,000 95 4,092 $1,062 1961 21,169 4 5 37 Mid-High* $7,900,000 100 6,500 $1,355 1971 36,096 6 7 105 Actual Highest Sold $52,000,000 80 19,721 $2,637 1936 52,052 10 17 130 Average $7,739,703 95 5,191 $1,220 1964 26,596 5 5 69
Source: TheMLS/CLAW
Los Angeles Westside) © 2022 LEHOA GACKI. DRE# 01422855. ALL WORLDWIDE RIGHTS RESERVED. DOUGLAS ELLIMAN REAL ESTATE. 150 EL CAMINO DRIVE, BEVERLY HILLS, CA 90212. 310.595.3888. ALL MATERIAL PRESENTED HEREIN IS INTENDED FOR INFORMATION PURPOSES ONLY AND NOT INTENDED TO CONSTITUTE PROFESSIONAL ADVICE OR WARRANTY OUTSIDE THE REALM OF REAL ESTATE BROKERAGE. MAPS CREATED FOR REFERENCE PURPOSE ONLY. WHILE THIS INFORMATION IS BELIEVED TO BE CORRECT, IT IS REPRESENTED SUBJECT TO ERRORS, OMISSIONS, CHANGES OR WITHDRAWAL WITHOUT NOTICE. BASED ON DATA SOURCED FROM THE COMBINED LOS ANGELES WESTSIDE MULTIPLE LISTING SERVICE AND PUBLIC RECORDS. STATISTICS ARE SUBJECT TO CHANGE DUE TO INDIVIDUAL REAL ESTATE COMPANY REPORTING DISCIPLINES. BUYER ADVANTAGE OR SELLER ADVANTAGE IS STRICTLY OF THE OPINION OF LEHOA GACKI AND ACCURACY CANNOT BE GUARANTEED AND MAY NOT REFLECT ALL REAL ESTATE ACTIVITY ON THE MARKET. ALL PROPERTY INFORMATION, INCLUDING, BUT NOT LIMITED TO MAPS, GRAPHS, DEPICTIONS, SQUARE FOOTAGE, ROOM COUNT, NUMBER OF BEDROOMS AND THE SCHOOL DISTRICT IN PROPERTY LISTINGS SHOULD BE VERIFIED BY YOUR OWN ATTORNEY, ARCHITECT OR ZONING EXPERT. NEW CONSTRUCTION COUNT, SQUARE FOOTAGE AND YEAR BUILT IS BASED ON INDIVIDUAL REAL ESTATE COMPANY REPORTING AND MAY BE DIFFERENT THAN PUBLIC RECORDS. NEW CONSTRUCTION COUNT IS BASED ON LISTING BROKERAGE LISTING YEAR. THE BROKER/AGENT PROVIDING THE INFORMATION CONTAINED HEREIN MAY OR MAY HAVE NOT BEEN THE LISTING AND/OR SELLING AGENT. THIS IS NOT INTENDED TO SOLICIT PROPERTY ALREADY LISTED. EQUAL HOUSING OPPORTUNITY. NEIGHBORHOOD BOUNDARY SOURCE: PUBLIC RECORDS, COMBINED LOS ANGELES WESTSIDE MULTIPLE LISTING SERVICE AND LOS ANGELES TIMES MAPPING L.A. https://maps.latimes.com/neighborhoods/index.html BEL-AIR
(Combined
$827 $839 $808 $961 $946 $1,091 $1,202 $1,062 $969 $1,042 $988 $1,037 $1,053 $1,120 $1,396 $1,204 $$200 $400 $600 $800 $1,000 $1,200 $1,400 $1,600 Jan 01 to Jun 30, 2019 Jul 01 to Dec 31, 2019 Jan 01 to Jun 30, 2020 Jul 01 to Dec 31, 2020 Jan 01 to Jun 30, 2021 Jul 01 to Dec 31, 2021 Jan 01 to Jun 30, 2022 Jul 01 to Dec 31, 2022 Median Price Per Square Foot Average Price per SquareFt 51 53 57 29 65 26 35 3610 20 30 40 50 60 70 Jan 01 to Jun 30, 2019 Jul 01 to Dec 31, 2019 Jan 01 to Jun 30, 2020 Jul 01 to Dec 31, 2020 Jan 01 to Jun 30, 2021 Jul 01 to Dec 31, 2021 Jan 01 to Jun 30, 2022 Jul 01 to Dec 31, 2022 Number of Homes Sold 54 67 34 77 68 72 55 49 Days on Market before Sold 8.6 8.0 9.9 12.0 8.5 10.6 0.0 2.0 4.0 6.0 8.0 10.0 12.0 14.0 Nov 30, 2022 Dec 31, 2022 Jan 31, 2023 Feb 28, 2023 Mar 31, 2023 Apr 30, 2023 Number of months it would take to sell all properties Active for sale if no new listings entered the market. END OF BEL-AIR 6 PAGE REPORT
PRICE PER SQUARE FOOT - PRE & POST MAR 2020 PANDEMIC DAYS ON MARKET BEFORE SOLD- PRE & POST MAR 2020 PANDEMIC MONTHS SUPPLY OF INVENTORY - BASED ON LAST FEW MONTHS OF HOME SALES 3 and Under Favors Seller 4-6 = Balanced Market 7 and over Favors Buyer BEL-AIR BEL-AIR BEL-AIR
SOLD HOME
NEIGHBORING AREAS:
**Overbid/Underbid: 100 is list price paid. Under 100 means sold for less than asking, over 100 sold probably in multiples and over asking. Note: Square Footage calculation could be more or less (+-) 20% difference. (Based on calculation.) *
Single Family Homes April 2023 $1,682,130 TYPICAL HOME PRICE (MEDIAN) $891 SOLD PRICE PER SQUARE FOOT 9 DAYS ON MARKET BEFORE SOLD (DOM)
MID-LOW
MID-HIGH For questions, comments, a tailor-made report for your home area, or a complimentary home valuation please contact LeHoa Gacki LeHoa Gacki Douglas Elliman Real Estate DRE #01422855 Lehoa.Gacki@elliman.com www.LeHoaGacki.com 424.276.7587 LeHoa’s Neighborhood Data Charts Los Angeles Real Estate LNDC APRIL 2023 Beverly Crest A neighborhood in the City of Los Angeles BEVERLY CREST Bel Air Westwood Beverly Hills Sherman Oaks Studio City Hollywood Hills West Holmby Hills WHAT YOUR MONEY BUYS YOU THIS MONTH CLICK HERE FOR MORE Beverly Crest Home Analysis from: April 01, 2023 to April 30, 2023 7 Sold Sold Price **Overbid/ Underbid Square Feet Price per/SqFt YB LotSqFt BD BA Days on Market Actual Lowest Sold $1,220,000 106 1,176 $1,037 1950 5,303 2 1 9 Mid-Low* $1,400,000 98 1,176 $602 1950 5,303 2 2 0 Typical Home Price (Median)* $1,682,130 101 2,092 $891 1962 20,054 4 3 9 Mid-High* $1,863,500 108 2,967 $1,162 1971 847,105 4 3 11 Actual Highest Sold $2,565,000 95 2,967 $865 1978 139,044 4 4 1 Average $1,720,661 103 2,046 $980 1958 304,827 3 3 8
$1,400,000
$1,863,500
$463,500 Middle
Typical Home Price (Median)
will
Never more, Never less. Source: TheMLS/CLAW (Combined Los Angeles Westside)
Middle Range Variance
Range Variance is future range
Price
vary by.
Area Typical Home Price (Median) Price per/ SqFt Days on Market Mid-Low Mid-High Homes Sold Bel-Air $3,716,500 $703 109 $2,533,000 $4,900,000 2 Sherman Oaks $1,620,000 $784 12 $1,310,000 $2,060,000 35 Studio City $1,870,000 $931 10 $1,491,250 $2,836,505 20 Hollywood Hills West $2,465,000 $1,157 11 $2,000,000 $3,150,000 15 Beverly Hills $8,250,000 $1,448 66 $3,331,000 $9,600,000 11 Westwood $3,333,300 $1,080 9 $2,374,000 $3,620,590 7 Holmby Hills - - - 0
Buyer or Seller Advantage by Price Point for Beverly Crest as of April 30, 2023
Months supply of Inventory =
4-6 = BALANCED MARKET
Based on last 3 months of homes sales, Beverly Crest has 7.1 months supply of inventory.
3 and under FAVORS SELLER
7 and over FAVORS BUYER
SELLER ADVANTAGE
BUYER ADVANTAGE $4,500,000 $4,999,999 $4,000,000 $4,499,999 SELLER ADVANTAGE $3,500,000 $3,999,999 SELLER ADVANTAGE $3,000,000 $3,499,999
$2,999,999
$2,499,999 $1,500,000 $1,999,999 SELLER ADVANTAGE $1,000,000 $1,499,999 SELLER ADVANTAGE $500,000 $999,999
HOME PRICE RANGE $100,000,000 $200,000,000 BUYER ADVANTAGE $80,000,000 $99,999,999 BUYER ADVANTAGE $60,000,000 $79,999,999 $50,000,000 $59,999,999 SELLER ADVANTAGE $40,000,000 $49,999,999 SELLER ADVANTAGE BUYER ADVANTAGE $35,000,000 $39,999,999 BUYER ADVANTAGE $30,000,000 $34,999,999 BUYER ADVANTAGE $25,000,000 $29,999,999 BUYER ADVANTAGE $20,000,000 $24,999,999 BUYER ADVANTAGE $15,000,000 $19,999,999 $12,500,000 $14,999,999 SELLER ADVANTAGE BUYER ADVANTAGE $10,000,000 $12,499,999 $9,000,000 $9,999,999 SELLER ADVANTAGE BUYER ADVANTAGE $8,000,000 $8,999,999 BUYER ADVANTAGE $7,000,000 $7,999,999 $6,500,000 $6,999,999 BUYER ADVANTAGE $6,000,000 $6,499,999 $5,500,000 $5,999,999 $5,000,000 $5,499,999
$2,500,000
$2,000,000
View homes below Contact for up to date homes for sale
Beverly Crest Inventory for New Construction and Resale of Homes
SELLER
DEMAND
TheMLS/CLAW
Westside) Under Contract Pending - Closing Soon New Construction New Con DOM Resale Resale DOM Home Price Range Homes Resold 8 4 6 216 84 102 8 $500,000 $999,999 3 2 42 $1,000,000 $1,499,999 1 6 51 $1,500,000 $1,999,999 1 1 5 105 $2,000,000 $2,499,999 2 1 10 32 $2,500,000 $2,999,999 1 4 92 $3,000,000 $3,499,999 1 1 4 69 $3,500,000 $3,999,999 1 1 2 62 $4,000,000 $4,499,999 1 6 116 $4,500,000 $4,999,999 1 1 98 $5,000,000 $5,499,999 3 95 $5,500,000 $5,999,999 1 6 94 $6,000,000 $6,499,999 $6,500,000 $6,999,999 1 275 2 162 $7,000,000 $7,999,999 3 152 $8,000,000 $8,999,999 1 81 1 17 $9,000,000 $9,999,999 1 5 83 $10,000,000 $12,499,999 1 318 1 77 $12,500,000 $14,999,999 2 274 5 128 $15,000,000 $19,999,999 8 131 $20,000,000 $24,999,999 3 201 $25,000,000 $29,999,999 1 319 $30,000,000 $34,999,999 1 74 1 104 $35,000,000 $39,999,999 1 89 $40,000,000 $49,999,999 1 19 $50,000,000 $59,999,999 2 2 173 $60,000,000 $79,999,999 1 466 $80,000,000 $99,999,999 $100,000,000 $200,000,000 REALTORS
ADVANTAGE SUPPLY &
For Sale Source:
(Combined Los Angeles
Homes as of April 30, 2023
DIGEST
Based on last 3 months of homes sales, Bel-Air has 7.9 months supply of inventory.
BUYER / INVESTOR ADVANTAGE
DEMAND
Sold Homes Days on Market Before Sold = DOM February March April Resold DOM New Cons New DOM Homes Resold Resold DOM New Cons New DOM Homes Resold Resold DOM New Cons New DOM 77 21 62 2 137 7 8 2 45 3 10 119 1 211 3 10 2 1 18 42 3 4 1 1 116 1 29 10 2 11 1 77 1 0 2 73 1 29 1 14 1 30 1 35 3 116 1 243 1 278 163 REALTORS
4 YEAR TREND
Mid-Low Typical Home Price-Median Mid-High
**Overbid / Underbid: 100 is list price paid. Under 100 means sold for less than asking, over 100 sold probably in multiples and over asking.
Note: Square Footage calculation could be more or less (+-) 20% difference. (Based on calculation.)
* Middle Range Variance $3,570,000 Middle Range Variance is future range Typical Home Price (Median) Price will vary by. Never more, Never less.
TheMLS/CLAW (Combined Los Angeles Westside)
For questions, comments, a tailor-made report for your home area, or a complimentary home valuation please contact LeHoa Gacki

$1,489,675 $1,582,500 $2,000,000 $2,030,000 $2,257,500 $2,185,000 $2,995,000 $2,975,000 $3,460,000 $3,650,000 $4,496,250 $5,600,000 $$1,000,000 $2,000,000 $3,000,000 $4,000,000 $5,000,000 $6,000,000 May 01, 2019 to Apr 30, 2020 May 01, 2020 to Apr 30, 2021 May 01, 2021 to Apr 30, 2022 May 01, 2022 to Apr 30, 2023
LeHoa Gacki, DRE #01422855 Douglas Elliman Real Estate 11990 San Vicente Blvd., #100, L.A., Ca 90049 Email: Lehoa.Gacki@elliman.com Tel | Fax: (424) 276-7587 www.Lehoagacki.com | Lehoagacki.elliman.com 4 YEAR OBSERVATION Beverly Crest Number of Homes Sold: 188 237 246 163 May 01, 2019 to Apr 30, 2020 May 01, 2020 to Apr 30, 2021 May 01, 2021 to Apr 30, 2022 May 01, 2022 to Apr 30, 2023 Actual Lowest Sold $681,000 $500,000 $500,000 $708,700 Mid-Low $1,489,675 $1,582,500 $2,000,000 $2,030,000 Typical Home Price-Median $2,257,500 $2,185,000 $2,995,000 $2,975,000 Mid-High $3,460,000 $3,650,000 $4,496,250 $5,600,000 Actual Highest Sold $42,750,000 $51,000,000 $64,900,000 $55,000,000 Average Price Sold $3,399,149 $3,982,570 $4,754,238 $5,578,188 12 MONTH OBSERVATION Beverly Crest Cumulative 12 months sold home analysis from: May 01, 2022 to April 30, 2023 163 Sold Sold Price **Overbid / Underbid Square Feet Price per/SqFt YB LotSqFt BD BA Days on Market Actual Lowest Sold $708,700 98 1,266 $560 1918 8,167 2 2 82 Mid-Low* $2,030,000 92 2,298 $800 1952 8,978 3 3 10 Typical Home Price-Median* $2,975,000 96 2,933 $979 1961 14,607 4 4 30 Mid-High* $5,600,000 100 4,775 $1,271 1978 34,872 5 6 72 Actual Highest Sold $55,000,000 69 30,500 $1,803 2014 267,335 12 20 50 Average $5,578,188 96 4,079 $1,162 1967 68,061 4 5 53
Source:
© 2022 LEHOA GACKI. DRE# 01422855. ALL WORLDWIDE RIGHTS RESERVED. DOUGLAS ELLIMAN REAL ESTATE. 150 EL CAMINO DRIVE, BEVERLY HILLS, CA 90212. 310.595.3888. ALL MATERIAL PRESENTED HEREIN IS INTENDED FOR INFORMATION PURPOSES ONLY AND NOT INTENDED TO CONSTITUTE PROFESSIONAL ADVICE OR WARRANTY OUTSIDE THE REALM OF REAL ESTATE BROKERAGE. MAPS CREATED FOR REFERENCE PURPOSE ONLY. WHILE THIS INFORMATION IS BELIEVED TO BE CORRECT, IT IS REPRESENTED SUBJECT TO ERRORS, OMISSIONS, CHANGES OR WITHDRAWAL WITHOUT NOTICE. BASED ON DATA SOURCED FROM THE COMBINED LOS ANGELES WESTSIDE MULTIPLE LISTING SERVICE AND PUBLIC RECORDS. STATISTICS ARE SUBJECT TO CHANGE DUE TO INDIVIDUAL REAL ESTATE COMPANY REPORTING DISCIPLINES. BUYER ADVANTAGE OR SELLER ADVANTAGE IS STRICTLY OF THE OPINION OF LEHOA GACKI AND ACCURACY CANNOT BE GUARANTEED AND MAY NOT REFLECT ALL REAL ESTATE ACTIVITY ON THE MARKET. ALL PROPERTY INFORMATION, INCLUDING, BUT NOT LIMITED TO MAPS, GRAPHS, DEPICTIONS, SQUARE FOOTAGE, ROOM COUNT, NUMBER OF BEDROOMS AND THE SCHOOL DISTRICT IN PROPERTY LISTINGS SHOULD BE VERIFIED BY YOUR OWN ATTORNEY, ARCHITECT OR ZONING EXPERT. NEW CONSTRUCTION COUNT, SQUARE FOOTAGE AND YEAR BUILT IS BASED ON INDIVIDUAL REAL ESTATE COMPANY REPORTING AND MAY BE DIFFERENT THAN PUBLIC RECORDS. NEW CONSTRUCTION COUNT IS BASED ON LISTING BROKERAGE LISTING YEAR. THE BROKER/AGENT PROVIDING THE INFORMATION CONTAINED HEREIN MAY OR MAY HAVE NOT BEEN THE LISTING AND/OR SELLING AGENT. THIS IS NOT INTENDED TO SOLICIT PROPERTY ALREADY LISTED. EQUAL HOUSING OPPORTUNITY. NEIGHBORHOOD BOUNDARY SOURCE: PUBLIC RECORDS, COMBINED LOS ANGELES WESTSIDE MULTIPLE LISTING SERVICE AND LOS ANGELES TIMES MAPPING L.A. https://maps.latimes.com/neighborhoods/index.html BEVERLY CREST
6.5 6.0 8.0 8.2 5.6 7.1 0.0 1.0 2.0 3.0 4.0 5.0 6.0 7.0 8.0 9.0 Nov 30, 2022 Dec 31, 2022 Jan 31, 2023 Feb 28, 2023 Mar 31, 2023 Apr 30, 2023 Number of months it would take to sell all properties Active for sale if no new listings entered the market. 53 62 48 40 34 24 29 3510 20 30 40 50 60 70 Jan 01 to Jun 30, 2019 Jul 01 to Dec 31, 2019 Jan 01 to Jun 30, 2020 Jul 01 to Dec 31, 2020 Jan 01 to Jun 30, 2021 Jul 01 to Dec 31, 2021 Jan 01 to Jun 30, 2022 Jul 01 to Dec 31, 2022 Number of Homes Sold 82 101 68 128 148 119 115 71 Days on Market before Sold $814 $788 $823 $772 $909 $973 $1,046 $968 $843 $815 $903 $873 $979 $1,806 $1,153 $1,078 $$200 $400 $600 $800 $1,000 $1,200 $1,400 $1,600 $1,800 $2,000 Jan 01 to Jun 30, 2019 Jul 01 to Dec 31, 2019 Jan 01 to Jun 30, 2020 Jul 01 to Dec 31, 2020 Jan 01 to Jun 30, 2021 Jul 01 to Dec 31, 2021 Jan 01 to Jun 30, 2022 Jul 01 to Dec 31, 2022 Median Price Per Square Foot Average Price per SquareFt END OF BEVERLY CREST 6 PAGE REPORT
MARKET BEFORE SOLD- PRE & POST
PANDEMIC
SUPPLY OF INVENTORY - BASED
3 and Under Favors Seller 4-6 = Balanced Market 7 and over Favors Buyer BEVERLY CREST BEVERLY CREST BEVERLY CREST
SOLD HOME PRICE PER SQUARE FOOT - PRE & POST MAR 2020 PANDEMIC DAYS ON
MAR 2020
MONTHS
ON LAST FEW MONTHS OF HOME SALES
**Overbid/Underbid: 100 is list price paid. Under 100 means sold for less than asking, over 100 sold probably in multiples and over asking.
Note: Square Footage calculation could be more or less (+-) 20% difference. (Based on calculation.)
MORE
Single Family Homes April 2023 $8,250,000 TYPICAL HOME PRICE (MEDIAN) $1,448 SOLD PRICE PER SQUARE FOOT 66 DAYS ON MARKET BEFORE SOLD (DOM) $3,331,000 ACTUAL LOWEST SOLD $9,600,000 ACTUAL HIGHEST SOLD Beverly Crest Hollywood Hills West West Hollywood Pico-Robertson Beverly Grove WestWood Century City BEVERLY HILLS Carthay For questions, comments, a tailor-made report for your home area, or a complimentary home valuation please contact LeHoa Gacki LeHoa Gacki Douglas Elliman Real Estate DRE #01422855 Lehoa.Gacki@elliman.com www.LeHoaGacki.com 424.276.7587 LeHoa’s Neighborhood Data Charts Los Angeles Real Estate LNDC APRIL 2023 Beverly Hills A City in Los Angeles County Bel-Air Holmby Hills
AREAS: Area Typical Home Price (Median) Price per/ SqFt Days on Market Mid-Low Mid-High Homes Sold Westwood $3,333,300 $1,080 9 $2,374,000 $3,620,590 7 Bel-Air $3,716,500 $703 109 $2,533,000 $4,900,000 2 Beverly Crest $1,682,130 $891 9 $1,400,000 $1,863,500 7 Hollywood Hills West $2,465,000 $1,157 11 $2,000,000 $3,150,000 15 West Hollywood $2,000,000 $1,195 15 $1,725,000 $2,312,500 5 Beverly Grove $2,025,000 $1,096 15 $1,887,500 $2,932,625 10 Carthay - - - - - 0 Pico-Robertson $1,425,000 $860 9 $1,370,250 $1,931,250 4 WHAT YOUR MONEY BUYS YOU THIS MONTH CLICK HERE FOR
Beverly Hills Home Analysis from: April 01, 2023 to April 30, 2023 11 Sold Sold Price **Overbid/ Underbid Square Feet Price per/SqFt YB LotSqFt BD BA Days on Market Actual Lowest Sold $1,710,000 96 1,220 $1,402 1926 4,796 2 1 66 Mid-Low* $3,331,000 90 2,300 $1,205 1926 6,503 4 3 7 Typical Home Price (Median)* $8,250,000 95 4,568 $1,448 1928 13,430 4 5 66 Mid-High* $9,600,000 100 6,470 $1,775 1956 20,139 5 6 119 Actual Highest Sold $15,930,000 91 7,593 $2,098 1935 19,019 5 6 0 Average $7,243,182 94 4,449 $1,537 1944 13,200 4 5 67
NEIGHBORING
Middle Range Variance $6,269,000 Middle Range Variance is
range Typical Home Price (Median)
will
Never more, Never less. Source: TheMLS/CLAW (Combined Los Angeles Westside)
*
future
Price
vary by.
Buyer or Seller Advantage by Price Point for Beverly Hills as of April 30, 2023
$6,999,999
$6,499,999
$5,499,999 SELLER ADVANTAGE
$4,999,999
$4,499,999 SELLER ADVANTAGE
$3,999,999 SELLER ADVANTAGE
$2,499,999
$1,499,999
$999,999
4-6 = BALANCED MARKET 3 and under FAVORS SELLER 7 and over FAVORS BUYER Months supply of Inventory = View homes below Contact for up to date homes for sale HOME PRICE RANGE $100,000,000 $200,000,000 BUYER ADVANTAGE $80,000,000 $99,999,999 BUYER ADVANTAGE $60,000,000 $79,999,999 $50,000,000 $59,999,999 BUYER ADVANTAGE $40,000,000
BUYER ADVANTAGE $35,000,000
BUYER ADVANTAGE $30,000,000
BUYER ADVANTAGE $25,000,000
BUYER ADVANTAGE $20,000,000
BUYER ADVANTAGE $15,000,000 $19,999,999 BUYER ADVANTAGE $12,500,000 $14,999,999 $10,000,000 $12,499,999 $9,000,000 $9,999,999 SELLER ADVANTAGE $8,000,000 $8,999,999 $7,000,000 $7,999,999 SELLER ADVANTAGE BUYER ADVANTAGE $6,500,000
$6,000,000
$5,500,000
$5,000,000
$2,000,000
$1,500,000
$1,000,000
$500,000
$49,999,999
$39,999,999
$34,999,999
$29,999,999
$24,999,999
BUYER ADVANTAGE
$5,999,999 SELLER ADVANTAGE
$4,500,000
$4,000,000
$3,500,000
$3,000,000 $3,499,999 SELLER ADVANTAGE $2,500,000 $2,999,999
$1,999,999 SELLER ADVANTAGE
Based on last 3 months of homes sales, Beverly Hills has 7.4 months supply of inventory.
Beverly Hills Inventory for New Construction and Resale of Homes
For Sale
& DEMAND
SELLER ADVANTAGE SUPPLY
Under Contract Pending - Closing Soon New Construction New Con DOM Resale Resale DOM Home Price Range Homes Resold 5 6 4 159 65 100 2 $500,000 $999,999 $1,000,000 $1,499,999 1 $1,500,000 $1,999,999 4 93 $2,000,000 $2,499,999 1 3 54 $2,500,000 $2,999,999 2 1 18 $3,000,000 $3,499,999 1 $3,500,000 $3,999,999 2 35 $4,000,000 $4,499,999 $4,500,000 $4,999,999 1 7 $5,000,000 $5,499,999 1 2 88 $5,500,000 $5,999,999 1 3 78 $6,000,000 $6,499,999 1 35 $6,500,000 $6,999,999 1 $7,000,000 $7,999,999 1 7 130 $8,000,000 $8,999,999 2 112 $9,000,000 $9,999,999 1 1 4 64 $10,000,000 $12,499,999 1 3 199 $12,500,000 $14,999,999 1 200 13 65 $15,000,000 $19,999,999 1 56 8 118 $20,000,000 $24,999,999 1 2 191 4 106 $25,000,000 $29,999,999 2 117 $30,000,000 $34,999,999 1 91 $35,000,000 $39,999,999 1 87 $40,000,000 $49,999,999 $50,000,000 $59,999,999 2 113 $60,000,000 $79,999,999 1 573 $80,000,000 $99,999,999 $100,000,000 $200,000,000 REALTORS
Source:
TheMLS/CLAW (Combined Los Angeles Westside)
Homes as of April 30, 2023
Based on last 3 months of homes sales, Bel-Air has 7.9 months supply of inventory.
BUYER / INVESTOR ADVANTAGE
DEMAND
Sold Homes Days on Market Before Sold = DOM February March April Resold DOM New Cons New DOM Homes Resold Resold DOM New Cons New DOM Homes Resold Resold DOM New Cons New DOM 13 15 55 11 67 1 66 1 180 1 10 1 21 1 58 1 69 1 27 2 75 1 7 1 119 25 3 49 1 209 0 1 7 3 76 1 119 3 1 1 0 2 70
REALTORS DIGEST
4 YEAR TREND
**Overbid / Underbid: 100 is list price paid. Under 100 means sold for less than asking, over 100 sold probably in multiples and over asking.
Note: Square Footage calculation could be more or less (+-) 20% difference. (Based on calculation.)
* Middle Range Variance $7,144,500 Middle Range Variance is future range Typical Home Price (Median) Price will vary by. Never more, Never less.
TheMLS/CLAW (Combined Los Angeles Westside)
For questions, comments, a tailor-made report for your home area, or a complimentary home valuation please contact LeHoa Gacki
$3,037,500 $3,450,000 $3,587,276 $3,315,500 $6,000,000 $7,000,000 $7,495,000 $7,000,000 $9,886,750 $10,775,000 $12,450,000 $10,460,000 $$2,000,000 $4,000,000 $6,000,000 $8,000,000 $10,000,000 $12,000,000 $14,000,000 May 01, 2019 to Apr 30, 2020 May 01, 2020 to Apr 30, 2021 May 01, 2021 to Apr 30, 2022 May 01, 2022 to Apr 30, 2023
Mid-Low Typical Home Price-Median Mid-High
LeHoa Gacki, DRE #01422855 Douglas Elliman Real Estate 11990 San Vicente Blvd., #100, L.A., Ca 90049 Email: Lehoa.Gacki@elliman.com Tel | Fax: (424) 276-7587 www.Lehoagacki.com | Lehoagacki.elliman.com 4 YEAR OBSERVATION Beverly Hills Number of Homes Sold: 145 139 205 133 May 01, 2019 to Apr 30, 2020 May 01, 2020 to Apr 30, 2021 May 01, 2021 to Apr 30, 2022 May 01, 2022 to Apr 30, 2023 Actual Lowest Sold $1,650,000 $1,020,000 $1,400,000 $1,710,000 Mid-Low $3,037,500 $3,450,000 $3,587,276 $3,315,500 Typical Home Price-Median $6,000,000 $7,000,000 $7,495,000 $7,000,000 Mid-High $9,886,750 $10,775,000 $12,450,000 $10,460,000 Actual Highest Sold $45,000,000 $68,000,000 $63,100,000 $51,000,000 Average Price Sold $7,748,670 $8,824,854 $9,194,490 $9,031,572 12 MONTH OBSERVATION Beverly Hills Cumulative 12 months sold home analysis from: May 01, 2022 to April 30, 2023 133 Sold Sold Price **Overbid / Underbid Square Feet Price per/SqFt YB LotSqFt BD BA Days on Market Actual Lowest Sold $1,710,000 96 1,220 $1,402 1926 4,796 2 1 66 Mid-Low* $3,315,500 91 2,328 $1,245 1926 6,502 3 3 12 Typical Home Price-Median* $7,000,000 96 3,889 $1,518 1932 12,462 4 5 28 Mid-High* $10,460,000 100 6,006 $1,880 1965 21,259 5 7 80 Actual Highest Sold $51,000,000 86 - $0 1963 125,580 7 10 270 Average $9,031,572 96 4,710 $1,688 1950 16,110 5 5 61
Source:
© 2022 LEHOA GACKI. DRE# 01422855. ALL WORLDWIDE RIGHTS RESERVED. DOUGLAS ELLIMAN REAL ESTATE. 150 EL CAMINO DRIVE, BEVERLY HILLS, CA 90212. 310.595.3888. ALL MATERIAL PRESENTED HEREIN IS INTENDED FOR INFORMATION PURPOSES ONLY AND NOT INTENDED TO CONSTITUTE PROFESSIONAL ADVICE OR WARRANTY OUTSIDE THE REALM OF REAL ESTATE BROKERAGE. MAPS CREATED FOR REFERENCE PURPOSE ONLY. WHILE THIS INFORMATION IS BELIEVED TO BE CORRECT, IT IS REPRESENTED SUBJECT TO ERRORS, OMISSIONS, CHANGES OR WITHDRAWAL WITHOUT NOTICE. BASED ON DATA SOURCED FROM THE COMBINED LOS ANGELES WESTSIDE MULTIPLE LISTING SERVICE AND PUBLIC RECORDS. STATISTICS ARE SUBJECT TO CHANGE DUE TO INDIVIDUAL REAL ESTATE COMPANY REPORTING DISCIPLINES. BUYER ADVANTAGE OR SELLER ADVANTAGE IS STRICTLY OF THE OPINION OF LEHOA GACKI AND ACCURACY CANNOT BE GUARANTEED AND MAY NOT REFLECT ALL REAL ESTATE ACTIVITY ON THE MARKET. ALL PROPERTY INFORMATION, INCLUDING, BUT NOT LIMITED TO MAPS, GRAPHS, DEPICTIONS, SQUARE FOOTAGE, ROOM COUNT, NUMBER OF BEDROOMS AND THE SCHOOL DISTRICT IN PROPERTY LISTINGS SHOULD BE VERIFIED BY YOUR OWN ATTORNEY, ARCHITECT OR ZONING EXPERT. NEW CONSTRUCTION COUNT, SQUARE FOOTAGE AND YEAR BUILT IS BASED ON INDIVIDUAL REAL ESTATE COMPANY REPORTING AND MAY BE DIFFERENT THAN PUBLIC RECORDS. NEW CONSTRUCTION COUNT IS BASED ON LISTING BROKERAGE LISTING YEAR. THE BROKER/AGENT PROVIDING THE INFORMATION CONTAINED HEREIN MAY OR MAY HAVE NOT BEEN THE LISTING AND/OR SELLING AGENT. THIS IS NOT INTENDED TO SOLICIT PROPERTY ALREADY LISTED. EQUAL HOUSING OPPORTUNITY. NEIGHBORHOOD BOUNDARY SOURCE: PUBLIC RECORDS, COMBINED LOS ANGELES WESTSIDE MULTIPLE LISTING SERVICE AND LOS ANGELES TIMES MAPPING L.A. https://maps.latimes.com/neighborhoods/index.html
BEVERLY HILLS
$1,321 $1,313 $1,275 $1,452 $1,385 $1,516 $1,668 $1,412 $1,478 $1,469 $1,495 $1,504 $1,551 $1,829 $1,831 $1,631 $$200 $400 $600 $800 $1,000 $1,200 $1,400 $1,600 $1,800 $2,000 Jan 01 to Jun 30, 2019 Jul 01 to Dec 31, 2019 Jan 01 to Jun 30, 2020 Jul 01 to Dec 31, 2020 Jan 01 to Jun 30, 2021 Jul 01 to Dec 31, 2021 Jan 01 to Jun 30, 2022 Jul 01 to Dec 31, 2022 Median Price Per Square Foot Average Price per SquareFt 54 66 57 38 48 32 21 4310 20 30 40 50 60 70 Jan 01 to Jun 30, 2019 Jul 01 to Dec 31, 2019 Jan 01 to Jun 30, 2020 Jul 01 to Dec 31, 2020 Jan 01 to Jun 30, 2021 Jul 01 to Dec 31, 2021 Jan 01 to Jun 30, 2022 Jul 01 to Dec 31, 2022 Number of Homes Sold 63 71 63 59 108 111 79 68 Days on Market before Sold 6.2 4.5 6.1 10.2 7.9 7.4 0.0 2.0 4.0 6.0 8.0 10.0 12.0 Nov 30, 2022 Dec 31, 2022 Jan 31, 2023 Feb 28, 2023 Mar 31, 2023 Apr 30, 2023 Number of months it would take to sell all properties Active for sale if no new listings entered the market. END OF BEVERLY HILLS 6 PAGE REPORT SOLD HOME PRICE PER SQUARE FOOT - PRE & POST MAR 2020 PANDEMIC DAYS ON MARKET BEFORE SOLD- PRE & POST MAR 2020 PANDEMIC MONTHS SUPPLY OF INVENTORY - BASED ON LAST FEW MONTHS OF HOME SALES 3 and Under Favors Seller 4-6 = Balanced Market 7 and over Favors Buyer BEVERLY HILLS BEVERLY HILLS BEVERLY HILLS
NEIGHBORING AREAS:
**Overbid/Underbid: 100 is list price paid. Under 100 means sold for less than asking, over 100 sold probably in multiples and over asking. Note: Square Footage calculation could be more or less (+-) 20% difference. (Based on calculation.)
BEVERLYWOOD Pico-Robertson Mid-City Century City Cheviot Hills Palms For questions, comments, a tailor-made report for your home area, or a complimentary home valuation please contact LeHoa Gacki LeHoa Gacki Douglas Elliman Real Estate DRE #01422855 Lehoa.Gacki@elliman.com www.LeHoaGacki.com 424.276.7587 LeHoa’s Neighborhood Data Charts Los Angeles Real Estate LNDC APRIL 2023 Beverlywood A neighborhood in the City of Los Angeles
Area Typical Home Price (Median) Price per/ SqFt Days on Market Mid-Low Mid-High Homes Sold Cheviot Hills $2,962,500 $1,283 4 $2,317,500 $4,532,500 6 Century City $2,180,000 $954 87 $2,085,000 $2,275,000 2 Pico-Robertson $1,425,000 $860 9 $1,370,250 $1,931,250 4 Mid-City $1,210,000 $850 50 $1,050,000 $1,412,000 11 Palms $1,415,000 $898 14 $1,250,000 $2,240,000 5 Single Family Homes April 2023 $2,672,026 TYPICAL HOME PRICE (MEDIAN) $985 SOLD PRICE PER SQUARE FOOT 28 DAYS ON MARKET BEFORE SOLD (DOM) $1,595,000 ACTUAL LOWEST SOLD $4,500,000 ACTUAL HIGHEST SOLD WHAT YOUR MONEY BUYS YOU THIS MONTH CLICK HERE FOR MORE Beverlywood Home Analysis from: April 01, 2023 to April 30, 2023 3 Sold Sold Price **Overbid/ Underbid Square Feet Price per/SqFt YB LotSqFt BD BA Days on Market Actual Lowest Sold $1,595,000 100 1,619 $985 1948 6,998 2 2 0 Typical Home Price (Median)* $2,672,026 100 2,030 $985 1950 6,998 3 2 28 Actual Highest Sold $4,500,000 100 5,000 $900 2022 6,247 5 7 142 Average $2,922,342 99 2,883 $1,067 1973 6,775 3 4 57
Middle Range Variance $2,905,000 Middle Range Variance is future range Typical Home Price (Median) Price will vary by. Never more, Never less. Source: TheMLS/CLAW (Combined Los Angeles Westside)
*
Buyer or Seller Advantage by Price Point for Beverlywood as of April 30, 2023
Months supply of Inventory =
4-6 = BALANCED MARKET
Based on last 3 months of homes sales, Beverlywood has 1.5 months supply of inventory.
$15,000,000 $20,000,000 $11,000,000 $14,999,999 $7,000,000 $10,999,999 $6,750,000 $6,999,999 $6,500,000 $6,749,999 $6,250,000 $6,499,999 $6,000,000 $6,249,999 $5,750,000 $5,999,999 $5,500,000 $5,749,999 $5,250,000 $5,499,999 $5,000,000 $5,249,999
BUYER ADVANTAGE
BUYER ADVANTAGE
3 and under FAVORS SELLER
7 and over FAVORS BUYER
$4,750,000 $4,999,999 SELLER ADVANTAGE
$4,500,000 $4,749,999 SELLER ADVANTAGE
$4,250,000 $4,499,999
$4,000,000 $4,249,999
$3,750,000 $3,999,999
$3,500,000 $3,749,999
$3,250,000 $3,499,999 SELLER ADVANTAGE
$3,000,000 $3,249,999 $2,750,000 $2,999,999
$2,500,000 $2,749,999 SELLER ADVANTAGE
$2,250,000 $2,499,999 SELLER ADVANTAGE
$2,000,000 $2,249,999 SELLER ADVANTAGE
$1,750,000 $1,999,999
$1,500,000 $1,749,999 SELLER ADVANTAGE
$1,250,000 $1,499,999
$1,000,000 $1,249,999 SELLER ADVANTAGE
$500,000 $999,999
HOME PRICE RANGE
View homes below Contact for up to date homes for sale
Beverlywood Inventory for New Construction and Resale of Homes
& DEMAND
TheMLS/CLAW (Combined Los Angeles Westside) Under Contract Pending - Closing Soon New Construction New Con DOM Resale Resale DOM Home Price Range Homes Resold 2 1 4 88 1 $500,000 $999,999 $1,000,000 $1,249,999 1 $1,250,000 $1,499,999 $1,500,000 $1,749,999 1 11 $1,750,000 $1,999,999 $2,000,000 $2,249,999 $2,250,000 $2,499,999 1 2 147 $2,500,000 $2,749,999 $2,750,000 $2,999,999 $3,000,000 $3,249,999 1 1 $3,250,000 $3,499,999 $3,500,000 $3,749,999 $3,750,000 $3,999,999 $4,000,000 $4,249,999 1 46 $4,250,000 $4,499,999 $4,500,000 $4,749,999 $4,750,000 $4,999,999 $5,000,000 $5,249,999 $5,250,000 $5,499,999 $5,500,000 $5,749,999 $5,750,000 $5,999,999 $6,000,000 $6,249,999 $6,250,000 $6,499,999 $6,500,000 $6,749,999 $6,750,000 $6,999,999 $7,000,000 $10,999,999 $11,000,000 $14,999,999 $15,000,000 $20,000,000
SELLER ADVANTAGE SUPPLY
For Sale Source:
REALTORS
Homes as of April 30, 2023
Based on last 3 months of homes sales, Bel-Air has 7.9 months supply of inventory.
BUYER / INVESTOR ADVANTAGE
DEMAND
Sold Homes Days on Market Before Sold = DOM February March April Resold DOM New Cons New DOM Homes Resold Resold DOM New Cons New DOM Homes Resold Resold DOM New Cons New DOM 0 3 9 1 74 2 14 1 142 0 1 0 2 8 1 11 1 28 1 142 1 74
REALTORS DIGEST
4 YEAR TREND
**Overbid / Underbid: 100 is list price paid. Under 100 means sold for less than asking, over 100 sold probably in multiples and over asking.
Note: Square Footage calculation could be more or less (+-) 20% difference. (Based on calculation.)
* Middle Range Variance $1,640,000 Middle Range Variance is future range Typical Home Price (Median) Price will vary by. Never more, Never less.
For questions, comments, a tailor-made report for your home area, or a complimentary home valuation please contact LeHoa Gacki
$1,689,000 $1,635,000 $2,000,000 $1,883,750 $2,149,000 $2,307,500 $2,495,000 $2,668,513 $3,210,000 $3,558,750 $3,765,450 $3,523,750 $$500,000 $1,000,000 $1,500,000 $2,000,000 $2,500,000 $3,000,000 $3,500,000 $4,000,000 May 01, 2019 to Apr 30, 2020 May 01, 2020 to Apr 30, 2021 May 01, 2021 to Apr 30, 2022 May 01, 2022 to Apr 30, 2023 Mid-Low Typical Home Price-Median Mid-High
LeHoa Gacki, DRE #01422855 Douglas Elliman Real Estate 11990 San Vicente Blvd., #100, L.A., Ca 90049 Email: Lehoa.Gacki@elliman.com Tel | Fax: (424) 276-7587 www.Lehoagacki.com | Lehoagacki.elliman.com 4 YEAR OBSERVATION Beverlywood Number of Homes Sold: 51 56 63 34 May 01, 2019 to Apr 30, 2020 May 01, 2020 to Apr 30, 2021 May 01, 2021 to Apr 30, 2022 May 01, 2022 to Apr 30, 2023 Actual Lowest Sold $1,010,000 $1,150,000 $1,640,000 $1,200,000 Mid-Low $1,689,000 $1,635,000 $2,000,000 $1,883,750 Typical Home Price-Median $2,149,000 $2,307,500 $2,495,000 $2,668,513 Mid-High $3,210,000 $3,558,750 $3,765,450 $3,523,750 Actual Highest Sold $4,500,000 $5,550,000 $6,200,000 $6,800,000 Average Price Sold $2,413,103 $2,622,686 $2,866,092 $2,885,087 12 MONTH OBSERVATION Beverlywood Cumulative 12 months sold home analysis from: May 01, 2022 to April 30, 2023 34 Sold Sold Price **Overbid / Underbid Square Feet Price per/SqFt YB LotSqFt BD BA Days on Market Actual Lowest Sold $1,200,000 100 1,107 $1,084 1928 4,860 2 1 0 Mid-Low* $1,883,750 97 1,758 $920 1948 6,249 3 2 4 Typical Home Price-Median* $2,668,513 100 2,461 $1,073 1948 7,088 3 3 14 Mid-High* $3,523,750 104 3,303 $1,197 1950 7,919 5 4 29 Actual Highest Sold $6,800,000 97 6,872 $990 2018 7,689 6 7 72 Average $2,885,087 100 2,716 $1,074 1959 7,216 4 3 24
Source: TheMLS/CLAW
© 2022 LEHOA GACKI. DRE# 01422855. ALL WORLDWIDE RIGHTS RESERVED. DOUGLAS ELLIMAN REAL ESTATE. 150 EL CAMINO DRIVE, BEVERLY HILLS, CA 90212. 310.595.3888. ALL MATERIAL PRESENTED HEREIN IS INTENDED FOR INFORMATION PURPOSES ONLY AND NOT INTENDED TO CONSTITUTE PROFESSIONAL ADVICE OR WARRANTY OUTSIDE THE REALM OF REAL ESTATE BROKERAGE. MAPS CREATED FOR REFERENCE PURPOSE ONLY. WHILE THIS INFORMATION IS BELIEVED TO BE CORRECT, IT IS REPRESENTED SUBJECT TO ERRORS, OMISSIONS, CHANGES OR WITHDRAWAL WITHOUT NOTICE. BASED ON DATA SOURCED FROM THE COMBINED LOS ANGELES WESTSIDE MULTIPLE LISTING SERVICE AND PUBLIC RECORDS. STATISTICS ARE SUBJECT TO CHANGE DUE TO INDIVIDUAL REAL ESTATE COMPANY REPORTING DISCIPLINES. BUYER ADVANTAGE OR SELLER ADVANTAGE IS STRICTLY OF THE OPINION OF LEHOA GACKI AND ACCURACY CANNOT BE GUARANTEED AND MAY NOT REFLECT ALL REAL ESTATE ACTIVITY ON THE MARKET. ALL PROPERTY INFORMATION, INCLUDING, BUT NOT LIMITED TO MAPS, GRAPHS, DEPICTIONS, SQUARE FOOTAGE, ROOM COUNT, NUMBER OF BEDROOMS AND THE SCHOOL DISTRICT IN PROPERTY LISTINGS SHOULD BE VERIFIED BY YOUR OWN ATTORNEY, ARCHITECT OR ZONING EXPERT. NEW CONSTRUCTION COUNT, SQUARE FOOTAGE AND YEAR BUILT IS BASED ON INDIVIDUAL REAL ESTATE COMPANY REPORTING AND MAY BE DIFFERENT THAN PUBLIC RECORDS. NEW CONSTRUCTION COUNT IS BASED ON LISTING BROKERAGE LISTING YEAR. THE BROKER/AGENT PROVIDING THE INFORMATION CONTAINED HEREIN MAY OR MAY HAVE NOT BEEN THE LISTING AND/OR SELLING AGENT. THIS IS NOT INTENDED TO SOLICIT PROPERTY ALREADY LISTED. EQUAL HOUSING OPPORTUNITY. NEIGHBORHOOD BOUNDARY SOURCE: PUBLIC RECORDS, COMBINED LOS ANGELES WESTSIDE MULTIPLE LISTING SERVICE AND LOS ANGELES TIMES MAPPING L.A. https://maps.latimes.com/neighborhoods/index.html
(Combined Los Angeles Westside)
BEVERLYWOOD
$832 $892 $952 $914 $962 $939 $1,187 $982 $872 $942 $1,007 $933 $977 $969 $1,200 $1,020 $$200 $400 $600 $800 $1,000 $1,200 $1,400 Jan 01 to Jun 30, 2019 Jul 01 to Dec 31, 2019 Jan 01 to Jun 30, 2020 Jul 01 to Dec 31, 2020 Jan 01 to Jun 30, 2021 Jul 01 to Dec 31, 2021 Jan 01 to Jun 30, 2022 Jul 01 to Dec 31, 2022 Median Price Per Square Foot Average Price per SquareFt 40 41 14 11 20 20 11 295 10 15 20 25 30 35 40 45 Jan 01 to Jun 30, 2019 Jul 01 to Dec 31, 2019 Jan 01 to Jun 30, 2020 Jul 01 to Dec 31, 2020 Jan 01 to Jun 30, 2021 Jul 01 to Dec 31, 2021 Jan 01 to Jun 30, 2022 Jul 01 to Dec 31, 2022 Number of Homes Sold 20 36 14 31 40 26 26 15 Days on Market before Sold 3.7 3.5 3.8 4.5 2.6 1.5 0.0 0.5 1.0 1.5 2.0 2.5 3.0 3.5 4.0 4.5 5.0 Nov 30, 2022 Dec 31, 2022 Jan 31, 2023 Feb 28, 2023 Mar 31, 2023 Apr 30, 2023 Number of months it would take to sell all properties Active for sale if no new listings entered the market. END OF BEVERLYWOOD 6 PAGE REPORT
PER SQUARE FOOT - PRE & POST
PANDEMIC DAYS ON MARKET BEFORE SOLD- PRE & POST MAR 2020 PANDEMIC MONTHS SUPPLY OF INVENTORY - BASED ON LAST FEW MONTHS OF HOME SALES 3 and Under Favors Seller 4-6 = Balanced Market 7 and over Favors Buyer BEVERLYWOOD BEVERLYWOOD BEVERLYWOOD
SOLD HOME PRICE
MAR 2020
NEIGHBORING AREAS:
**Overbid/Underbid: 100 is list price paid. Under 100 means sold for less than asking, over 100 sold probably in multiples and over asking. Note: Square Footage calculation could be more or less (+-) 20% difference. (Based on calculation.) *
Single Family Homes April 2023 $3,377,500 TYPICAL HOME PRICE (MEDIAN) $1,313 SOLD PRICE PER SQUARE FOOT 18 DAYS ON MARKET BEFORE SOLD (DOM) $2,555,875 MID-LOW $4,912,499 MID-HIGH LeHoa’s Neighborhood Data Charts Los Angeles Real Estate LNDC APRIL 2023 For questions, comments, a tailor-made report for your home area, or a complimentary home valuation please contact LeHoa Gacki LeHoa Gacki Douglas Elliman Real Estate DRE #01422855 Lehoa.Gacki@elliman.com www.LeHoaGacki.com 424.276.7587 Brentwood A neighborhood in the City of Los Angeles BRENTWOOD Santa Monica Encino Bel-Air Westwood Sawtelle Pacific Palicades WHAT YOUR MONEY BUYS YOU THIS MONTH CLICK HERE FOR MORE Brentwood Home Analysis from: April 01, 2023 to April 30, 2023 12 Sold Sold Price **Overbid/ Underbid Square Feet Price per/SqFt YB LotSqFt BD BA Days on Market Actual Lowest Sold $2,405,000 96 1,832 $1,313 1963 5,280 3 3 24 Mid-Low* $2,555,875 97 1,854 $1,221 1938 6,152 3 2 7 Typical Home Price (Median)* $3,377,500 100 2,424 $1,313 1947 8,416 3 3 18 Mid-High* $4,912,499 110 3,639 $1,812 1960 18,149 4 4 28 Actual Highest Sold $16,200,000 93 4,752 $3,409 1930 34,174 4 3 64 Average $4,629,875 103 2,766 $1,579 1946 12,192 3 3 23
Middle
Variance $2,356,624 Middle Range Variance is future range Typical Home Price (Median) Price will vary by. Never more, Never less. Source: TheMLS/CLAW (Combined Los Angeles Westside)
Range
Area Typical Home Price (Median) Price per/ SqFt Days on Market Mid-Low Mid-High Homes Sold Pacific Palisades $3,900,000 $1,389 30 $2,580,000 $4,950,000 15 Encino $1,881,250 $810 13 $1,297,250 $3,064,000 34 Bel-Air $3,716,500 $703 109 $2,533,000 $4,900,000 2 Westwood $3,333,300 $1,080 9 $2,374,000 $3,620,590 7 Sawtelle $1,719,125 $994 10 $1,225,188 $2,596,875 4 Santa Monica $2,700,000 $1,425 8 $2,052,500 $5,495,356 13
Buyer or Seller Advantage by Price Point for Brentwood as of April 30, 2023
Months supply of Inventory =
4-6 = BALANCED MARKET
3 and under FAVORS SELLER
7 and over FAVORS BUYER
HOME PRICE RANGE $100,000,000 $200,000,000 $80,000,000 $99,999,999 $60,000,000 $79,999,999 BUYER ADVANTAGE $50,000,000 $59,999,999 BUYER ADVANTAGE $40,000,000 $49,999,999 $35,000,000 $39,999,999 $30,000,000 $34,999,999 SELLER ADVANTAGE BUYER ADVANTAGE $25,000,000 $29,999,999 $20,000,000 $24,999,999 SELLER ADVANTAGE $16,000,000 $19,999,999 SELLER ADVANTAGE $14,500,000 $15,999,999 SELLER ADVANTAGE $13,000,000 $14,499,999 SELLER ADVANTAGE $11,500,000 $12,999,999 $10,000,000 $11,499,999 SELLER ADVANTAGE $9,000,000 $9,999,999 SELLER ADVANTAGE BUYER ADVANTAGE $8,000,000 $8,999,999 $7,000,000 $7,999,999 SELLER ADVANTAGE $6,500,000 $6,999,999 SELLER ADVANTAGE $6,000,000 $6,499,999 SELLER ADVANTAGE $5,500,000
$5,999,999 SELLER ADVANTAGE $5,000,000 $5,499,999 SELLER ADVANTAGE $4,500,000 $4,999,999 SELLER ADVANTAGE
BUYER ADVANTAGE $4,000,000 $4,499,999 $3,500,000 $3,999,999 SELLER ADVANTAGE $3,000,000 $3,499,999 SELLER ADVANTAGE $2,500,000 $2,999,999 SELLER ADVANTAGE $2,000,000 $2,499,999 SELLER ADVANTAGE $1,500,000 $1,999,999
Based on last 3 months of homes sales, Brentwood has 2.9 months supply of inventory.
View homes below Contact for up to date homes for sale
Brentwood Inventory for New Construction and Resale of Homes
& DEMAND
TheMLS/CLAW (Combined Los Angeles Westside) Under Contract Pending - Closing Soon New Construction New Con DOM Resale Resale DOM Home Price Range Homes Resold 10 9 5 62 54 71 13 $1,500,000 $1,999,999 1 1 4 41 $2,000,000 $2,499,999 1 2 4 5 72 $2,500,000 $2,999,999 1 1 5 68 $3,000,000 $3,499,999 3 4 1 5 110 $3,500,000 $3,999,999 5 66 $4,000,000 $4,499,999 1 4 89 $4,500,000 $4,999,999 1 $5,000,000 $5,499,999 3 2 44 $5,500,000 $5,999,999 2 1 25 $6,000,000 $6,499,999 1 3 54 $6,500,000 $6,999,999 1 2 78 $7,000,000 $7,999,999 2 43 3 76 $8,000,000 $8,999,999 $9,000,000 $9,999,999 3 77 $10,000,000 $11,499,999 1 4 59 $11,500,000 $12,999,999 1 $13,000,000 $14,499,999 1 1 76 $14,500,000 $15,999,999 1 2 61 2 99 $16,000,000 $19,999,999 $20,000,000 $24,999,999 3 81 $25,000,000 $29,999,999 $30,000,000 $34,999,999 $35,000,000 $39,999,999 1 102 1 53 $40,000,000 $49,999,999 1 53 $50,000,000 $59,999,999 $60,000,000 $79,999,999 $80,000,000 $99,999,999 $100,000,000 $200,000,000 REALTORS
SELLER ADVANTAGE SUPPLY
For Sale Source:
Homes as of April 30, 2023
Based on last 3 months of homes sales, Bel-Air has 7.9 months supply of inventory.
BUYER / INVESTOR ADVANTAGE
DEMAND
Sold Homes Days on Market Before Sold = DOM February March April Resold DOM New Cons New DOM Homes Resold Resold DOM New Cons New DOM Homes Resold Resold DOM New Cons New DOM 42 34 35 3 38 12 23 86 1 25 3 31 13 4 37 1 28 15 1 4 3 14 3 9 1 0 1 21 2 7 2 10 58 2 14 14 1 11 2 32 3 17 5 133 1 21 1 25 15 1 39 1 107 99 1 0 1 28 89 4 9 1 7 1 64 1 0 1 0 REALTORS
DIGEST
4 YEAR TREND
Note: Square Footage calculation could be more or less (+-) 20% difference. (Based on calculation.) * Middle Range Variance $4,777,763
For questions, comments, a tailor-made report for your home area, or a complimentary home valuation please contact LeHoa Gacki
$2,300,000 $2,397,500 $2,778,750 $2,962,500 $3,100,000 $3,400,000 $3,679,508 $4,342,500 $5,350,000 $5,609,713 $6,100,000 $7,740,263 $$1,000,000 $2,000,000 $3,000,000 $4,000,000 $5,000,000 $6,000,000 $7,000,000 $8,000,000 $9,000,000 May 01, 2019 to Apr 30, 2020 May 01, 2020 to Apr 30, 2021 May 01, 2021 to Apr 30, 2022 May 01, 2022 to Apr 30, 2023 Mid-Low Typical Home Price-Median Mid-High
LeHoa
DRE #01422855 Douglas Elliman Real Estate 11990 San Vicente Blvd., #100, L.A., Ca 90049 Email: Lehoa.Gacki@elliman.com Tel | Fax: (424) 276-7587 www.Lehoagacki.com | Lehoagacki.elliman.com 4 YEAR OBSERVATION Brentwood Number of Homes Sold: 218 301 282 212 May 01, 2019 to Apr 30, 2020 May 01, 2020 to Apr 30, 2021 May 01, 2021 to Apr 30, 2022 May 01, 2022 to Apr 30, 2023 Actual Lowest Sold $904,000 $1,250,000 $1,280,000 $1,568,000 Mid-Low $2,300,000 $2,397,500 $2,778,750 $2,962,500 Typical Home Price-Median $3,100,000 $3,400,000 $3,679,508 $4,342,500 Mid-High $5,350,000 $5,609,713 $6,100,000 $7,740,263 Actual Highest Sold $28,000,000 $26,360,000 $65,000,000 $30,500,000 Average Price Sold $4,551,844 $4,829,619 $5,692,786 $6,209,199 12 MONTH OBSERVATION Brentwood Cumulative 12 months sold home analysis from: May 01, 2022 to April 30, 2023 212 Sold Sold Price **Overbid / Underbid Square Feet Price per/SqFt YB LotSqFt BD BA Days on Market Actual Lowest Sold $1,568,000 98 1,033 $1,518 1938 6,955 2 1 64 Mid-Low* $2,962,500 95 2,201 $1,105 1941 8,250 3 3 8 Typical Home Price-Median* $4,342,500 100 3,295 $1,312 1956 12,612 4 4 15 Mid-High* $7,740,263 102 5,330 $1,650 1979 21,308 5 6 37 Actual Highest Sold $30,500,000 100 6,887 $4,429 1936 25,296 5 6 0 Average $6,209,199 99 4,106 $1,495 1964 29,733 4 5 33
Gacki,
**Overbid / Underbid: 100 is list price paid. Under 100 means sold for less than asking, over 100 sold probably in multiples and over asking.
Source: TheMLS/CLAW (Combined
© 2022 LEHOA GACKI. DRE# 01422855. ALL WORLDWIDE RIGHTS RESERVED. DOUGLAS ELLIMAN REAL ESTATE. 150 EL CAMINO DRIVE, BEVERLY HILLS, CA 90212. 310.595.3888. ALL MATERIAL PRESENTED HEREIN IS INTENDED FOR INFORMATION PURPOSES ONLY AND NOT INTENDED TO CONSTITUTE PROFESSIONAL ADVICE OR WARRANTY OUTSIDE THE REALM OF REAL ESTATE BROKERAGE. MAPS CREATED FOR REFERENCE PURPOSE ONLY. WHILE THIS INFORMATION IS BELIEVED TO BE CORRECT, IT IS REPRESENTED SUBJECT TO ERRORS, OMISSIONS, CHANGES OR WITHDRAWAL WITHOUT NOTICE. BASED ON DATA SOURCED FROM THE COMBINED LOS ANGELES WESTSIDE MULTIPLE LISTING SERVICE AND PUBLIC RECORDS. STATISTICS ARE SUBJECT TO CHANGE DUE TO INDIVIDUAL REAL ESTATE COMPANY REPORTING DISCIPLINES. BUYER ADVANTAGE OR SELLER ADVANTAGE IS STRICTLY OF THE OPINION OF LEHOA GACKI AND ACCURACY CANNOT BE GUARANTEED AND MAY NOT REFLECT ALL REAL ESTATE ACTIVITY ON THE MARKET. ALL PROPERTY INFORMATION, INCLUDING, BUT NOT LIMITED TO MAPS, GRAPHS, DEPICTIONS, SQUARE FOOTAGE, ROOM COUNT, NUMBER OF BEDROOMS AND THE SCHOOL DISTRICT IN PROPERTY LISTINGS SHOULD BE VERIFIED BY YOUR OWN ATTORNEY, ARCHITECT OR ZONING EXPERT. NEW CONSTRUCTION COUNT, SQUARE FOOTAGE AND YEAR BUILT IS BASED ON INDIVIDUAL REAL ESTATE COMPANY REPORTING AND MAY BE DIFFERENT THAN PUBLIC RECORDS. NEW CONSTRUCTION COUNT IS BASED ON LISTING BROKERAGE LISTING YEAR. THE BROKER/AGENT PROVIDING THE INFORMATION CONTAINED HEREIN MAY OR MAY HAVE NOT BEEN THE LISTING AND/OR SELLING AGENT. THIS IS NOT INTENDED TO SOLICIT PROPERTY ALREADY LISTED. EQUAL HOUSING OPPORTUNITY. NEIGHBORHOOD BOUNDARY SOURCE: PUBLIC RECORDS, COMBINED LOS ANGELES WESTSIDE MULTIPLE LISTING SERVICE AND LOS ANGELES TIMES MAPPING L.A. https://maps.latimes.com/neighborhoods/index.html
Middle Range Variance is future range Typical Home Price (Median) Price will vary by. Never more, Never less.
Los Angeles Westside)
BRENTWOOD
$1,016 $958 $955 $1,008 $1,109 $1,132 $1,252 $1,230 $1,067 $1,057 $1,030 $1,103 $1,191 $1,237 $1,358 $1,369 $$200 $400 $600 $800 $1,000 $1,200 $1,400 $1,600 Jan 01 to Jun 30, 2019 Jul 01 to Dec 31, 2019 Jan 01 to Jun 30, 2020 Jul 01 to Dec 31, 2020 Jan 01 to Jun 30, 2021 Jul 01 to Dec 31, 2021 Jan 01 to Jun 30, 2022 Jul 01 to Dec 31, 2022 Median Price Per Square Foot Average Price per SquareFt 58 62 45 31 30 24 14 1710 20 30 40 50 60 70 Jan 01 to Jun 30, 2019 Jul 01 to Dec 31, 2019 Jan 01 to Jun 30, 2020 Jul 01 to Dec 31, 2020 Jan 01 to Jun 30, 2021 Jul 01 to Dec 31, 2021 Jan 01 to Jun 30, 2022 Jul 01 to Dec 31, 2022 Number of Homes Sold 117 113 77 165 164 155 137 79 Days on Market before Sold 3.4 2.5 4.0 6.0 3.2 2.9 0.0 1.0 2.0 3.0 4.0 5.0 6.0 7.0 Nov 30, 2022 Dec 31, 2022 Jan 31, 2023 Feb 28, 2023 Mar 31, 2023 Apr 30, 2023 Number of months it would take to sell all properties Active for sale if no new listings entered the market. END OF BRENTWOOD 6 PAGE REPORT
PRE & POST
PANDEMIC DAYS ON MARKET BEFORE SOLD- PRE & POST MAR 2020 PANDEMIC MONTHS SUPPLY OF INVENTORY - BASED ON LAST FEW MONTHS OF HOME SALES 3 and Under Favors Seller 4-6 = Balanced Market 7 and over Favors Buyer BRENTWOOD BRENTWOOD BRENTWOOD
SOLD HOME PRICE PER SQUARE FOOT -
MAR 2020
NEIGHBORING AREAS:
**Overbid/Underbid: 100 is list price paid. Under 100 means sold for less than asking, over 100 sold probably in multiples and over asking.
Note: Square Footage calculation could be more or less (+-) 20% difference. (Based on calculation.) Source: TheMLS/CLAW
Los Angeles Westside)
CENTURY CITY Westwood West Los Angeles Beverly Hills Pico-Robertson Cheviot Hills For questions, comments, a tailor-made report for your home area, or a complimentary home valuation please contact LeHoa Gacki LeHoa Gacki Douglas Elliman Real Estate DRE #01422855 Lehoa.Gacki@elliman.com www.LeHoaGacki.com 424.276.7587 LeHoa’s Neighborhood Data Charts Los Angeles Real Estate LNDC APRIL 2023 Century City A neighborhood in the city of Los Angeles
Area Typical Home Price (Median) Price per/ SqFt Days on Market Mid-Low Mid-High Homes Sold Westwood $3,333,300 $1,080 9 $2,374,000 $3,620,590 7 Beverly Hills $8,250,000 $1,448 66 $3,331,000 $9,600,000 11 PicoRobertson $1,425,000 $860 9 $1,370,250 $1,931,250 4 Cheviot Hills $2,962,500 $1,283 4 $2,317,500 $4,532,500 6 West Los Angeles $1,875,000 $1,131 6 $1,775,000 $2,250,000 3 WHAT YOUR MONEY BUYS YOU THIS MONTH CLICK HERE FOR MORE Century City Home Analysis from: April 01, 2023 to April 30, 2023 2 Sold Sold Price **Overbid/ Underbid Square Feet Price per/SqFt YB LotSqFt BD BA Days on Market Actual Lowest Sold $2,085,000 95 1,783 $1,169 1939 5,859 3 2 29 Typical Home Price (Median)* $2,180,000 93 2,431 $954 1960 6,330 4 3 87 Actual Highest Sold $2,275,000 91 3,078 $739 1980 6,800 4 3 145 Average $2,180,000 93 2,431 $954 1960 6,330 4 3 87
Single Family Homes April 2023 $2,180,000 TYPICAL HOME PRICE (MEDIAN) $954 SOLD PRICE PER SQUARE FOOT 87 DAYS ON MARKET BEFORE SOLD (DOM) $2,085,000 ACTUAL LOWEST SOLD $2,275,000 ACTUAL HIGHEST SOLD
(Combined
Buyer or Seller Advantage by Price Point for Century City as of April 30, 2023
Based on last 3 months of homes sales, Century City has 1.5 months supply of inventory.
$15,000,000 $20,000,000
$11,000,000 $14,999,999
Months supply of Inventory =
4-6 = BALANCED MARKET
3 and under FAVORS SELLER
7 and over FAVORS BUYER
$7,000,000 $10,999,999 SELLER ADVANTAGE
$6,750,000 $6,999,999
$6,500,000 $6,749,999
BUYER ADVANTAGE
$6,250,000 $6,499,999
BUYER ADVANTAGE $6,000,000 $6,249,999
$5,750,000 $5,999,999
$5,500,000 $5,749,999
$5,250,000 $5,499,999
$5,000,000 $5,249,999
$4,750,000 $4,999,999
$4,500,000 $4,749,999
$4,250,000 $4,499,999
$4,000,000 $4,249,999
$3,750,000 $3,999,999
$3,500,000 $3,749,999 SELLER ADVANTAGE
$3,250,000 $3,499,999
$3,000,000 $3,249,999 $2,750,000 $2,999,999
$2,500,000 $2,749,999
$2,250,000 $2,499,999 SELLER ADVANTAGE
$2,000,000 $2,249,999
$1,750,000 $1,999,999
$1,500,000 $1,749,999
$1,250,000 $1,499,999
$1,000,000 $1,249,999
$500,000 $999,999
SELLER ADVANTAGE
SELLER ADVANTAGE
SELLER ADVANTAGE
HOME PRICE RANGE
View homes below Contact for up to date homes for sale
Century City Inventory for New Construction and Resale of Homes
ADVANTAGE SUPPLY & DEMAND
TheMLS/CLAW (Combined Los Angeles Westside) Under Contract Pending - Closing Soon New Construction New Con DOM Resale Resale DOM Home Price Range Homes Resold 1 3 75 $500,000 $999,999 $1,000,000 $1,249,999 $1,250,000 $1,499,999 $1,500,000 $1,749,999 $1,750,000 $1,999,999 1 $2,000,000 $2,249,999 $2,250,000 $2,499,999 $2,500,000 $2,749,999 $2,750,000 $2,999,999 $3,000,000 $3,249,999 $3,250,000 $3,499,999 $3,500,000 $3,749,999 $3,750,000 $3,999,999 $4,000,000 $4,249,999 $4,250,000 $4,499,999 $4,500,000 $4,749,999 $4,750,000 $4,999,999 $5,000,000 $5,249,999 $5,250,000 $5,499,999 $5,500,000 $5,749,999 $5,750,000 $5,999,999 1 104 $6,000,000 $6,249,999 1 4 $6,250,000 $6,499,999 $6,500,000 $6,749,999 $6,750,000 $6,999,999 1 117 $7,000,000 $10,999,999 $11,000,000 $14,999,999 $15,000,000 $20,000,000
SELLER
For Sale Source:
REALTORS
Homes as of April 30, 2023
DEMAND
Based on last 3 months of homes sales, Bel-Air has 7.9 months supply of inventory.
BUYER / INVESTOR ADVANTAGE
Sold Homes Days on Market Before Sold = DOM February March April Resold DOM New Cons New DOM Homes Resold Resold DOM New Cons New DOM Homes Resold Resold DOM New Cons New DOM 4 26 2 87 1 17 1 11 1 29 1 145 1 14 1 63
DIGEST
REALTORS
4 YEAR TREND
Mid-Low Typical Home Price-Median Mid-High
**Overbid / Underbid: 100 is list price paid. Under 100 means sold for less than asking, over 100 sold probably in multiples and over asking.
Note: Square Footage calculation could be more or less (+-) 20% difference. (Based on calculation.)
* Middle Range Variance $2,862,706 Middle Range Variance is future range Typical Home Price (Median) Price will vary by. Never more, Never less.
For questions, comments, a tailor-made report for your home area, or a complimentary home valuation please contact LeHoa Gacki

$1,848,750 $1,590,000 $1,701,583 $1,982,500 $2,311,250 $1,965,228 $2,343,750 $2,440,000 $2,522,500 $2,380,000 $3,238,579 $4,845,206 $$1,000,000 $2,000,000 $3,000,000 $4,000,000 $5,000,000 $6,000,000 May 01, 2019 to Apr 30, 2020 May 01, 2020 to Apr 30, 2021 May 01, 2021 to Apr 30, 2022 May 01, 2022 to Apr 30, 2023
LeHoa Gacki, DRE #01422855 Douglas Elliman Real Estate 11990 San Vicente Blvd., #100, L.A., Ca 90049 Email: Lehoa.Gacki@elliman.com Tel | Fax: (424) 276-7587 www.Lehoagacki.com | Lehoagacki.elliman.com 4 YEAR OBSERVATION Century City Number of Homes Sold: 12 27 18 17 May 01, 2019 to Apr 30, 2020 May 01, 2020 to Apr 30, 2021 May 01, 2021 to Apr 30, 2022 May 01, 2022 to Apr 30, 2023 Actual Lowest Sold $1,510,000 $1,245,000 $1,550,000 $1,620,000 Mid-Low $1,848,750 $1,590,000 $1,701,583 $1,982,500 Typical Home Price-Median $2,311,250 $1,965,228 $2,343,750 $2,440,000 Mid-High $2,522,500 $2,380,000 $3,238,579 $4,845,206 Actual Highest Sold $3,050,000 $4,000,000 $7,100,000 $9,350,000 Average Price Sold $2,274,958 $2,110,330 $2,999,126 $3,582,421 12 MONTH OBSERVATION Century City Cumulative 12 months sold home analysis from: May 01, 2022 to April 30, 2023 17 Sold Sold Price **Overbid / Underbid Square Feet Price per/SqFt YB LotSqFt BD BA Days on Market Actual Lowest Sold $1,620,000 98 1,574 $1,029 1931 5,833 2 1 17 Mid-Low* $1,982,500 94 1,711 $1,027 1932 5,835 3 2 11 Typical Home Price-Median* $2,440,000 98 2,518 $1,169 1940 6,251 3 3 15 Mid-High* $4,845,206 107 4,587 $1,342 1996 38,788 5 5 38 Actual Highest Sold $9,350,000 94 6,471 $1,445 2016 70,698 5 7 13 Average $3,582,421 100 3,090 $1,162 1963 63,561 4 3 34
Source:
© 2022 LEHOA GACKI. DRE# 01422855. ALL WORLDWIDE RIGHTS RESERVED. DOUGLAS ELLIMAN REAL ESTATE. 150 EL CAMINO DRIVE, BEVERLY HILLS, CA 90212. 310.595.3888. ALL MATERIAL PRESENTED HEREIN IS INTENDED FOR INFORMATION PURPOSES ONLY AND NOT INTENDED TO CONSTITUTE PROFESSIONAL ADVICE OR WARRANTY OUTSIDE THE REALM OF REAL ESTATE BROKERAGE. MAPS CREATED FOR REFERENCE PURPOSE ONLY. WHILE THIS INFORMATION IS BELIEVED TO BE CORRECT, IT IS REPRESENTED SUBJECT TO ERRORS, OMISSIONS, CHANGES OR WITHDRAWAL WITHOUT NOTICE. BASED ON DATA SOURCED FROM THE COMBINED LOS ANGELES WESTSIDE MULTIPLE LISTING SERVICE AND PUBLIC RECORDS. STATISTICS ARE SUBJECT TO CHANGE DUE TO INDIVIDUAL REAL ESTATE COMPANY REPORTING DISCIPLINES. BUYER ADVANTAGE OR SELLER ADVANTAGE IS STRICTLY OF THE OPINION OF LEHOA GACKI AND ACCURACY CANNOT BE GUARANTEED AND MAY NOT REFLECT ALL REAL ESTATE ACTIVITY ON THE MARKET. ALL PROPERTY INFORMATION, INCLUDING, BUT NOT LIMITED TO MAPS, GRAPHS, DEPICTIONS, SQUARE FOOTAGE, ROOM COUNT, NUMBER OF BEDROOMS AND THE SCHOOL DISTRICT IN PROPERTY LISTINGS SHOULD BE VERIFIED BY YOUR OWN ATTORNEY, ARCHITECT OR ZONING EXPERT. NEW CONSTRUCTION COUNT, SQUARE FOOTAGE AND YEAR BUILT IS BASED ON INDIVIDUAL REAL ESTATE COMPANY REPORTING AND MAY BE DIFFERENT THAN PUBLIC RECORDS. NEW CONSTRUCTION COUNT IS BASED ON LISTING BROKERAGE LISTING YEAR. THE BROKER/AGENT PROVIDING THE INFORMATION CONTAINED HEREIN MAY OR MAY HAVE NOT BEEN THE LISTING AND/OR SELLING AGENT. THIS IS NOT INTENDED TO SOLICIT PROPERTY ALREADY LISTED. EQUAL HOUSING OPPORTUNITY. NEIGHBORHOOD BOUNDARY SOURCE: PUBLIC RECORDS, COMBINED LOS ANGELES WESTSIDE MULTIPLE LISTING SERVICE AND LOS ANGELES TIMES MAPPING L.A. https://maps.latimes.com/neighborhoods/index.html CENTURY CITY
TheMLS/CLAW (Combined Los Angeles Westside)
$873 $849 $932 $980 $1,032 $1,132 $1,347 $1,204 $800 $878 $932 $995 $1,011 $1,065 $1,337 $1,247 $$200 $400 $600 $800 $1,000 $1,200 $1,400 $1,600 Jan 01 to Jun 30, 2019 Jul 01 to Dec 31, 2019 Jan 01 to Jun 30, 2020 Jul 01 to Dec 31, 2020 Jan 01 to Jun 30, 2021 Jul 01 to Dec 31, 2021 Jan 01 to Jun 30, 2022 Jul 01 to Dec 31, 2022 Median Price Per Square Foot Average Price per SquareFt 18 15 21 34 15 57 10 1610 20 30 40 50 60 Jan 01 to Jun 30, 2019 Jul 01 to Dec 31, 2019 Jan 01 to Jun 30, 2020 Jul 01 to Dec 31, 2020 Jan 01 to Jun 30, 2021 Jul 01 to Dec 31, 2021 Jan 01 to Jun 30, 2022 Jul 01 to Dec 31, 2022 Number of Homes Sold 5 7 2 18 14 9 6 8 Days on Market before Sold 7.5 3.0 7.5 6.0 2.3 1.5 0.0 1.0 2.0 3.0 4.0 5.0 6.0 7.0 8.0 Nov 30, 2022 Dec 31, 2022 Jan 31, 2023 Feb 28, 2023 Mar 31, 2023 Apr 30, 2023 Number of months it would take to sell all properties Active for sale if no new listings entered the market. END OF CENTURY CITY 6 PAGE REPORT SOLD HOME PRICE PER SQUARE FOOT - PRE & POST MAR 2020 PANDEMIC DAYS ON MARKET BEFORE SOLD- PRE & POST MAR 2020 PANDEMIC MONTHS SUPPLY OF INVENTORY - BASED ON LAST FEW MONTHS OF HOME SALES 3 and Under Favors Seller 4-6 = Balanced Market 7 and over Favors Buyer CENTURY CITY CENTURY CITY CENTURY CITY
NEIGHBORING AREAS:
**Overbid/Underbid: 100 is list price paid. Under 100 means sold for less than asking, over 100 sold probably in multiples and over asking.
Note: Square Footage calculation could be more or less (+-) 20% difference. (Based on calculation.)
Single Family Homes April 2023 $2,962,500 TYPICAL HOME PRICE (MEDIAN) $1,283 SOLD PRICE PER SQUARE FOOT 4 DAYS ON MARKET BEFORE SOLD (DOM) $2,317,500 ACTUAL LOWEST SOLD $4,532,500 ACTUAL HIGHEST SOLD
home
home valuation
LeHoa Gacki Douglas Elliman Real Estate
www.LeHoaGacki.com 424.276.7587 LeHoa’s Neighborhood Data Charts Los Angeles Real Estate LNDC APRIL 2023 Cheviot Hills A neighborhood in the City of Los Angeles CHEVIOT HILLS Pico-Robertson Century City Beverlywood West Los Angeles Palms Rancho Park
For questions, comments, a tailor-made report for your
area, or a complimentary
please contact LeHoa Gacki
DRE #01422855 Lehoa.Gacki@elliman.com
Area Typical Home Price (Median) Price per/ SqFt Days on Market Mid-Low Mid-High Homes Sold Rancho Park $1,350,000 $1,331 5 $1,350,000 $1,350,000 1 West Los Angeles $1,875,000 $1,131 6 $1,775,000 $2,250,000 3 Century City $2,180,000 $954 87 $2,085,000 $2,275,000 2 PicoRobertson $1,425,000 $860 9 $1,370,250 $1,931,250 4 Beverlywood $2,672,026 $985 28 $1,595,000 $4,500,000 3 Palms $1,415,000 $898 14 $1,250,000 $2,240,000 5 WHAT YOUR MONEY BUYS YOU THIS MONTH CLICK HERE FOR MORE Cheviot Hills Home Analysis from: April 01, 2023 to April 30, 2023 6 Sold Sold Price **Overbid/ Underbid Square Feet Price per/SqFt YB LotSqFt BD BA Days on Market Actual Lowest Sold $1,695,000 101 1,981 $856 1948 12,073 2 2 15 Mid-Low* $2,317,500 98 1,902 $937 1934 6,972 3 2 0 Typical Home Price (Median)* $2,962,500 100 2,589 $1,283 1948 8,436 4 4 4 Mid-High* $4,532,500 108 3,480 $1,382 2012 10,715 5 4 15 Actual Highest Sold $6,130,000 100 4,843 $1,266 2011 10,262 5 5 0 Average $3,379,167 102 2,782 $1,212 1964 8,751 4 3 6
$2,215,000 Middle
range Typical Home Price (Median)
will
Never more, Never less. Source: TheMLS/CLAW
Los Angeles Westside)
* Middle Range Variance
Range Variance is future
Price
vary by.
(Combined
Buyer or Seller Advantage by Price Point for Cheviot Hills as of April 30, 2023
Based on last 3 months of homes sales, Cheviot Hills has 0.5 months supply of inventory.
$15,000,000 $20,000,000 $12,000,000 $14,999,999
$11,000,000 $11,999,999
$10,000,000 $10,999,999
$9,000,000 $9,999,999 $8,000,000 $8,999,999
$7,500,000 $7,999,999
$7,000,000 $7,499,999
Months supply of Inventory =
4-6 = BALANCED MARKET
3 and under FAVORS SELLER
7 and over FAVORS BUYER
$6,500,000 $6,999,999 SELLER ADVANTAGE
$6,000,000 $6,499,999 SELLER ADVANTAGE
$5,500,000 $5,999,999
$5,000,000 $5,499,999 SELLER ADVANTAGE
$4,750,000 $4,999,999 SELLER ADVANTAGE
$4,500,000 $4,749,999
$4,250,000 $4,499,999
$4,000,000 $4,249,999 SELLER ADVANTAGE
$3,750,000 $3,999,999
$3,500,000 $3,749,999
$3,250,000 $3,499,999 SELLER ADVANTAGE
$3,000,000 $3,249,999
$2,750,000 $2,999,999 SELLER ADVANTAGE
$2,500,000 $2,749,999 SELLER ADVANTAGE
$2,250,000 $2,499,999
$2,000,000 $2,249,999
$1,750,000 $1,999,999
$1,500,000 $1,749,999
SELLER ADVANTAGE
SELLER ADVANTAGE
$1,250,000 $1,499,999 SELLER ADVANTAGE
$1,000,000 $1,249,999
HOME PRICE RANGE
TO VIEW MORE View homes below Contact for up to date homes for sale
Cheviot Hills Inventory for New Construction and Resale of Homes
ADVANTAGE SUPPLY & DEMAND
TheMLS/CLAW (Combined Los Angeles Westside) Under Contract Pending - Closing Soon New Construction New Con DOM Resale Resale DOM Home Price Range Homes Resold 2 3 3 98 2 $1,000,000 $1,249,999 $1,250,000 $1,499,999 $1,500,000 $1,749,999 $1,750,000 $1,999,999 1 $2,000,000 $2,249,999 2 $2,250,000 $2,499,999 $2,500,000 $2,749,999 1 1 90 $2,750,000 $2,999,999 1 $3,000,000 $3,249,999 $3,250,000 $3,499,999 $3,500,000 $3,749,999 2 102 $3,750,000 $3,999,999 $4,000,000 $4,249,999 $4,250,000 $4,499,999 $4,500,000 $4,749,999 1 $4,750,000 $4,999,999 1 $5,000,000 $5,499,999 $5,500,000 $5,999,999 $6,000,000 $6,499,999 $6,500,000 $6,999,999 $7,000,000 $7,499,999 $7,500,000 $7,999,999 $8,000,000 $8,999,999 $9,000,000 $9,999,999 $10,000,000 $10,999,999 $11,000,000 $11,999,999 $12,000,000 $14,999,999 $15,000,000 $20,000,000 REALTORS
SELLER
For Sale Source:
Homes as of April 30, 2023
Based on last 3 months of homes sales, Bel-Air has 7.9 months supply of inventory.
BUYER / INVESTOR ADVANTAGE
DEMAND
Sold Homes Days on Market Before Sold = DOM February March April Resold DOM New Cons New DOM Homes Resold Resold DOM New Cons New DOM Homes Resold Resold DOM New Cons New DOM 89 8 17 1 74 6 6 1 9 1 15 1 0 45 2 3 132 1 15 1 8 1 2 1 74 3 11 1 0 1 0 1 88
REALTORS DIGEST
4 YEAR TREND
**Overbid / Underbid: 100 is list price paid. Under 100 means sold for less than asking, over 100 sold probably in multiples and over asking.
Note: Square Footage calculation could be more or less (+-) 20% difference. (Based on calculation.)
* Middle Range Variance $1,858,750 Middle Range Variance is future range Typical Home Price (Median) Price will vary by. Never more, Never less.
For questions, comments, a tailor-made report for your home area, or a complimentary home valuation please contact LeHoa Gacki
$1,898,750 $2,227,944 $2,404,750 $2,130,000 $2,406,943 $2,775,000 $3,212,500 $2,954,440 $3,067,500 $3,450,000 $3,968,000 $3,988,750 $$500,000 $1,000,000 $1,500,000 $2,000,000 $2,500,000 $3,000,000 $3,500,000 $4,000,000 $4,500,000 May 01, 2019 to Apr 30, 2020 May 01, 2020 to Apr 30, 2021 May 01, 2021 to Apr 30, 2022 May 01, 2022 to Apr 30, 2023 Mid-Low Typical Home Price-Median Mid-High
LeHoa Gacki, DRE #01422855 Douglas Elliman Real Estate 11990 San Vicente Blvd., #100, L.A., Ca 90049 Email: Lehoa.Gacki@elliman.com Tel | Fax: (424) 276-7587 www.Lehoagacki.com | Lehoagacki.elliman.com 4 YEAR OBSERVATION Cheviot Hills Number of Homes Sold: 58 65 56 62 May 01, 2019 to Apr 30, 2020 May 01, 2020 to Apr 30, 2021 May 01, 2021 to Apr 30, 2022 May 01, 2022 to Apr 30, 2023 Actual Lowest Sold $1,095,000 $1,400,000 $1,600,000 $1,450,000 Mid-Low $1,898,750 $2,227,944 $2,404,750 $2,130,000 Typical Home Price-Median $2,406,943 $2,775,000 $3,212,500 $2,954,440 Mid-High $3,067,500 $3,450,000 $3,968,000 $3,988,750 Actual Highest Sold $5,600,000 $6,800,000 $11,000,000 $9,000,000 Average Price Sold $2,506,819 $3,011,441 $3,524,955 $3,377,961 12 MONTH OBSERVATION Cheviot Hills Cumulative 12 months sold home analysis from: May 01, 2022 to April 30, 2023 62 Sold Sold Price **Overbid / Underbid Square Feet Price per/SqFt YB LotSqFt BD BA Days on Market Actual Lowest Sold $1,450,000 97 1,213 $1,195 1950 5,848 2 1 9 Mid-Low* $2,130,000 95 1,968 $990 1937 6,252 3 3 7 Typical Home Price-Median* $2,954,440 100 2,677 $1,100 1950 7,489 4 3 14 Mid-High* $3,988,750 101 3,535 $1,210 2001 8,750 5 5 37 Actual Highest Sold $9,000,000 103 6,972 $1,291 2022 8,576 6 8 28 Average $3,377,961 99 2,942 $1,107 1961 8,283 4 4 32
Source: TheMLS/CLAW
© 2022 LEHOA GACKI. DRE# 01422855. ALL WORLDWIDE RIGHTS RESERVED. DOUGLAS ELLIMAN REAL ESTATE. 150 EL CAMINO DRIVE, BEVERLY HILLS, CA 90212. 310.595.3888. ALL MATERIAL PRESENTED HEREIN IS INTENDED FOR INFORMATION PURPOSES ONLY AND NOT INTENDED TO CONSTITUTE PROFESSIONAL ADVICE OR WARRANTY OUTSIDE THE REALM OF REAL ESTATE BROKERAGE. MAPS CREATED FOR REFERENCE PURPOSE ONLY. WHILE THIS INFORMATION IS BELIEVED TO BE CORRECT, IT IS REPRESENTED SUBJECT TO ERRORS, OMISSIONS, CHANGES OR WITHDRAWAL WITHOUT NOTICE. BASED ON DATA SOURCED FROM THE COMBINED LOS ANGELES WESTSIDE MULTIPLE LISTING SERVICE AND PUBLIC RECORDS. STATISTICS ARE SUBJECT TO CHANGE DUE TO INDIVIDUAL REAL ESTATE COMPANY REPORTING DISCIPLINES. BUYER ADVANTAGE OR SELLER ADVANTAGE IS STRICTLY OF THE OPINION OF LEHOA GACKI AND ACCURACY CANNOT BE GUARANTEED AND MAY NOT REFLECT ALL REAL ESTATE ACTIVITY ON THE MARKET. ALL PROPERTY INFORMATION, INCLUDING, BUT NOT LIMITED TO MAPS, GRAPHS, DEPICTIONS, SQUARE FOOTAGE, ROOM COUNT, NUMBER OF BEDROOMS AND THE SCHOOL DISTRICT IN PROPERTY LISTINGS SHOULD BE VERIFIED BY YOUR OWN ATTORNEY, ARCHITECT OR ZONING EXPERT. NEW CONSTRUCTION COUNT, SQUARE FOOTAGE AND YEAR BUILT IS BASED ON INDIVIDUAL REAL ESTATE COMPANY REPORTING AND MAY BE DIFFERENT THAN PUBLIC RECORDS. NEW CONSTRUCTION COUNT IS BASED ON LISTING BROKERAGE LISTING YEAR. THE BROKER/AGENT PROVIDING THE INFORMATION CONTAINED HEREIN MAY OR MAY HAVE NOT BEEN THE LISTING AND/OR SELLING AGENT. THIS IS NOT INTENDED TO SOLICIT PROPERTY ALREADY LISTED. EQUAL HOUSING OPPORTUNITY. NEIGHBORHOOD BOUNDARY SOURCE: PUBLIC RECORDS, COMBINED LOS ANGELES WESTSIDE MULTIPLE LISTING SERVICE AND LOS ANGELES TIMES MAPPING L.A. https://maps.latimes.com/neighborhoods/index.html
(Combined Los Angeles Westside)
CHEVIOT HILLS
$917 $809 $921 $926 $961 $969 $1,071 $1,076 $948 $851 $913 $930 $984 $1,011 $1,116 $1,077 $$200 $400 $600 $800 $1,000 $1,200 Jan 01 to Jun 30, 2019 Jul 01 to Dec 31, 2019 Jan 01 to Jun 30, 2020 Jul 01 to Dec 31, 2020 Jan 01 to Jun 30, 2021 Jul 01 to Dec 31, 2021 Jan 01 to Jun 30, 2022 Jul 01 to Dec 31, 2022 Median Price Per Square Foot Average Price per SquareFt 34 24 33 25 35 13 12 185 10 15 20 25 30 35 40 Jan 01 to Jun 30, 2019 Jul 01 to Dec 31, 2019 Jan 01 to Jun 30, 2020 Jul 01 to Dec 31, 2020 Jan 01 to Jun 30, 2021 Jul 01 to Dec 31, 2021 Jan 01 to Jun 30, 2022 Jul 01 to Dec 31, 2022 Number of Homes Sold 33 28 22 34 32 30 27 35 Days on Market before Sold 1.1 1.1 2.4 2.0 1.4 0.5 0.0 0.5 1.0 1.5 2.0 2.5 3.0 Nov 30, 2022 Dec 31, 2022 Jan 31, 2023 Feb 28, 2023 Mar 31, 2023 Apr 30, 2023 Number of months it would take to sell all properties Active for sale if no new listings entered the market. END OF CHEVIOT HILLS 6 PAGE REPORT
PER SQUARE FOOT - PRE & POST
PANDEMIC DAYS ON MARKET BEFORE SOLD- PRE & POST MAR 2020 PANDEMIC MONTHS SUPPLY OF INVENTORY - BASED ON LAST FEW MONTHS OF HOME SALES 3 and Under Favors Seller 4-6 = Balanced Market 7 and over Favors Buyer CHEVIOT HILLS CHEVIOT HILLS CHEVIOT HILLS
SOLD HOME PRICE
MAR 2020
NEIGHBORING AREAS:
**Overbid/Underbid: 100 is list price paid. Under 100 means sold for less than asking, over 100 sold probably in multiples and over asking.
Note: Square Footage calculation could be more or less (+-) 20% difference. (Based on calculation.)
Single Family Homes April 2023 $1,601,000 TYPICAL HOME PRICE (MEDIAN) $1,190 SOLD PRICE PER SQUARE FOOT 29 DAYS ON MARKET BEFORE SOLD (DOM) $1,400,000 MID-LOW $1,930,000 MID-HIGH For questions, comments, a tailor-made report for your home area, or a complimentary home valuation please contact LeHoa Gacki LeHoa Gacki Douglas Elliman Real Estate DRE #01422855 Lehoa.Gacki@elliman.com www.LeHoaGacki.com 424.276.7587 LeHoa’s Neighborhood Data Charts Los Angeles Real Estate LNDC APRIL 2023 Culver City A City in Los Angeles County CULVER CITY Palms Mid-city Mar Vista Playa Vista Venice Ladera Heights Del Rey West Adams Baldwin Hills/ Crenshaw WHAT YOUR MONEY BUYS YOU THIS MONTH CLICK HERE FOR MORE Culver City Home Analysis from: April 01, 2023 to April 30, 2023 7 Sold Sold Price **Overbid/ Underbid Square Feet Price per/SqFt YB LotSqFt BD BA Days on Market Actual Lowest Sold $1,000,000 80 840 $1,190 1946 4,552 2 1 33 Mid-Low* $1,400,000 97 912 $1,056 1929 4,933 2 1 13 Typical Home Price (Median)* $1,601,000 99 1,307 $1,190 1946 5,400 3 2 29 Mid-High* $1,930,000 101 1,845 $1,383 1948 6,746 4 4 49 Actual Highest Sold $2,250,000 100 1,845 $1,220 1948 4,996 4 4 26 Average $1,636,571 97 1,513 $1,170 1935 5,626 3 2 51
Middle Range Variance $530,000 Middle Range Variance is future range Typical Home Price (Median) Price will vary by. Never more, Never less.
TheMLS/CLAW (Combined Los Angeles Westside)
*
Source:
Area Typical Home Price (Median) Price per/ SqFt Days on Market Mid-Low Mid-High Homes Sold Del Rey $1,504,000 $1,069 12 $1,271,500 $2,443,250 9 Venice $2,755,000 $1,461 46 $1,800,817 $4,300,000 19 Mar Vista $1,795,000 $1,105 10 $1,544,000 $2,235,000 17 Palms $1,415,000 $898 14 $1,250,000 $2,240,000 5 Mid-City $1,210,000 $850 50 $1,050,000 $1,412,000 11 West Adams $810,000 $753 14 $675,000 $948,750 6 Ladera Heights $1,515,000 $668 21 $1,150,000 $1,995,000 3 Playa Vista $2,185,000 $871 14 $1,575,000 $2,795,000 2
Buyer or Seller Advantage by Price Point for Culver City as of April 30, 2023
Based
Months supply of Inventory =
4-6 = BALANCED MARKET
3 and under FAVORS SELLER
7 and over FAVORS BUYER
$6,000,000 $10,000,000 $5,000,000 $5,999,999
BUYER ADVANTAGE $4,450,000 $4,999,999 $4,300,000 $4,449,999 $4,150,000 $4,299,999 $4,000,000 $4,149,999 $3,850,000 $3,999,999 $3,700,000 $3,849,999
BUYER ADVANTAGE $3,550,000 $3,699,999 $3,400,000 $3,549,999
$3,250,000 $3,399,999 $3,100,000 $3,249,999
$2,950,000 $3,099,999 SELLER ADVANTAGE
$2,800,000 $2,949,999 SELLER ADVANTAGE
$2,650,000 $2,799,999 SELLER ADVANTAGE
$2,500,000 $2,649,999
$2,350,000 $2,499,999
$2,200,000 $2,349,999 SELLER ADVANTAGE
$2,050,000 $2,199,999 SELLER ADVANTAGE
$1,900,000 $2,049,999 SELLER ADVANTAGE
$1,750,000 $1,899,999 SELLER ADVANTAGE
$1,600,000 $1,749,999 SELLER ADVANTAGE
$1,450,000 $1,599,999 SELLER ADVANTAGE
$1,300,000 $1,449,999 SELLER ADVANTAGE
$1,150,000 $1,299,999 SELLER ADVANTAGE
$1,000,000 $1,149,999 SELLER ADVANTAGE
$750,000 $999,999 SELLER ADVANTAGE
$500,000 $749,999
HOME PRICE RANGE
on last 3 months of homes sales, Culver City has 1.5 months supply of inventory.
View homes below Contact for up to date homes for sale
Culver City Inventory for New Construction and Resale of Homes
SUPPLY & DEMAND
Under Contract Pending - Closing Soon New Construction New Con DOM Resale Resale DOM Home Price Range Homes Resold 4 8 2 6 12 24 9 $500,000 $749,999 $750,000 $999,999 $1,000,000 $1,149,999 1 1 2 $1,150,000 $1,299,999 1 2 2 24 $1,300,000 $1,449,999 1 1 2 6 $1,450,000 $1,599,999 1 2 1 14 $1,600,000 $1,749,999 2 1 1 1 9 $1,750,000 $1,899,999 1 19 $1,900,000 $2,049,999 $2,050,000 $2,199,999 1 1 14 $2,200,000 $2,349,999 1 2 44 $2,350,000 $2,499,999 1 $2,500,000 $2,649,999 $2,650,000 $2,799,999 $2,800,000 $2,949,999 1 1 1 11 $2,950,000 $3,099,999 $3,100,000 $3,249,999 $3,250,000 $3,399,999 $3,400,000 $3,549,999 1 7 1 68 $3,550,000 $3,699,999 $3,700,000 $3,849,999 $3,850,000 $3,999,999 $4,000,000 $4,149,999 $4,150,000 $4,299,999 $4,300,000 $4,449,999 1 5 $4,450,000 $4,999,999 $5,000,000 $5,999,999 $6,000,000 $10,000,000 REALTORS
SELLER ADVANTAGE
For Sale Source: TheMLS/CLAW (Combined Los Angeles Westside)
as of April 30, 2023
DIGEST
Based on last 3 months of homes sales, Bel-Air has 7.9 months supply of inventory.
BUYER / INVESTOR ADVANTAGE
DEMAND
Sold Homes Days on Market Before Sold = DOM February March April Resold DOM New Cons New DOM Homes Resold Resold DOM New Cons New DOM Homes Resold Resold DOM New Cons New DOM 23 10 34 2 94 7 51 2 0 0 1 33 54 1 0 3 40 1 200 11 2 40 1 29 11 1 13 1 9 1 49 78 14 1 17 1 26 13 2 94 12 1 0 REALTORS
4 YEAR TREND
Mid-Low Typical Home Price-Median Mid-High
**Overbid / Underbid: 100 is list price paid. Under 100 means sold for less than asking, over 100 sold probably in multiples and over asking.
Note: Square Footage calculation could be more or less (+-) 20% difference. (Based on calculation.)
* Middle Range Variance $705,000 Middle Range Variance is future range Typical Home Price (Median) Price will vary by. Never more, Never less.
TheMLS/CLAW (Combined Los Angeles Westside)
For questions, comments, a tailor-made report for your home area, or a complimentary home valuation please contact LeHoa Gacki
$1,252,500 $1,271,000 $1,450,000 $1,500,000 $1,475,000 $1,580,000 $1,732,500 $1,775,000 $1,724,000 $1,850,000 $2,168,750 $2,205,000 $$500,000 $1,000,000 $1,500,000 $2,000,000 $2,500,000 May 01, 2019 to Apr 30, 2020 May 01, 2020 to Apr 30, 2021 May 01, 2021 to Apr 30, 2022 May 01, 2022 to Apr 30, 2023
LeHoa Gacki, DRE #01422855 Douglas Elliman Real Estate 11990 San Vicente Blvd., #100, L.A., Ca 90049 Email: Lehoa.Gacki@elliman.com Tel | Fax: (424) 276-7587 www.Lehoagacki.com | Lehoagacki.elliman.com 4 YEAR OBSERVATION Culver City Number of Homes Sold: 172 185 200 137 May 01, 2019 to Apr 30, 2020 May 01, 2020 to Apr 30, 2021 May 01, 2021 to Apr 30, 2022 May 01, 2022 to Apr 30, 2023 Actual Lowest Sold $750,000 $950,000 $800,000 $845,000 Mid-Low $1,252,500 $1,271,000 $1,450,000 $1,500,000 Typical Home Price-Median $1,475,000 $1,580,000 $1,732,500 $1,775,000 Mid-High $1,724,000 $1,850,000 $2,168,750 $2,205,000 Actual Highest Sold $4,195,000 $3,900,000 $4,350,000 $4,575,000 Average Price Sold $1,541,464 $1,676,455 $1,864,913 $1,861,450 12 MONTH OBSERVATION Culver City Cumulative 12 months sold home analysis from: May 01, 2022 to April 30, 2023 137 Sold Sold Price **Overbid / Underbid Square Feet Price per/SqFt YB LotSqFt BD BA Days on Market Actual Lowest Sold $845,000 100 835 $1,012 1948 2,310 2 1 0 Mid-Low* $1,500,000 97 1,304 $925 1940 4,996 3 2 9 Typical Home Price-Median* $1,775,000 100 1,678 $1,077 1950 5,400 3 2 13 Mid-High* $2,205,000 106 2,073 $1,222 1953 6,172 4 3 26 Actual Highest Sold $4,575,000 115 3,555 $1,287 2021 6,024 4 5 12 Average $1,861,450 102 1,777 $1,086 1954 5,684 3 2 25
© 2022 LEHOA GACKI. DRE# 01422855. ALL WORLDWIDE RIGHTS RESERVED. DOUGLAS ELLIMAN REAL ESTATE. 150 EL CAMINO DRIVE, BEVERLY HILLS, CA 90212. 310.595.3888. ALL MATERIAL PRESENTED HEREIN IS INTENDED FOR INFORMATION PURPOSES ONLY AND NOT INTENDED TO CONSTITUTE PROFESSIONAL ADVICE OR WARRANTY OUTSIDE THE REALM OF REAL ESTATE BROKERAGE. MAPS CREATED FOR REFERENCE PURPOSE ONLY. WHILE THIS INFORMATION IS BELIEVED TO BE CORRECT, IT IS REPRESENTED SUBJECT TO ERRORS, OMISSIONS, CHANGES OR WITHDRAWAL WITHOUT NOTICE. BASED ON DATA SOURCED FROM THE COMBINED LOS ANGELES WESTSIDE MULTIPLE LISTING SERVICE AND PUBLIC RECORDS. STATISTICS ARE SUBJECT TO CHANGE DUE TO INDIVIDUAL REAL ESTATE COMPANY REPORTING DISCIPLINES. BUYER ADVANTAGE OR SELLER ADVANTAGE IS STRICTLY OF THE OPINION OF LEHOA GACKI AND ACCURACY CANNOT BE GUARANTEED AND MAY NOT REFLECT ALL REAL ESTATE ACTIVITY ON THE MARKET. ALL PROPERTY INFORMATION, INCLUDING, BUT NOT LIMITED TO MAPS, GRAPHS, DEPICTIONS, SQUARE FOOTAGE, ROOM COUNT, NUMBER OF BEDROOMS AND THE SCHOOL DISTRICT IN PROPERTY LISTINGS SHOULD BE VERIFIED BY YOUR OWN ATTORNEY, ARCHITECT OR ZONING EXPERT. NEW CONSTRUCTION COUNT, SQUARE FOOTAGE AND YEAR BUILT IS BASED ON INDIVIDUAL REAL ESTATE COMPANY REPORTING AND MAY BE DIFFERENT THAN PUBLIC RECORDS. NEW CONSTRUCTION COUNT IS BASED ON LISTING BROKERAGE LISTING YEAR. THE BROKER/AGENT PROVIDING THE INFORMATION CONTAINED HEREIN MAY OR MAY HAVE NOT BEEN THE LISTING AND/OR SELLING AGENT. THIS IS NOT INTENDED TO SOLICIT PROPERTY ALREADY LISTED. EQUAL HOUSING OPPORTUNITY. NEIGHBORHOOD BOUNDARY SOURCE: PUBLIC RECORDS, COMBINED LOS ANGELES WESTSIDE MULTIPLE LISTING SERVICE AND LOS ANGELES TIMES MAPPING L.A. https://maps.latimes.com/neighborhoods/index.html
CITY
Source:
CULVER
$884 $863 $898 $868 $994 $1,054 $1,130 $1,078 $912 $898 $964 $896 $1,018 $1,066 $1,159 $1,080 $$200 $400 $600 $800 $1,000 $1,200 $1,400 Jan 01 to Jun 30, 2019 Jul 01 to Dec 31, 2019 Jan 01 to Jun 30, 2020 Jul 01 to Dec 31, 2020 Jan 01 to Jun 30, 2021 Jul 01 to Dec 31, 2021 Jan 01 to Jun 30, 2022 Jul 01 to Dec 31, 2022 Median Price Per Square Foot Average Price per SquareFt 21 25 15 15 14 11 11 135 10 15 20 25 30 Jan 01 to Jun 30, 2019 Jul 01 to Dec 31, 2019 Jan 01 to Jun 30, 2020 Jul 01 to Dec 31, 2020 Jan 01 to Jun 30, 2021 Jul 01 to Dec 31, 2021 Jan 01 to Jun 30, 2022 Jul 01 to Dec 31, 2022 Number of Homes Sold 88 97 55 96 120 106 72 75 Days on Market before Sold 1.7 1.6 2.0 2.0 1.2 1.5 0.0 0.5 1.0 1.5 2.0 2.5 Nov 30, 2022 Dec 31, 2022 Jan 31, 2023 Feb 28, 2023 Mar 31, 2023 Apr 30, 2023 Number of months it would take to sell all properties Active for sale if no new listings entered the market. END OF CULVER CITY 6 PAGE REPORT
PER SQUARE FOOT - PRE & POST MAR 2020 PANDEMIC DAYS ON MARKET BEFORE SOLD- PRE & POST MAR 2020 PANDEMIC MONTHS SUPPLY OF INVENTORY - BASED ON LAST FEW MONTHS OF HOME SALES 3 and Under Favors Seller 4-6 = Balanced Market 7 and over Favors Buyer CULVER CITY CULVER CITY CULVER CITY
SOLD HOME PRICE
NEIGHBORING AREAS:
**Overbid/Underbid: 100 is list price paid. Under 100 means sold for less than asking, over 100 sold probably in multiples and over asking.
Note: Square Footage calculation could be more or less (+-) 20% difference. (Based on calculation.)
Single Family Homes April 2023 $1,504,000 TYPICAL HOME PRICE (MEDIAN) $1,069 SOLD PRICE PER SQUARE FOOT 12 DAYS ON MARKET BEFORE SOLD (DOM)
MID-LOW
MID-HIGH For questions, comments, a tailor-made report for your home area, or a complimentary home valuation please contact LeHoa Gacki LeHoa Gacki Douglas Elliman Real Estate DRE #01422855 Lehoa.Gacki@elliman.com www.LeHoaGacki.com 424.276.7587 LeHoa’s Neighborhood Data Charts Los Angeles Real Estate LNDC APRIL 2023 Del
A neighborhood in the City of Los Angeles DEL REY Marina Del Rey Venice Playa Vista Mar Vista Culver City WHAT YOUR MONEY BUYS YOU THIS MONTH CLICK HERE FOR MORE Del Rey Home Analysis from: April 01, 2023 to April 30, 2023 9 Sold Sold Price **Overbid/ Underbid Square Feet Price per/SqFt YB LotSqFt BD BA Days on Market Actual Lowest Sold $1,000,000 100 896 $1,116 1926 4,397 2 1 0 Mid-Low* $1,271,500 99 1,270 $881 1943 4,771 3 2 7 Typical Home Price (Median)* $1,504,000 100 1,784 $1,069 1947 5,018 4 3 12 Mid-High* $2,443,250 102 2,434 $1,107 1963 5,506 5 5 24 Actual Highest Sold $3,300,000 103 3,000 $1,100 2023 5,501 4 5 11 Average $1,815,944 101 1,839 $996 1956 5,236 4 3 22
$1,271,500
$2,443,250
Rey
* Middle Range Variance $1,171,750 Middle Range Variance is future range Typical Home Price (Median) Price will vary by. Never more, Never less. Source: TheMLS/CLAW (Combined Los Angeles Westside)
Area Typical Home Price (Median) Price per/ SqFt Days on Market Mid-Low Mid-High Homes Sold Venice $2,755,000 $1,461 46 $1,800,817 $4,300,000 19 Mar Vista $1,795,000 $1,105 10 $1,544,000 $2,235,000 17 Culver City $1,601,000 $1,190 29 $1,400,000 $1,930,000 7 Playa Vista $2,185,000 $871 14 $1,575,000 $2,795,000 2
Buyer or Seller Advantage by Price Point for Del Rey as of April 30, 2023
Based on last 3 months of homes sales, Del Rey has 2.8 months supply of inventory.
$6,000,000 $10,000,000 $5,000,000 $5,999,999
BUYER ADVANTAGE $4,450,000 $4,999,999 $4,300,000 $4,449,999 $4,150,000 $4,299,999 $4,000,000 $4,149,999
Months supply of Inventory =
4-6 = BALANCED MARKET
3 and under FAVORS SELLER
7 and over FAVORS BUYER
BUYER ADVANTAGE $3,850,000 $3,999,999 $3,700,000 $3,849,999 $3,550,000 $3,699,999 $3,400,000 $3,549,999 $3,250,000 $3,399,999 $3,100,000 $3,249,999 SELLER ADVANTAGE
$2,950,000 $3,099,999 $2,800,000 $2,949,999 SELLER ADVANTAGE $2,650,000 $2,799,999 SELLER ADVANTAGE $2,500,000 $2,649,999 $2,350,000 $2,499,999 SELLER ADVANTAGE $2,200,000 $2,349,999 SELLER ADVANTAGE
BUYER ADVANTAGE $2,050,000 $2,199,999
BUYER ADVANTAGE $1,900,000 $2,049,999 $1,750,000 $1,899,999 SELLER ADVANTAGE
$1,600,000 $1,749,999 SELLER ADVANTAGE $1,450,000 $1,599,999
$1,300,000 $1,449,999
SELLER ADVANTAGE
SELLER ADVANTAGE
$1,150,000 $1,299,999 SELLER ADVANTAGE $1,000,000 $1,149,999 SELLER ADVANTAGE
$750,000 $999,999 SELLER ADVANTAGE
$500,000 $749,999 SELLER ADVANTAGE
HOME PRICE RANGE
View homes below Contact for up to date homes for sale
Del Rey Inventory for New Construction and Resale of Homes as
SELLER
ADVANTAGE SUPPLY & DEMAND For Sale
Under Contract Pending - Closing Soon New Construction New Con DOM Resale Resale DOM Home Price Range Homes Resold 7 5 4 62 19 65 4 1 $500,000 $749,999 1 1 75 $750,000 $999,999 1 2 4 $1,000,000 $1,149,999 1 2 3 8 $1,150,000 $1,299,999 2 2 86 $1,300,000 $1,449,999 3 221 $1,450,000 $1,599,999 1 1 $1,600,000 $1,749,999 1 1 6 $1,750,000 $1,899,999 1 1 146 2 22 $1,900,000 $2,049,999 1 26 $2,050,000 $2,199,999 1 $2,200,000 $2,349,999 2 1 10 1 53 $2,350,000 $2,499,999 $2,500,000 $2,649,999 $2,650,000 $2,799,999 $2,800,000 $2,949,999 $2,950,000 $3,099,999 1 1 45 $3,100,000 $3,249,999 2 45 $3,250,000 $3,399,999 $3,400,000 $3,549,999 $3,550,000 $3,699,999 $3,700,000 $3,849,999 1 11 $3,850,000 $3,999,999 $4,000,000 $4,149,999 $4,150,000 $4,299,999 $4,300,000 $4,449,999 1 117 $4,450,000 $4,999,999 $5,000,000 $5,999,999 $6,000,000 $10,000,000
Source: TheMLS/CLAW (Combined Los Angeles Westside)
REALTORS
of April 30, 2023
Based on last 3 months of homes sales, Bel-Air has 7.9 months supply of inventory.
BUYER / INVESTOR ADVANTAGE
DEMAND
Sold Homes Days on Market Before Sold = DOM February March April Resold DOM New Cons New DOM Homes Resold Resold DOM New Cons New DOM Homes Resold Resold DOM New Cons New DOM 56 2 20 10 60 8 23 1 11 82 1 92 52 1 95 1 0 1 98 6 31 2 18 50 2 115 1 12 1 12 38 2 13 1 11 1 28 1 11
REALTORS DIGEST
4 YEAR TREND
**Overbid / Underbid: 100 is list price paid. Under 100 means sold for less than asking, over 100 sold probably in multiples and over asking.
Note: Square Footage calculation could be more or less (+-) 20% difference. (Based on calculation.)
* Middle Range Variance $460,000 Middle Range Variance is future range Typical Home Price (Median) Price will vary by. Never more, Never less.
For questions, comments, a tailor-made report for your home area, or a complimentary home valuation please contact LeHoa Gacki
$1,096,875 $1,150,000 $1,265,000 $1,315,000 $1,300,000 $1,361,000 $1,500,000 $1,504,000 $1,550,000 $1,735,000 $1,850,000 $1,775,000 $$200,000 $400,000 $600,000 $800,000 $1,000,000 $1,200,000 $1,400,000 $1,600,000 $1,800,000 $2,000,000 May 01, 2019 to Apr 30, 2020 May 01, 2020 to Apr 30, 2021 May 01, 2021 to Apr 30, 2022 May 01, 2022 to Apr 30, 2023 Mid-Low Typical Home Price-Median Mid-High
LeHoa
DRE #01422855 Douglas Elliman Real Estate 11990 San Vicente Blvd., #100, L.A., Ca 90049 Email: Lehoa.Gacki@elliman.com Tel | Fax: (424) 276-7587 www.Lehoagacki.com | Lehoagacki.elliman.com 4 YEAR OBSERVATION Del Rey Number of Homes Sold: 123 139 155 111 May 01, 2019 to Apr 30, 2020 May 01, 2020 to Apr 30, 2021 May 01, 2021 to Apr 30, 2022 May 01, 2022 to Apr 30, 2023 Actual Lowest Sold $570,000 $770,000 $780,000 $700,000 Mid-Low $1,096,875 $1,150,000 $1,265,000 $1,315,000 Typical Home Price-Median $1,300,000 $1,361,000 $1,500,000 $1,504,000 Mid-High $1,550,000 $1,735,000 $1,850,000 $1,775,000 Actual Highest Sold $3,165,000 $2,750,000 $3,750,000 $3,300,000 Average Price Sold $1,362,413 $1,490,641 $1,630,896 $1,603,088 12 MONTH OBSERVATION Del Rey Cumulative 12 months sold home analysis from: May 01, 2022 to April 30, 2023 111 Sold Sold Price **Overbid / Underbid Square Feet Price per/SqFt YB LotSqFt BD BA Days on Market Actual Lowest Sold $700,000 100 896 $781 1948 4,367 2 1 0 Mid-Low* $1,315,000 98 1,192 $861 1947 4,799 3 2 9 Typical Home Price-Median* $1,504,000 100 1,600 $1,019 1950 5,018 3 2 14 Mid-High* $1,775,000 104 1,935 $1,150 1957 5,947 4 3 29 Actual Highest Sold $3,300,000 103 3,000 $1,100 2023 5,501 4 5 11 Average $1,603,088 101 1,629 $1,036 1958 5,514 3 2 25
Gacki,
Source:
© 2022 LEHOA GACKI. DRE# 01422855. ALL WORLDWIDE RIGHTS RESERVED. DOUGLAS ELLIMAN REAL ESTATE. 150 EL CAMINO DRIVE, BEVERLY HILLS, CA 90212. 310.595.3888. ALL MATERIAL PRESENTED HEREIN IS INTENDED FOR INFORMATION PURPOSES ONLY AND NOT INTENDED TO CONSTITUTE PROFESSIONAL ADVICE OR WARRANTY OUTSIDE THE REALM OF REAL ESTATE BROKERAGE. MAPS CREATED FOR REFERENCE PURPOSE ONLY. WHILE THIS INFORMATION IS BELIEVED TO BE CORRECT, IT IS REPRESENTED SUBJECT TO ERRORS, OMISSIONS, CHANGES OR WITHDRAWAL WITHOUT NOTICE. BASED ON DATA SOURCED FROM THE COMBINED LOS ANGELES WESTSIDE MULTIPLE LISTING SERVICE AND PUBLIC RECORDS. STATISTICS ARE SUBJECT TO CHANGE DUE TO INDIVIDUAL REAL ESTATE COMPANY REPORTING DISCIPLINES. BUYER ADVANTAGE OR SELLER ADVANTAGE IS STRICTLY OF THE OPINION OF LEHOA GACKI AND ACCURACY CANNOT BE GUARANTEED AND MAY NOT REFLECT ALL REAL ESTATE ACTIVITY ON THE MARKET. ALL PROPERTY INFORMATION, INCLUDING, BUT NOT LIMITED TO MAPS, GRAPHS, DEPICTIONS, SQUARE FOOTAGE, ROOM COUNT, NUMBER OF BEDROOMS AND THE SCHOOL DISTRICT IN PROPERTY LISTINGS SHOULD BE VERIFIED BY YOUR OWN ATTORNEY, ARCHITECT OR ZONING EXPERT. NEW CONSTRUCTION COUNT, SQUARE FOOTAGE AND YEAR BUILT IS BASED ON INDIVIDUAL REAL ESTATE COMPANY REPORTING AND MAY BE DIFFERENT THAN PUBLIC RECORDS. NEW CONSTRUCTION COUNT IS BASED ON LISTING BROKERAGE LISTING YEAR. THE BROKER/AGENT PROVIDING THE INFORMATION CONTAINED HEREIN MAY OR MAY HAVE NOT BEEN THE LISTING AND/OR SELLING AGENT. THIS IS NOT INTENDED TO SOLICIT PROPERTY ALREADY LISTED. EQUAL HOUSING OPPORTUNITY. NEIGHBORHOOD BOUNDARY SOURCE: PUBLIC RECORDS, COMBINED LOS ANGELES WESTSIDE MULTIPLE LISTING SERVICE AND LOS ANGELES TIMES MAPPING L.A. https://maps.latimes.com/neighborhoods/index.html DEL REY
TheMLS/CLAW (Combined Los Angeles Westside)
$842 $876 $806 $877 $962 $986 $1,040 $1,015 $878 $893 $850 $1,072 $998 $1,004 $1,074 $1,036 $$200 $400 $600 $800 $1,000 $1,200 Jan 01 to Jun 30, 2019 Jul 01 to Dec 31, 2019 Jan 01 to Jun 30, 2020 Jul 01 to Dec 31, 2020 Jan 01 to Jun 30, 2021 Jul 01 to Dec 31, 2021 Jan 01 to Jun 30, 2022 Jul 01 to Dec 31, 2022 Median Price Per Square Foot Average Price per SquareFt 42 23 18 17 13 14 12 145 10 15 20 25 30 35 40 45 Jan 01 to Jun 30, 2019 Jul 01 to Dec 31, 2019 Jan 01 to Jun 30, 2020 Jul 01 to Dec 31, 2020 Jan 01 to Jun 30, 2021 Jul 01 to Dec 31, 2021 Jan 01 to Jun 30, 2022 Jul 01 to Dec 31, 2022 Number of Homes Sold 62 72 39 85 77 89 61 55 Days on Market before Sold 2.8 2.6 2.8 2.7 3.1 2.8 2.3 2.4 2.5 2.6 2.7 2.8 2.9 3.0 3.1 3.2 Nov 30, 2022 Dec 31, 2022 Jan 31, 2023 Feb 28, 2023 Mar 31, 2023 Apr 30, 2023 Number of months it would take to sell all properties Active for sale if no new listings entered the market. END OF DEL REY 6 PAGE REPORT
PER SQUARE FOOT - PRE & POST
PANDEMIC DAYS ON MARKET BEFORE SOLD- PRE & POST MAR 2020 PANDEMIC MONTHS SUPPLY OF INVENTORY - BASED ON LAST FEW MONTHS OF HOME SALES 3 and Under Favors Seller 4-6 = Balanced Market 7 and over Favors Buyer DEL REY DEL REY DEL REY
SOLD HOME PRICE
MAR 2020
NEIGHBORING AREAS:
100 is list price paid. Under 100 means sold for less than asking, over 100 sold probably in multiples and over asking.
Note: Square Footage calculation could be more or less (+-) 20% difference. (Based on calculation.)
For questions, comments, a tailor-made report for your home area, or a complimentary home valuation please contact LeHoa Gacki LeHoa Gacki Douglas Elliman Real Estate DRE #01422855 Lehoa.Gacki@elliman.com www.LeHoaGacki.com 424.276.7587 LeHoa’s Neighborhood Data Charts Los Angeles Real Estate LNDC APRIL 2023 Ladera Heights An unincorporated area in Los Angeles County LADERA HEIGHTS Culver City Baldwin Hills/ Crenshaw Inglewood View parkWindsor Hills Westchester WHAT YOUR MONEY BUYS YOU THIS MONTH CLICK HERE FOR MORE Ladera Heights Home Analysis from: April 01, 2023 to April 30, 2023 3 Sold Sold Price **Overbid/ Underbid Square Feet Price per/SqFt YB LotSqFt BD BA Days on Market Actual Lowest Sold $1,150,000 89 2,554 $450 1951 7,333 5 3 65 Typical Home Price (Median)* $1,515,000 100 2,554 $668 1954 7,370 4 3 21 Actual Highest Sold $1,995,000 100 2,988 $668 1954 8,461 4 3 21 Average $1,553,333 98 2,443 $655 1953 7,721 4 3 32
**Overbid/Underbid:
* Middle Range Variance $845,000 Middle Range Variance is future range Typical Home Price (Median) Price will vary by. Never more, Never less. Source: TheMLS/CLAW (Combined Los Angeles Westside) Single Family Homes April 2023 $1,515,000 TYPICAL HOME PRICE (MEDIAN) $668 SOLD PRICE PER SQUARE FOOT 21 DAYS ON MARKET BEFORE SOLD (DOM) $1,150,000 ACTUAL LOWEST SOLD $1,995,000 ACTUAL HIGHEST SOLD
Area Typical Home Price (Median) Price per/ SqFt Days on Market Mid-Low Mid-High Homes Sold Culver City $1,601,000 $1,190 29 $1,400,000 $1,930,000 7 Park Hills Heights $927,500 $589 18 $660,000 $1,203,750 42 Inglewood $742,000 $582 11 $657,500 $902,500 13 Westchester $1,548,000 $916 13 $1,221,500 $2,200,000 29
Buyer or Seller Advantage by Price Point for Ladera Heights as of April 30, 2023
Months supply of Inventory =
4-6 = BALANCED MARKET
Based on last 3 months of homes sales, Ladera Heights has 3.0 months supply of inventory.
$6,000,000 $10,000,000 $5,000,000 $5,999,999
$4,450,000 $4,999,999 $4,300,000 $4,449,999 $4,150,000 $4,299,999 $4,000,000 $4,149,999 $3,850,000 $3,999,999
$3,700,000 $3,849,999
$3,550,000 $3,699,999
$3,400,000 $3,549,999
$3,250,000 $3,399,999
BUYER ADVANTAGE
$3,100,000 $3,249,999
$2,950,000 $3,099,999
$2,800,000 $2,949,999
BUYER ADVANTAGE $2,650,000 $2,799,999
$2,500,000 $2,649,999
BUYER ADVANTAGE $2,350,000 $2,499,999
3 and under FAVORS SELLER
7 and over FAVORS BUYER
$2,200,000 $2,349,999 SELLER ADVANTAGE $2,050,000 $2,199,999 SELLER ADVANTAGE
$1,900,000 $2,049,999 SELLER ADVANTAGE
$1,750,000 $1,899,999 SELLER ADVANTAGE
$1,600,000 $1,749,999 SELLER ADVANTAGE
$1,450,000 $1,599,999 SELLER ADVANTAGE
$1,300,000 $1,449,999
$1,150,000 $1,299,999 SELLER ADVANTAGE
$1,000,000 $1,149,999
$750,000 $999,999 SELLER ADVANTAGE
$500,000 $749,999
HOME PRICE RANGE
View homes below Contact for up to date homes for sale
Ladera Heights Inventory for New Construction and Resale of Homes
SELLER
For Sale
& DEMAND
ADVANTAGE SUPPLY
Under Contract Pending - Closing Soon New Construction New Con DOM Resale Resale DOM Home Price Range Homes Resold 3 2 7 49 2 $500,000 $749,999 $750,000 $999,999 1 $1,000,000 $1,149,999 $1,150,000 $1,299,999 $1,300,000 $1,449,999 1 1 10 $1,450,000 $1,599,999 $1,600,000 $1,749,999 1 83 $1,750,000 $1,899,999 1 1 2 39 $1,900,000 $2,049,999 1 $2,050,000 $2,199,999 1 1 $2,200,000 $2,349,999 1 88 $2,350,000 $2,499,999 $2,500,000 $2,649,999 1 24 $2,650,000 $2,799,999 $2,800,000 $2,949,999 $2,950,000 $3,099,999 1 60 $3,100,000 $3,249,999 $3,250,000 $3,399,999 $3,400,000 $3,549,999 $3,550,000 $3,699,999 $3,700,000 $3,849,999 $3,850,000 $3,999,999 $4,000,000 $4,149,999 $4,150,000 $4,299,999 $4,300,000 $4,449,999 $4,450,000 $4,999,999 $5,000,000 $5,999,999 $6,000,000 $10,000,000 REALTORS
Source: TheMLS/CLAW (Combined Los Angeles Westside)
Homes as of April 30, 2023
Based on last 3 months of homes sales, Bel-Air has 7.9 months supply of inventory.
BUYER / INVESTOR ADVANTAGE
DEMAND
Sold Homes Days on Market Before Sold = DOM February March April Resold DOM New Cons New DOM Homes Resold Resold DOM New Cons New DOM Homes Resold Resold DOM New Cons New DOM 15 2 4 3 32 7 1 65 1 11 1 7 22 1 0 1 21
REALTORS DIGEST
4 YEAR TREND
**Overbid / Underbid: 100 is list price paid. Under 100 means sold for less than asking, over 100 sold probably in multiples and over asking.
Note: Square Footage calculation could be more or less (+-) 20% difference. (Based on calculation.)
* Middle Range Variance $554,000 Middle Range Variance is future range Typical Home Price (Median) Price will vary by. Never more, Never less.
TheMLS/CLAW (Combined Los Angeles Westside)
For questions, comments, a tailor-made report for your home area, or a complimentary home valuation please contact LeHoa Gacki
$1,156,250 $1,269,250 $1,481,250 $1,350,000 $1,395,000 $1,523,500 $1,677,500 $1,657,500 $1,581,250 $1,733,250 $1,902,250 $1,904,000 $$200,000 $400,000 $600,000 $800,000 $1,000,000 $1,200,000 $1,400,000 $1,600,000 $1,800,000 $2,000,000 May 01, 2019 to Apr 30, 2020 May 01, 2020 to Apr 30, 2021 May 01, 2021 to Apr 30, 2022 May 01, 2022 to Apr 30, 2023 Mid-Low Typical Home Price-Median Mid-High
LeHoa Gacki, DRE #01422855 Douglas Elliman Real Estate 11990 San Vicente Blvd., #100, L.A., Ca 90049 Email: Lehoa.Gacki@elliman.com Tel | Fax: (424) 276-7587 www.Lehoagacki.com | Lehoagacki.elliman.com 4 YEAR OBSERVATION Ladera Heights Number of Homes Sold: 56 44 68 38 May 01, 2019 to Apr 30, 2020 May 01, 2020 to Apr 30, 2021 May 01, 2021 to Apr 30, 2022 May 01, 2022 to Apr 30, 2023 Actual Lowest Sold $835,000 $875,000 $925,000 $850,000 Mid-Low $1,156,250 $1,269,250 $1,481,250 $1,350,000 Typical Home Price-Median $1,395,000 $1,523,500 $1,677,500 $1,657,500 Mid-High $1,581,250 $1,733,250 $1,902,250 $1,904,000 Actual Highest Sold $2,800,000 $2,295,000 $3,300,000 $3,025,000 Average Price Sold $1,400,467 $1,501,614 $1,745,970 $1,686,248 12 MONTH OBSERVATION Ladera Heights Cumulative 12 months sold home analysis from: May 01, 2022 to April 30, 2023 38 Sold Sold Price **Overbid / Underbid Square Feet Price per/SqFt YB LotSqFt BD BA Days on Market Actual Lowest Sold $850,000 89 1,449 $587 1951 7,299 3 2 47 Mid-Low* $1,350,000 96 1,867 $596 1951 7,325 3 3 9 Typical Home Price-Median* $1,657,500 100 2,320 $657 1955 8,669 4 3 15 Mid-High* $1,904,000 105 2,973 $766 1962 9,575 4 3 29 Actual Highest Sold $3,025,000 98 5,821 $520 2004 10,059 6 6 7 Average $1,686,248 101 2,527 $686 1958 8,569 4 3 24
Source:
© 2022 LEHOA GACKI. DRE# 01422855. ALL WORLDWIDE RIGHTS RESERVED. DOUGLAS ELLIMAN REAL ESTATE. 150 EL CAMINO DRIVE, BEVERLY HILLS, CA 90212. 310.595.3888. ALL MATERIAL PRESENTED HEREIN IS INTENDED FOR INFORMATION PURPOSES ONLY AND NOT INTENDED TO CONSTITUTE PROFESSIONAL ADVICE OR WARRANTY OUTSIDE THE REALM OF REAL ESTATE BROKERAGE. MAPS CREATED FOR REFERENCE PURPOSE ONLY. WHILE THIS INFORMATION IS BELIEVED TO BE CORRECT, IT IS REPRESENTED SUBJECT TO ERRORS, OMISSIONS, CHANGES OR WITHDRAWAL WITHOUT NOTICE. BASED ON DATA SOURCED FROM THE COMBINED LOS ANGELES WESTSIDE MULTIPLE LISTING SERVICE AND PUBLIC RECORDS. STATISTICS ARE SUBJECT TO CHANGE DUE TO INDIVIDUAL REAL ESTATE COMPANY REPORTING DISCIPLINES. BUYER ADVANTAGE OR SELLER ADVANTAGE IS STRICTLY OF THE OPINION OF LEHOA GACKI AND ACCURACY CANNOT BE GUARANTEED AND MAY NOT REFLECT ALL REAL ESTATE ACTIVITY ON THE MARKET. ALL PROPERTY INFORMATION, INCLUDING, BUT NOT LIMITED TO MAPS, GRAPHS, DEPICTIONS, SQUARE FOOTAGE, ROOM COUNT, NUMBER OF BEDROOMS AND THE SCHOOL DISTRICT IN PROPERTY LISTINGS SHOULD BE VERIFIED BY YOUR OWN ATTORNEY, ARCHITECT OR ZONING EXPERT. NEW CONSTRUCTION COUNT, SQUARE FOOTAGE AND YEAR BUILT IS BASED ON INDIVIDUAL REAL ESTATE COMPANY REPORTING AND MAY BE DIFFERENT THAN PUBLIC RECORDS. NEW CONSTRUCTION COUNT IS BASED ON LISTING BROKERAGE LISTING YEAR. THE BROKER/AGENT PROVIDING THE INFORMATION CONTAINED HEREIN MAY OR MAY HAVE NOT BEEN THE LISTING AND/OR SELLING AGENT. THIS IS NOT INTENDED TO SOLICIT PROPERTY ALREADY LISTED. EQUAL HOUSING OPPORTUNITY. NEIGHBORHOOD BOUNDARY SOURCE: PUBLIC RECORDS, COMBINED LOS ANGELES WESTSIDE MULTIPLE LISTING SERVICE AND LOS ANGELES TIMES MAPPING L.A. https://maps.latimes.com/neighborhoods/index.html
LADERA HEIGHTS
SOLD HOME PRICE PER SQUARE FOOT - PRE & POST MAR 2020 PANDEMIC
BEFORE SOLD- PRE & POST MAR 2020
$493 $497 $539 $594 $586 $615 $702 $636 $503 $516 $546 $574 $593 $612 $725 $673 $$100 $200 $300 $400 $500 $600 $700 $800 Jan 01 to Jun 30, 2019 Jul 01 to Dec 31, 2019 Jan 01 to Jun 30, 2020 Jul 01 to Dec 31, 2020 Jan 01 to Jun 30, 2021 Jul 01 to Dec 31, 2021 Jan 01 to Jun 30, 2022 Jul 01 to Dec 31, 2022 Median Price Per Square Foot Average Price per SquareFt 32 34 30 12 13 15 11 165 10 15 20 25 30 35 40 Jan 01 to Jun 30, 2019 Jul 01 to Dec 31, 2019 Jan 01 to Jun 30, 2020 Jul 01 to Dec 31, 2020 Jan 01 to Jun 30, 2021 Jul 01 to Dec 31, 2021 Jan 01 to Jun 30, 2022 Jul 01 to Dec 31, 2022 Number of Homes Sold 19 30 18 20 36 32 29 20 Days on Market before Sold 1.6 2.5 3.0 5.3 4.0 3.0 0.0 1.0 2.0 3.0 4.0 5.0 6.0 Nov 30, 2022 Dec 31, 2022 Jan 31, 2023 Feb 28, 2023 Mar 31, 2023 Apr 30, 2023 Number of months it would take to sell all properties Active for sale if no new listings entered the market. END OF LADERA HEIGHTS 6 PAGE REPORT
DAYS
MARKET
PANDEMIC MONTHS SUPPLY OF INVENTORY
MONTHS OF HOME SALES 3 and Under Favors Seller 4-6 = Balanced Market 7 and over Favors Buyer LADERA HEIGHTS LADERA HEIGHTS LADERA HEIGHTS
ON
- BASED ON LAST FEW
For questions, comments, a tailor-made report for your home area, or a complimentary home valuation please contact LeHoa
NEIGHBORING AREAS:
**Overbid/Underbid: 100 is list price paid. Under 100 means sold for less than asking, over 100 sold probably in multiples and over asking.
Note: Square Footage calculation could be more or less (+-) 20% difference. (Based on calculation.)
Single Family Homes April 2023 $1,795,000 TYPICAL HOME PRICE (MEDIAN) $1,105 SOLD PRICE PER SQUARE FOOT 10 DAYS ON MARKET BEFORE SOLD (DOM)
MID-LOW
MID-HIGH MAR VISTA Santa Monica Rancho Park Palms Culver City Venice Del Rey Sawtelle LeHoa’s Neighborhood Data Charts Los Angeles Real Estate LNDC APRIL 2023
$1,544,000
$2,235,000
LeHoa Gacki Douglas Elliman Real Estate DRE #01422855 Lehoa.Gacki@elliman.com www.LeHoaGacki.com 424.276.7587
A neighborhood in the City of Los Angeles WHAT YOUR MONEY BUYS YOU THIS MONTH CLICK HERE FOR MORE Mar Vista Home Analysis from: April 01, 2023 to April 30, 2023 17 Sold Sold Price **Overbid/ Underbid Square Feet Price per/SqFt YB LotSqFt BD BA Days on Market Actual Lowest Sold $750,000 94 762 $984 1953 2,234 2 1 14 Mid-Low* $1,544,000 97 1,337 $910 1947 4,902 3 2 2 Typical Home Price (Median)* $1,795,000 100 1,758 $1,105 1951 5,849 3 3 10 Mid-High* $2,235,000 103 2,380 $1,200 1974 6,312 4 3 16 Actual Highest Sold $3,175,000 99 2,687 $1,182 2023 4,902 4 4 5 Average $1,932,424 100 1,889 $1,062 1963 5,582 3 3 19
Gacki
Mar Vista
Middle Range Variance $691,000 Middle Range Variance is future range Typical Home Price (Median) Price will vary by. Never more, Never less.
TheMLS/CLAW (Combined Los Angeles Westside)
*
Source:
Area Typical Home Price (Median) Price per/ SqFt Days on Market Mid-Low Mid-High Homes Sold Venice $2,755,000 $1,461 46 $1,800,817 $4,300,000 19 Santa Monica $2,700,000 $1,425 8 $2,052,500 $5,495,356 13 Sawtelle $1,719,125 $994 10 $1,225,188 $2,596,875 4 Rancho Park $1,350,000 $1,331 5 $1,350,000 $1,350,000 1 Palms $1,415,000 $898 14 $1,250,000 $2,240,000 5 Culver City $1,601,000 $1,190 29 $1,400,000 $1,930,000 7 Del Rey $1,504,000 $1,069 12 $1,271,500 $2,443,250 9
Buyer or Seller Advantage by Price Point for Mar Vista as of April 30, 2023
Based
Months supply of Inventory =
4-6 = BALANCED MARKET
3 and under FAVORS SELLER
7 and over FAVORS BUYER
HOME PRICE RANGE $7,000,000 $10,000,000 BUYER ADVANTAGE $5,000,000 $6,999,999 BUYER ADVANTAGE $4,450,000 $4,999,999 $4,300,000 $4,449,999 BUYER ADVANTAGE $4,150,000 $4,299,999 $4,000,000 $4,149,999 SELLER ADVANTAGE $3,850,000 $3,999,999 SELLER ADVANTAGE $3,700,000 $3,849,999 SELLER ADVANTAGE $3,550,000 $3,699,999 SELLER ADVANTAGE $3,400,000 $3,549,999 SELLER ADVANTAGE $3,250,000 $3,399,999 SELLER ADVANTAGE $3,100,000 $3,249,999 SELLER ADVANTAGE $2,950,000 $3,099,999 SELLER ADVANTAGE $2,800,000 $2,949,999 SELLER ADVANTAGE BUYER ADVANTAGE $2,650,000 $2,799,999 BUYER ADVANTAGE $2,500,000 $2,649,999 $2,350,000 $2,499,999 SELLER ADVANTAGE $2,200,000 $2,349,999 SELLER ADVANTAGE
$2,050,000 $2,199,999 SELLER ADVANTAGE $1,900,000 $2,049,999 SELLER ADVANTAGE $1,750,000 $1,899,999 SELLER ADVANTAGE $1,600,000 $1,749,999 SELLER ADVANTAGE $1,450,000 $1,599,999 SELLER ADVANTAGE $1,300,000 $1,449,999 SELLER ADVANTAGE $1,150,000 $1,299,999 SELLER ADVANTAGE $1,000,000 $1,149,999 $750,000 $999,999 SELLER ADVANTAGE $500,000 $749,999
on last 3 months of homes sales, Mar Vista has 1.3 months supply of inventory.
View homes below Contact for up to date homes for sale
Mar Vista Inventory for New Construction and Resale of Homes as
SELLER ADVANTAGE SUPPLY & DEMAND For Sale
Under Contract Pending - Closing Soon New Construction New Con DOM Resale Resale DOM Home Price Range Homes Resold 4 5 5 104 15 53 10 $500,000 $749,999 $750,000 $999,999 $1,000,000 $1,149,999 1 $1,150,000 $1,299,999 $1,300,000 $1,449,999 3 1 1 152 $1,450,000 $1,599,999 $1,600,000 $1,749,999 1 1 2 23 $1,750,000 $1,899,999 2 1 2 11 $1,900,000 $2,049,999 2 1 2 194 $2,050,000 $2,199,999 1 2 12 $2,200,000 $2,349,999 2 1 $2,350,000 $2,499,999 1 2 19 $2,500,000 $2,649,999 1 4 $2,650,000 $2,799,999 1 11 $2,800,000 $2,949,999 1 6 $2,950,000 $3,099,999 $3,100,000 $3,249,999 1 18 $3,250,000 $3,399,999 $3,400,000 $3,549,999 1 41 $3,550,000 $3,699,999 $3,700,000 $3,849,999 1 1 40 $3,850,000 $3,999,999 $4,000,000 $4,149,999 1 360 $4,150,000 $4,299,999 $4,300,000 $4,449,999 1 74 $4,450,000 $4,999,999 1 94 $5,000,000 $6,999,999 $7,000,000 $10,000,000
Source: TheMLS/CLAW (Combined Los Angeles Westside)
REALTORS
as of April 30, 2023
Based on last 3 months of homes sales, Bel-Air has 7.9 months supply of inventory.
BUYER / INVESTOR ADVANTAGE
DEMAND
Sold Homes Days on Market Before Sold = DOM February March April Resold DOM New Cons New DOM Homes Resold Resold DOM New Cons New DOM Homes Resold Resold DOM New Cons New DOM 16 3 47 13 35 2 20 15 20 2 8 1 14 1 112 13 2 24 1 0 3 40 1 8 3 5 8 1 27 2 0 39 3 83 1 7 6 1 6 1 12 2 14 22 1 32 1 22 1 10 1 61 1 4 1 5 1 33 1 7 1 17 0 1 13 1 8 1 99 REALTORS
DIGEST
4 YEAR TREND
**Overbid / Underbid: 100 is list price paid. Under 100 means sold for less than asking, over 100 sold probably in multiples and over asking.
Note: Square Footage calculation could be more or less (+-) 20% difference. (Based on calculation.)
* Middle Range Variance $1,175,600 Middle Range Variance is future range Typical Home Price (Median) Price will vary by. Never more, Never less.
TheMLS/CLAW (Combined Los Angeles Westside)
For questions, comments, a tailor-made report for your home area, or a complimentary home valuation please contact LeHoa Gacki
$1,465,000 $1,625,000 $1,630,500 $1,625,000 $1,765,000 $1,960,000 $2,020,000 $1,990,000 $2,450,000 $2,637,500 $2,695,000 $2,800,600 $$500,000 $1,000,000 $1,500,000 $2,000,000 $2,500,000 $3,000,000 May 01, 2019 to Apr 30, 2020 May 01, 2020 to Apr 30, 2021 May 01, 2021 to Apr 30, 2022 May 01, 2022 to Apr 30, 2023 Mid-Low Typical Home Price-Median Mid-High
LeHoa Gacki, DRE #01422855 Douglas Elliman Real Estate 11990 San Vicente Blvd., #100, L.A., Ca 90049 Email: Lehoa.Gacki@elliman.com Tel | Fax: (424) 276-7587 www.Lehoagacki.com | Lehoagacki.elliman.com 4 YEAR OBSERVATION Mar Vista Number of Homes Sold: 198 237 245 177 May 01, 2019 to Apr 30, 2020 May 01, 2020 to Apr 30, 2021 May 01, 2021 to Apr 30, 2022 May 01, 2022 to Apr 30, 2023 Actual Lowest Sold $749,950 $989,000 $820,000 $750,000 Mid-Low $1,465,000 $1,625,000 $1,630,500 $1,625,000 Typical Home Price-Median $1,765,000 $1,960,000 $2,020,000 $1,990,000 Mid-High $2,450,000 $2,637,500 $2,695,000 $2,800,600 Actual Highest Sold $4,995,000 $5,995,000 $5,400,000 $6,500,000 Average Price Sold $2,027,014 $2,178,355 $2,293,338 $2,327,427 12 MONTH OBSERVATION Mar Vista Cumulative 12 months sold home analysis from: May 01, 2022 to April 30, 2023 177 Sold Sold Price **Overbid / Underbid Square Feet Price per/SqFt YB LotSqFt BD BA Days on Market Actual Lowest Sold $750,000 94 762 $984 1953 2,234 2 1 14 Mid-Low* $1,625,000 97 1,333 $976 1947 5,403 3 2 7 Typical Home Price-Median* $1,990,000 100 1,758 $1,123 1949 5,942 3 3 12 Mid-High* $2,800,600 107 2,550 $1,250 1955 6,861 4 4 27 Actual Highest Sold $6,500,000 100 - $0 2022 11,341 7 8 19 Average $2,327,427 102 2,070 $1,149 1962 6,323 3 3 22
Source:
© 2022 LEHOA GACKI. DRE# 01422855. ALL WORLDWIDE RIGHTS RESERVED. DOUGLAS ELLIMAN REAL ESTATE. 150 EL CAMINO DRIVE, BEVERLY HILLS, CA 90212. 310.595.3888. ALL MATERIAL PRESENTED HEREIN IS INTENDED FOR INFORMATION PURPOSES ONLY AND NOT INTENDED TO CONSTITUTE PROFESSIONAL ADVICE OR WARRANTY OUTSIDE THE REALM OF REAL ESTATE BROKERAGE. MAPS CREATED FOR REFERENCE PURPOSE ONLY. WHILE THIS INFORMATION IS BELIEVED TO BE CORRECT, IT IS REPRESENTED SUBJECT TO ERRORS, OMISSIONS, CHANGES OR WITHDRAWAL WITHOUT NOTICE. BASED ON DATA SOURCED FROM THE COMBINED LOS ANGELES WESTSIDE MULTIPLE LISTING SERVICE AND PUBLIC RECORDS. STATISTICS ARE SUBJECT TO CHANGE DUE TO INDIVIDUAL REAL ESTATE COMPANY REPORTING DISCIPLINES. BUYER ADVANTAGE OR SELLER ADVANTAGE IS STRICTLY OF THE OPINION OF LEHOA GACKI AND ACCURACY CANNOT BE GUARANTEED AND MAY NOT REFLECT ALL REAL ESTATE ACTIVITY ON THE MARKET. ALL PROPERTY INFORMATION, INCLUDING, BUT NOT LIMITED TO MAPS, GRAPHS, DEPICTIONS, SQUARE FOOTAGE, ROOM COUNT, NUMBER OF BEDROOMS AND THE SCHOOL DISTRICT IN PROPERTY LISTINGS SHOULD BE VERIFIED BY YOUR OWN ATTORNEY, ARCHITECT OR ZONING EXPERT. NEW CONSTRUCTION COUNT, SQUARE FOOTAGE AND YEAR BUILT IS BASED ON INDIVIDUAL REAL ESTATE COMPANY REPORTING AND MAY BE DIFFERENT THAN PUBLIC RECORDS. NEW CONSTRUCTION COUNT IS BASED ON LISTING BROKERAGE LISTING YEAR. THE BROKER/AGENT PROVIDING THE INFORMATION CONTAINED HEREIN MAY OR MAY HAVE NOT BEEN THE LISTING AND/OR SELLING AGENT. THIS IS NOT INTENDED TO SOLICIT PROPERTY ALREADY LISTED. EQUAL HOUSING OPPORTUNITY. NEIGHBORHOOD BOUNDARY SOURCE: PUBLIC RECORDS, COMBINED LOS ANGELES WESTSIDE MULTIPLE LISTING SERVICE AND LOS ANGELES TIMES MAPPING L.A. https://maps.latimes.com/neighborhoods/index.html MAR VISTA
$863 $904 $945 $952 $983 $1,062 $1,138 $1,123 $903 $933 $972 $998 $1,038 $1,070 $1,168 $1,157 $$200 $400 $600 $800 $1,000 $1,200 $1,400 Jan 01 to Jun 30, 2019 Jul 01 to Dec 31, 2019 Jan 01 to Jun 30, 2020 Jul 01 to Dec 31, 2020 Jan 01 to Jun 30, 2021 Jul 01 to Dec 31, 2021 Jan 01 to Jun 30, 2022 Jul 01 to Dec 31, 2022 Median Price Per Square Foot Average Price per SquareFt 31 19 8 15 15 12 10 165 10 15 20 25 30 35 Jan 01 to Jun 30, 2019 Jul 01 to Dec 31, 2019 Jan 01 to Jun 30, 2020 Jul 01 to Dec 31, 2020 Jan 01 to Jun 30, 2021 Jul 01 to Dec 31, 2021 Jan 01 to Jun 30, 2022 Jul 01 to Dec 31, 2022 Number of Homes Sold 111 114 75 128 119 150 95 83 Days on Market before Sold 2.4 1.2 1.8 1.7 1.3 1.3 0.0 0.5 1.0 1.5 2.0 2.5 Nov 30, 2022 Dec 31, 2022 Jan 31, 2023 Feb 28, 2023 Mar 31, 2023 Apr 30, 2023 Number of months it would take to sell all properties Active for sale if no new listings entered the market. END OF MAR VISTA 6 PAGE REPORT
PRICE PER SQUARE FOOT - PRE & POST MAR 2020 PANDEMIC DAYS ON MARKET BEFORE SOLD- PRE & POST MAR 2020 PANDEMIC MONTHS SUPPLY OF INVENTORY - BASED ON LAST FEW MONTHS OF HOME SALES 3 and Under Favors Seller 4-6 = Balanced Market 7 and over Favors Buyer MAR VISTA MAR VISTA MAR VISTA
SOLD HOME
NEIGHBORING AREAS:
**Overbid/Underbid: 100 is list price paid. Under 100 means sold for less than asking, over 100 sold probably in multiples and over asking. Note:
Footage calculation could be more or less (+-) 20% difference. (Based on calculation.)
Single Family Homes April 2023 $3,900,000 TYPICAL HOME PRICE (MEDIAN) $1,389 SOLD PRICE PER SQUARE FOOT 30 DAYS ON MARKET BEFORE SOLD (DOM)
For questions, comments, a tailor-made report for your home area, or a complimentary home valuation please contact LeHoa Gacki LeHoa Gacki Douglas Elliman Real Estate DRE #01422855 Lehoa.Gacki@elliman.com www.LeHoaGacki.com 424.276.7587 LeHoa’s Neighborhood Data Charts Los Angeles Real Estate LNDC APRIL 2023
A neighborhood in the City of Los Angeles PACIFIC PALISADES Brentwood Topanga Santa Monica Malibu WHAT YOUR MONEY BUYS YOU THIS MONTH CLICK HERE FOR MORE Pacific Palisades Home Analysis from: April 01, 2023 to April 30, 2023 15 Sold Sold Price **Overbid/ Underbid Square Feet Price per/SqFt YB LotSqFt BD BA Days on Market Actual Lowest Sold $2,150,000 100 2,336 $920 1956 10,371 3 2 0 Mid-Low* $2,580,000 97 2,111 $920 1956 10,614 3 3 7 Typical Home Price (Median)* $3,900,000 99 2,416 $1,389 1960 13,700 4 3 30 Mid-High* $4,950,000 100 3,454 $1,648 1996 16,180 5 5 105 Actual Highest Sold $16,199,000 100 7,607 $2,129 2018 36,299 5 6 1 Average $4,890,033 102 3,349 $1,496 1971 23,293 4 4 48
$2,580,000 MID-LOW $4,950,000 MID-HIGH
Pacific Palisades
* Middle Range Variance $2,370,000 Middle Range Variance is future range Typical Home Price (Median) Price will vary by. Never more, Never less. Source: TheMLS/CLAW (Combined Los Angeles Westside)
Square
Area Typical Home Price (Median) Price per/ SqFt Days on Market Mid-Low Mid-High Homes Sold Malibu $4,425,000 $1,597 24 $3,170,000 $7,796,206 18 Topanga $2,000,000 $1,131 7 $1,530,000 $2,480,000 7 Brentwood $3,377,500 $1,313 18 $2,555,875 $4,912,499 12 Santa Monica $2,700,000 $1,425 8 $2,052,500 $5,495,356 13
Buyer or Seller Advantage by Price Point for Pacific Palisades as of April 30, 2023
Months supply of Inventory =
4-6 = BALANCED MARKET
3 and under FAVORS SELLER
7 and over FAVORS BUYER
SELLER ADVANTAGE $5,000,000 $5,499,999 SELLER ADVANTAGE $4,500,000 $4,999,999 SELLER ADVANTAGE $4,000,000 $4,499,999 SELLER ADVANTAGE $3,500,000 $3,999,999 SELLER ADVANTAGE $3,000,000 $3,499,999 SELLER ADVANTAGE
$2,500,000 $2,999,999 SELLER ADVANTAGE $2,000,000 $2,499,999
$1,500,000 $1,999,999 SELLER ADVANTAGE $1,000,000 $1,499,999
HOME PRICE RANGE $80,000,000 $100,000,000 $70,000,000 $79,999,999 BUYER ADVANTAGE $60,000,000 $69,999,999 $50,000,000 $59,999,999 BUYER ADVANTAGE $40,000,000 $49,999,999 BUYER ADVANTAGE $30,000,000 $39,999,999 BUYER ADVANTAGE $25,000,000 $29,999,999 BUYER ADVANTAGE $20,000,000 $24,999,999 $17,500,000 $19,999,999 SELLER ADVANTAGE $15,000,000 $17,499,999 SELLER ADVANTAGE BUYER ADVANTAGE $13,500,000 $14,999,999 BUYER ADVANTAGE $12,000,000 $13,499,999 BUYER ADVANTAGE $10,000,000 $11,999,999 $9,000,000 $9,999,999 SELLER ADVANTAGE $8,000,000 $8,999,999 SELLER ADVANTAGE $7,000,000 $7,999,999 SELLER ADVANTAGE $6,500,000 $6,999,999 SELLER ADVANTAGE $6,000,000 $6,499,999 SELLER ADVANTAGE $5,500,000 $5,999,999
Based on last 3 months of homes sales, Pacific Palisades has 3.2 months supply of inventory.
View homes below Contact for up to date homes for sale
Pacific Palisades Inventory for New Construction and Resale of Homes
SELLER
DEMAND
Under Contract Pending - Closing Soon New Construction New Con DOM Resale Resale DOM Home Price Range Homes Resold 6 13 11 74 59 77 13 $1,000,000 $1,499,999 1 1 52 $1,500,000 $1,999,999 2 30 $2,000,000 $2,499,999 5 5 32 $2,500,000 $2,999,999 3 2 6 64 $3,000,000 $3,499,999 2 1 2 4 36 $3,500,000 $3,999,999 2 1 1 4 49 $4,000,000 $4,499,999 4 64 $4,500,000 $4,999,999 1 1 3 38 $5,000,000 $5,499,999 1 1 90 1 77 $5,500,000 $5,999,999 4 3 50 $6,000,000 $6,499,999 1 1 50 $6,500,000 $6,999,999 3 54 $7,000,000 $7,999,999 1 1 2 18 3 76 $8,000,000 $8,999,999 1 48 $9,000,000 $9,999,999 1 2 88 5 112 $10,000,000 $11,999,999 1 2 66 3 34 $12,000,000 $13,499,999 1 101 1 17 $13,500,000 $14,999,999 $15,000,000 $17,499,999 1 82 $17,500,000 $19,999,999 2 132 3 327 $20,000,000 $24,999,999 2 288 $25,000,000 $29,999,999 1 18 1 61 $30,000,000 $39,999,999 1 7 $40,000,000 $49,999,999 $50,000,000 $59,999,999 1 63 $60,000,000 $69,999,999 $70,000,000 $79,999,999 $80,000,000 $100,000,000 REALTORS
ADVANTAGE SUPPLY &
For Sale Source: TheMLS/CLAW (Combined Los Angeles Westside)
Homes as of April 30, 2023
Based on last 3 months of homes sales, Bel-Air has 7.9 months supply of inventory.
BUYER / INVESTOR ADVANTAGE
DEMAND
Sold Homes Days on Market Before Sold = DOM February March April Resold DOM New Cons New DOM Homes Resold Resold DOM New Cons New DOM Homes Resold Resold DOM New Cons New DOM 16 2 15 32 20 3 7 15 48 1 0 5 40 3 65 7 1 20 2 97 8 2 10 3 47 0 3 10 1 30 4 12 9 1 20 3 3 109 1 9 2 11 1 21 1 136 1 0 6 2 43 1 0 4 29 0 3 16 1 1 1 0 32 2 33 1 1 1 0 1 0 REALTORS
DIGEST
For questions, comments, a tailor-made report for your home area, or a complimentary home valuation please contact LeHoa Gacki

4 YEAR TREND
$2,275,000 $2,500,000 $3,073,750 $3,429,375 $3,145,000 $3,393,750 $4,150,000 $4,843,500 $4,787,500 $5,262,500 $6,453,500 $6,631,875 $$1,000,000 $2,000,000 $3,000,000 $4,000,000 $5,000,000 $6,000,000 $7,000,000 May 01, 2019 to Apr 30, 2020 May 01, 2020 to Apr 30, 2021 May 01, 2021 to Apr 30, 2022 May 01, 2022 to Apr 30, 2023 Mid-Low Typical Home Price-Median Mid-High
LeHoa Gacki, DRE #01422855 Douglas Elliman Real Estate 11990 San Vicente Blvd., #100, L.A., Ca 90049 Email: Lehoa.Gacki@elliman.com Tel | Fax: (424) 276-7587 www.Lehoagacki.com | Lehoagacki.elliman.com 4 YEAR OBSERVATION Pacific Palisades Number of Homes Sold: 217 337 340 216 May 01, 2019 to Apr 30, 2020 May 01, 2020 to Apr 30, 2021 May 01, 2021 to Apr 30, 2022 May 01, 2022 to Apr 30, 2023 Actual Lowest Sold $1,415,000 $1,450,000 $1,025,000 $1,787,500 Mid-Low $2,275,000 $2,500,000 $3,073,750 $3,429,375 Typical Home Price-Median $3,145,000 $3,393,750 $4,150,000 $4,843,500 Mid-High $4,787,500 $5,262,500 $6,453,500 $6,631,875 Actual Highest Sold $21,000,000 $25,150,000 $33,946,945 $51,000,000 Average Price Sold $3,935,716 $4,350,742 $5,441,412 $6,049,957 12 MONTH
Pacific Palisades Cumulative 12 months sold home analysis from: May 01, 2022 to April 30, 2023 216 Sold Sold Price **Overbid / Underbid Square Feet Price per/SqFt YB LotSqFt BD BA Days on Market Actual Lowest Sold $1,787,500 94 1,006 $1,777 1951 2,879 2 2 40 Mid-Low* $3,429,375 96 2,408 $1,170 1950 7,243 3 3 8 Typical Home Price-Median* $4,843,500 100 3,353 $1,434 1960 10,601 4 4 14 Mid-High* $6,631,875 104 4,594 $1,874 1996 16,746 5 6 37 Actual Highest Sold $51,000,000 89 - $0 0 132,261 10 14 50 Average $6,049,957 101 3,904 $1,588 1971 16,986 4 4 32 **Overbid / Underbid: 100 is list price paid. Under 100 means sold for less than asking, over 100 sold probably in multiples and over asking.
Middle
Typical Home Price
by. Never more, Never less. Source: TheMLS/CLAW (Combined Los Angeles Westside) © 2022 LEHOA GACKI. DRE# 01422855. ALL WORLDWIDE RIGHTS RESERVED. DOUGLAS ELLIMAN REAL ESTATE. 150 EL CAMINO DRIVE, BEVERLY HILLS, CA 90212. 310.595.3888. ALL MATERIAL PRESENTED HEREIN IS INTENDED FOR INFORMATION PURPOSES ONLY AND NOT INTENDED TO CONSTITUTE PROFESSIONAL ADVICE OR WARRANTY OUTSIDE THE REALM OF REAL ESTATE BROKERAGE. MAPS CREATED FOR REFERENCE PURPOSE ONLY. WHILE THIS INFORMATION IS BELIEVED TO BE CORRECT, IT IS REPRESENTED SUBJECT TO ERRORS, OMISSIONS, CHANGES OR WITHDRAWAL WITHOUT NOTICE. BASED ON DATA SOURCED FROM THE COMBINED LOS ANGELES WESTSIDE MULTIPLE LISTING SERVICE AND PUBLIC RECORDS. STATISTICS ARE SUBJECT TO CHANGE DUE TO INDIVIDUAL REAL ESTATE COMPANY REPORTING DISCIPLINES. BUYER ADVANTAGE OR SELLER ADVANTAGE IS STRICTLY OF THE OPINION OF LEHOA GACKI AND ACCURACY CANNOT BE GUARANTEED AND MAY NOT REFLECT ALL REAL ESTATE ACTIVITY ON THE MARKET. ALL PROPERTY INFORMATION, INCLUDING, BUT NOT LIMITED TO MAPS, GRAPHS, DEPICTIONS, SQUARE FOOTAGE, ROOM COUNT, NUMBER OF BEDROOMS AND THE SCHOOL DISTRICT IN PROPERTY LISTINGS SHOULD BE VERIFIED BY YOUR OWN ATTORNEY, ARCHITECT OR ZONING EXPERT. NEW CONSTRUCTION COUNT, SQUARE FOOTAGE AND YEAR BUILT IS BASED ON INDIVIDUAL REAL ESTATE COMPANY REPORTING AND MAY BE DIFFERENT THAN PUBLIC RECORDS. NEW CONSTRUCTION COUNT IS BASED ON LISTING BROKERAGE LISTING YEAR. THE BROKER/AGENT PROVIDING THE INFORMATION CONTAINED HEREIN MAY OR MAY HAVE NOT BEEN THE LISTING AND/OR SELLING AGENT. THIS IS NOT INTENDED TO SOLICIT PROPERTY ALREADY LISTED. EQUAL HOUSING OPPORTUNITY. NEIGHBORHOOD BOUNDARY SOURCE: PUBLIC RECORDS, COMBINED LOS ANGELES WESTSIDE MULTIPLE LISTING SERVICE AND LOS ANGELES TIMES MAPPING L.A. https://maps.latimes.com/neighborhoods/index.html
OBSERVATION
Note: Square Footage calculation could be more or less (+-) 20% difference. (Based on calculation.) * Middle Range Variance $3,202,500
Range Variance is future range
(Median) Price will vary
PACIFIC PALISADES
$1,097 $1,079 $1,018 $1,113 $1,129 $1,226 $1,513 $1,347 $1,190 $1,123 $1,114 $1,189 $1,240 $1,292 $1,644 $1,440 $$200 $400 $600 $800 $1,000 $1,200 $1,400 $1,600 $1,800 Jan 01 to Jun 30, 2019 Jul 01 to Dec 31, 2019 Jan 01 to Jun 30, 2020 Jul 01 to Dec 31, 2020 Jan 01 to Jun 30, 2021 Jul 01 to Dec 31, 2021 Jan 01 to Jun 30, 2022 Jul 01 to Dec 31, 2022 Median Price Per Square Foot Average Price per SquareFt 26 39 34 27 25 22 15 175 10 15 20 25 30 35 40 45 Jan 01 to Jun 30, 2019 Jul 01 to Dec 31, 2019 Jan 01 to Jun 30, 2020 Jul 01 to Dec 31, 2020 Jan 01 to Jun 30, 2021 Jul 01 to Dec 31, 2021 Jan 01 to Jun 30, 2022 Jul 01 to Dec 31, 2022 Number of Homes Sold 80 131 82 173 201 182 128 103 Days on Market before Sold 3.5 2.5 5.6 5.9 3.5 3.3 0.0 1.0 2.0 3.0 4.0 5.0 6.0 7.0 Nov 30, 2022 Dec 31, 2022 Jan 31, 2023 Feb 28, 2023 Mar 31, 2023 Apr 30, 2023 Number of months it would take to sell all properties Active for sale if no new listings entered the market. END OF PACIFIC PALISADES 6 PAGE REPORT SOLD HOME PRICE PER SQUARE FOOT - PRE & POST MAR 2020 PANDEMIC DAYS ON MARKET BEFORE SOLD- PRE & POST MAR 2020 PANDEMIC MONTHS SUPPLY OF INVENTORY - BASED ON LAST FEW MONTHS OF HOME SALES 3 and Under Favors Seller 4-6 = Balanced Market 7 and over Favors Buyer PACIFIC PALISADES PACIFIC PALISADES PACIFIC PALISADES
NEIGHBORING AREAS:
**Overbid/Underbid: 100 is list price paid. Under 100 means sold for less than asking, over 100 sold probably in multiples and over asking.
Note: Square Footage calculation could be more or less (+-) 20% difference. (Based on calculation.)
* Middle Range Variance $990,000 Middle Range Variance is future range Typical Home Price (Median) Price will vary by. Never more, Never less.
Source: TheMLS/CLAW (Combined Los Angeles Westside)
LeHoa’s Neighborhood Data Charts Los Angeles Real Estate LNDC APRIL 2023 For questions, comments, a tailor-made report for your home area, or a complimentary home valuation please contact LeHoa Gacki LeHoa Gacki Douglas Elliman Real Estate DRE #01422855 Lehoa.Gacki@elliman.com www.LeHoaGacki.com 424.276.7587 Palms A neighborhood in the City of Los Angeles PALMS Rancho Park Cheviot Hills Beverlywood Culver City Mar Vista Mid-City WHAT YOUR MONEY BUYS YOU THIS MONTH CLICK HERE FOR MORE Palms Home Analysis from: April 01, 2023 to April 30, 2023 5 Sold Sold Price **Overbid/ Underbid Square Feet Price per/SqFt YB LotSqFt BD BA Days on Market Actual Lowest Sold $1,150,000 96 1,535 $749 1951 4,998 3 2 7 Mid-Low* $1,250,000 96 1,461 $776 1936 5,099 3 2 8 Typical Home Price (Median)* $1,415,000 100 1,535 $898 1948 5,453 3 2 14 Mid-High* $2,240,000 102 2,548 $964 1951 5,655 5 5 22 Actual Highest Sold $2,855,000 102 3,070 $930 1948 5,809 5 5 14 Average $1,679,000 99 1,911 $875 1944 5,392 4 3 14
April
$1,415,000 TYPICAL HOME PRICE (MEDIAN) $898 SOLD PRICE PER SQUARE FOOT 14 DAYS ON MARKET BEFORE SOLD (DOM) $1,250,000 ACTUAL
SOLD $2,240,000 ACTUAL
SOLD
Single Family Homes
2023
LOWEST
HIGHEST
Area Typical Home Price (Median) Price per/ SqFt Days on Market Mid-Low Mid-High Homes Sold Mar Vista $1,795,000 $1,105 10 $1,544,000 $2,235,000 17 Rancho Park $1,350,000 $1,331 5 $1,350,000 $1,350,000 1 Cheviot Hills $2,962,500 $1,283 4 $2,317,500 $4,532,500 0 Beverlywood $2,672,026 $985 28 $1,595,000 $4,500,000 3 Mid-City $1,210,000 $850 50 $1,050,000 $1,412,000 11 Culver City $1,601,000 $1,190 29 $1,400,000 $1,930,000 7
Buyer or Seller Advantage by Price Point for Palms as of April 30, 2023
Based on last 3 months of homes sales, Palms has 1.4 months supply of inventory.
$6,000,000 $10,000,000 $5,000,000 $5,999,999
$4,450,000 $4,999,999
$4,300,000 $4,449,999 $4,150,000 $4,299,999 $4,000,000 $4,149,999
$3,850,000 $3,999,999
$3,700,000 $3,849,999
$3,550,000 $3,699,999
$3,400,000 $3,549,999
$3,250,000 $3,399,999
$3,100,000 $3,249,999
$2,950,000 $3,099,999
Months supply of Inventory =
4-6 = BALANCED MARKET
3 and under FAVORS SELLER
7 and over FAVORS BUYER
$2,800,000 $2,949,999 SELLER ADVANTAGE
$2,650,000 $2,799,999 SELLER ADVANTAGE
$2,500,000 $2,649,999
$2,350,000 $2,499,999
$2,200,000 $2,349,999 SELLER ADVANTAGE
$2,050,000 $2,199,999 $1,900,000 $2,049,999 SELLER ADVANTAGE
$1,750,000 $1,899,999 SELLER ADVANTAGE
$1,600,000 $1,749,999 SELLER ADVANTAGE
$1,450,000 $1,599,999 SELLER ADVANTAGE
$1,300,000 $1,449,999 SELLER ADVANTAGE
$1,150,000 $1,299,999 SELLER ADVANTAGE
$1,000,000 $1,149,999 SELLER ADVANTAGE
$750,000 $999,999
$500,000 $749,999
HOME PRICE RANGE
View homes below Contact for up to date homes for sale
Palms Inventory for New Construction and Resale of Homes as of SELLER ADVANTAGE
SUPPLY & DEMAND
TheMLS/CLAW (Combined Los Angeles Westside) Under Contract Pending - Closing Soon New Construction New Con DOM Resale Resale DOM Home Price Range Homes Resold 3 2 5 30 2 $500,000 $749,999 $750,000 $999,999 $1,000,000 $1,149,999 1 31 $1,150,000 $1,299,999 1 $1,300,000 $1,449,999 1 1 1 4 $1,450,000 $1,599,999 1 1 93 $1,600,000 $1,749,999 1 1 1 $1,750,000 $1,899,999 $1,900,000 $2,049,999 1 $2,050,000 $2,199,999 1 1 19 $2,200,000 $2,349,999 $2,350,000 $2,499,999 $2,500,000 $2,649,999 $2,650,000 $2,799,999 $2,800,000 $2,949,999 $2,950,000 $3,099,999 $3,100,000 $3,249,999 $3,250,000 $3,399,999 $3,400,000 $3,549,999 $3,550,000 $3,699,999 $3,700,000 $3,849,999 $3,850,000 $3,999,999 $4,000,000 $4,149,999 $4,150,000 $4,299,999 $4,300,000 $4,449,999 $4,450,000 $4,999,999 $5,000,000 $5,999,999 $6,000,000 $10,000,000
For Sale Source:
REALTORS
Based on last 3 months of homes sales, Bel-Air has 7.9 months supply of inventory.
BUYER / INVESTOR ADVANTAGE
of April
30, 2023 DEMAND
Sold Homes Days on Market Before Sold = DOM February March April Resold DOM New Cons New DOM Homes Resold Resold DOM New Cons New DOM Homes Resold Resold DOM New Cons New DOM 23 4 61 5 14 2 89 1 7 2 12 0 1 3 1 27 46 1 63 1 14
REALTORS DIGEST
4 YEAR TREND
Mid-Low Typical Home Price-Median Mid-High
**Overbid / Underbid: 100 is list price paid. Under 100 means sold for less than asking, over 100 sold probably in multiples and over asking.
Note: Square Footage calculation could be more or less (+-) 20% difference. (Based on calculation.)
* Middle Range Variance $742,000 Middle Range Variance is future range Typical Home Price (Median) Price will vary by. Never more, Never less.
TheMLS/CLAW (Combined Los Angeles Westside)
For questions, comments, a tailor-made report for your home area, or a complimentary home valuation please contact LeHoa Gacki
$1,160,000 $1,228,500 $1,375,000 $1,358,000 $1,340,000 $1,475,000 $1,625,000 $1,650,000 $1,549,000 $1,822,500 $1,900,000 $2,100,000 $$500,000 $1,000,000 $1,500,000 $2,000,000 $2,500,000 May 01, 2019 to Apr 30, 2020 May 01, 2020 to Apr 30, 2021 May 01, 2021 to Apr 30, 2022 May 01, 2022 to Apr 30, 2023
LeHoa Gacki, DRE #01422855 Douglas Elliman Real Estate 11990 San Vicente Blvd., #100, L.A., Ca 90049 Email: Lehoa.Gacki@elliman.com Tel | Fax: (424) 276-7587 www.Lehoagacki.com | Lehoagacki.elliman.com 4 YEAR OBSERVATION Palms Number of Homes Sold: 51 65 67 39 May 01, 2019 to Apr 30, 2020 May 01, 2020 to Apr 30, 2021 May 01, 2021 to Apr 30, 2022 May 01, 2022 to Apr 30, 2023 Actual Lowest Sold $725,000 $775,000 $590,000 $604,250 Mid-Low $1,160,000 $1,228,500 $1,375,000 $1,358,000 Typical Home Price-Median $1,340,000 $1,475,000 $1,625,000 $1,650,000 Mid-High $1,549,000 $1,822,500 $1,900,000 $2,100,000 Actual Highest Sold $2,802,000 $3,075,000 $3,550,000 $3,650,000 Average Price Sold $1,451,167 $1,562,573 $1,707,588 $1,772,536 12 MONTH OBSERVATION Palms Cumulative 12 months sold home analysis from: May 01, 2022 to April 30, 2023 39 Sold Sold Price **Overbid / Underbid Square Feet Price per/SqFt YB LotSqFt BD BA Days on Market Actual Lowest Sold $604,250 93 518 $1,167 1922 2,273 1 1 41 Mid-Low* $1,358,000 96 1,336 $809 1940 5,000 2 2 9 Typical Home Price-Median* $1,650,000 99 1,569 $985 1947 5,500 3 2 22 Mid-High* $2,100,000 104 2,026 $1,177 1951 6,345 4 3 46 Actual Highest Sold $3,650,000 104 3,900 $936 2017 8,714 5 6 22 Average $1,772,536 100 1,755 $1,065 1948 5,768 3 2 30
© 2022 LEHOA GACKI. DRE# 01422855. ALL WORLDWIDE RIGHTS RESERVED. DOUGLAS ELLIMAN REAL ESTATE. 150 EL CAMINO DRIVE, BEVERLY HILLS, CA 90212. 310.595.3888. ALL MATERIAL PRESENTED HEREIN IS INTENDED FOR INFORMATION PURPOSES ONLY AND NOT INTENDED TO CONSTITUTE PROFESSIONAL ADVICE OR WARRANTY OUTSIDE THE REALM OF REAL ESTATE BROKERAGE. MAPS CREATED FOR REFERENCE PURPOSE ONLY. WHILE THIS INFORMATION IS BELIEVED TO BE CORRECT, IT IS REPRESENTED SUBJECT TO ERRORS, OMISSIONS, CHANGES OR WITHDRAWAL WITHOUT NOTICE. BASED ON DATA SOURCED FROM THE COMBINED LOS ANGELES WESTSIDE MULTIPLE LISTING SERVICE AND PUBLIC RECORDS. STATISTICS ARE SUBJECT TO CHANGE DUE TO INDIVIDUAL REAL ESTATE COMPANY REPORTING DISCIPLINES. BUYER ADVANTAGE OR SELLER ADVANTAGE IS STRICTLY OF THE OPINION OF LEHOA GACKI AND ACCURACY CANNOT BE GUARANTEED AND MAY NOT REFLECT ALL REAL ESTATE ACTIVITY ON THE MARKET. ALL PROPERTY INFORMATION, INCLUDING, BUT NOT LIMITED TO MAPS, GRAPHS, DEPICTIONS, SQUARE FOOTAGE, ROOM COUNT, NUMBER OF BEDROOMS AND THE SCHOOL DISTRICT IN PROPERTY LISTINGS SHOULD BE VERIFIED BY YOUR OWN ATTORNEY, ARCHITECT OR ZONING EXPERT. NEW CONSTRUCTION COUNT, SQUARE FOOTAGE AND YEAR BUILT IS BASED ON INDIVIDUAL REAL ESTATE COMPANY REPORTING AND MAY BE DIFFERENT THAN PUBLIC RECORDS. NEW CONSTRUCTION COUNT IS BASED ON LISTING BROKERAGE LISTING YEAR. THE BROKER/AGENT PROVIDING THE INFORMATION CONTAINED HEREIN MAY OR MAY HAVE NOT BEEN THE LISTING AND/OR SELLING AGENT. THIS IS NOT INTENDED TO SOLICIT PROPERTY ALREADY LISTED. EQUAL HOUSING OPPORTUNITY. NEIGHBORHOOD BOUNDARY SOURCE: PUBLIC RECORDS, COMBINED LOS ANGELES WESTSIDE MULTIPLE LISTING SERVICE AND LOS ANGELES TIMES MAPPING L.A. https://maps.latimes.com/neighborhoods/index.html
Source:
PALMS
SOLD HOME PRICE PER SQUARE FOOT - PRE & POST MAR 2020 PANDEMIC DAYS ON MARKET BEFORE SOLD- PRE & POST MAR 2020
SUPPLY OF INVENTORY - BASED ON LAST FEW MONTHS OF HOME SALES
28 14 5 15 22 20 13 325 10 15 20 25 30 35 Jan 01 to Jun 30, 2019 Jul 01 to Dec 31, 2019 Jan 01 to Jun 30, 2020 Jul 01 to Dec 31, 2020 Jan 01 to Jun 30, 2021 Jul 01 to Dec 31, 2021 Jan 01 to Jun 30, 2022 Jul 01 to Dec 31, 2022 Number of Homes Sold 39 22 15 29 42 29 32 21 Days on Market before Sold 3.3 3.5 2.7 4.5 1.3 1.4 0.0 0.5 1.0 1.5 2.0 2.5 3.0 3.5 4.0 4.5 5.0 Nov 30, 2022 Dec 31, 2022 Jan 31, 2023 Feb 28, 2023 Mar 31, 2023 Apr 30, 2023 Number of months it
to
properties
for sale if
new listings entered the market. $839 $915 $902 $874 $917 $913 $1,078 $985 $897 $867 $939 $916 $925 $934 $1,093 $1,029 $$200 $400 $600 $800 $1,000 $1,200 Jan 01 to Jun 30, 2019 Jul 01 to Dec 31, 2019 Jan 01 to Jun 30, 2020 Jul 01 to Dec 31, 2020 Jan 01 to Jun 30, 2021 Jul 01 to Dec 31, 2021 Jan 01 to Jun 30, 2022 Jul 01 to Dec 31, 2022 Median Price Per Square Foot Average Price per SquareFt END OF PALMS 6 PAGE REPORT
would take
sell all
Active
no
PANDEMIC
3 and Under Favors Seller 4-6 = Balanced Market 7 and over Favors Buyer PALMS PALMS PALMS
MONTHS
PicoRobertson
NEIGHBORING AREAS:
**Overbid/Underbid: 100 is list price paid. Under 100 means sold for less than asking, over 100 sold probably in multiples and over asking. Note:
Footage calculation could be more or less (+-) 20% difference. (Based on calculation.) *
For questions, comments, a tailor-made report for your home area, or a complimentary home valuation please contact LeHoa Gacki LeHoa Gacki Douglas Elliman Real Estate DRE #01422855 Lehoa.Gacki@elliman.com www.LeHoaGacki.com 424.276.7587 LeHoa’s Neighborhood Data Charts Los Angeles Real Estate LNDC APRIL 2023
A neighborhood in the City of Los Angeles PICO-ROBERTSON Beverly Hills Beverly Grove Century City Carthay Cheviot Hills Beverlywood Mid-City Single Family Homes April 2023 $1,425,000 TYPICAL HOME PRICE (MEDIAN) $860 SOLD PRICE PER SQUARE FOOT 9 DAYS ON MARKET BEFORE SOLD (DOM) $1,370,250 MID-LOW $1,931,250 MID-HIGH WHAT YOUR MONEY BUYS YOU THIS MONTH CLICK HERE FOR MORE Pico Robertson Home Analysis from: April 01, 2023 to April 30, 2023 4 Sold Sold Price **Overbid/ Underbid Square Feet Price per/SqFt YB LotSqFt BD BA Days on Market Actual Lowest Sold $1,352,000 85 1,401 $965 1940 5,215 3 2 28 Mid-Low* $1,370,250 88 1,521 $758 1929 5,265 3 2 0 Typical Home Price (Median)* $1,425,000 99 1,880 $860 1936 5,416 4 2 9 Mid-High* $1,931,250 113 2,107 $964 1939 6,417 4 2 26 Actual Highest Sold $2,100,000 117 2,183 $962 1926 6,751 3 2 18 Average $1,575,500 100 1,836 $861 1935 5,700 4 2 12
Middle Range Variance $561,000 Middle Range Variance
future range Typical Home Price (Median) Price will
Never more, Never less.
TheMLS/CLAW (Combined Los Angeles Westside)
Square
is
vary by.
Source:
Area Typical Home Price (Median) Price per/ SqFt Days on Market Mid-Low Mid-High Homes Sold Century City $2,180,000 $954 87 $2,085,000 $2,275,000 2 Beverly Hills $8,250,000 $1,448 66 $3,331,000 $9,600,000 11 Beverly Grove $2,025,000 $1,096 15 $1,887,500 $2,932,625 10 Carthay - - - $0 $0 0 Mid-City $1,210,000 $850 50 $1,050,000 $1,412,000 11 Beverlywood $2,672,026 $985 28 $1,595,000 $4,500,000 3 Cheviot Hills $2,962,500 $1,283 4 $2,317,500 $4,532,500 6
Buyer or Seller Advantage by Price Point for Pico Robertson as of April 30, 2023
Months supply of Inventory =
4-6 = BALANCED MARKET
Based on last 3 months of homes sales, Pico Robertson has 1.5 months supply of inventory.
$7,000,000 $10,000,000 $5,000,000 $6,999,999 $4,450,000 $4,999,999 $4,300,000 $4,449,999
BUYER ADVANTAGE $4,150,000 $4,299,999 $4,000,000 $4,149,999 $3,850,000 $3,999,999
3 and under FAVORS SELLER
7 and over FAVORS BUYER
$3,700,000 $3,849,999 SELLER ADVANTAGE
$3,550,000 $3,699,999 $3,400,000 $3,549,999
BUYER ADVANTAGE $3,250,000 $3,399,999
$3,100,000 $3,249,999
$2,950,000 $3,099,999
$2,800,000 $2,949,999
$2,650,000 $2,799,999
$2,500,000 $2,649,999
BUYER ADVANTAGE $2,350,000 $2,499,999
$2,200,000 $2,349,999 SELLER ADVANTAGE
$2,050,000 $2,199,999 $1,900,000 $2,049,999 SELLER ADVANTAGE
$1,750,000 $1,899,999 SELLER ADVANTAGE
$1,600,000 $1,749,999 SELLER ADVANTAGE
$1,450,000 $1,599,999
$1,300,000 $1,449,999
SELLER ADVANTAGE
$1,150,000 $1,299,999 SELLER ADVANTAGE
$1,000,000 $1,149,999
$750,000 $999,999
$500,000 $749,999
HOME PRICE RANGE
View homes below Contact for up to date homes for sale
Pico Robertson Inventory for New Construction and Resale of Homes
TheMLS/CLAW (Combined Los Angeles Westside) Under Contract Pending - Closing Soon New Construction New Con DOM Resale Resale DOM Home Price Range Homes Resold 1 101 6 90 4 $500,000 $749,999 $750,000 $999,999 $1,000,000 $1,149,999 $1,150,000 $1,299,999 1 $1,300,000 $1,449,999 $1,450,000 $1,599,999 $1,600,000 $1,749,999 1 11 $1,750,000 $1,899,999 1 14 $1,900,000 $2,049,999 1 2 81 $2,050,000 $2,199,999 $2,200,000 $2,349,999 2 1 184 $2,350,000 $2,499,999 $2,500,000 $2,649,999 $2,650,000 $2,799,999 $2,800,000 $2,949,999 $2,950,000 $3,099,999 $3,100,000 $3,249,999 1 101 $3,250,000 $3,399,999 $3,400,000 $3,549,999 $3,550,000 $3,699,999 $3,700,000 $3,849,999 $3,850,000 $3,999,999 $4,000,000 $4,149,999 1 167 $4,150,000 $4,299,999 $4,300,000 $4,449,999 $4,450,000 $4,999,999 $5,000,000 $6,999,999 $7,000,000 $10,000,000 REALTORS
SELLER ADVANTAGE SUPPLY & DEMAND For Sale Source:
Homes as of April 30, 2023
Based on last 3 months of homes sales, Bel-Air has 7.9 months supply of inventory.
BUYER / INVESTOR ADVANTAGE
DEMAND
Sold Homes Days on Market Before Sold = DOM February March April Resold DOM New Cons New DOM Homes Resold Resold DOM New Cons New DOM Homes Resold Resold DOM New Cons New DOM 30 1 4 5 36 4 12 90 3 9 1 63 2 48 21 2 10 1 18 5 1 4
REALTORS DIGEST
4 YEAR TREND
Mid-Low Typical Home Price-Median Mid-High
**Overbid / Underbid: 100 is list price paid. Under 100 means sold for less than asking, over 100 sold probably in multiples and over asking.
Note: Square Footage calculation could be more or less (+-) 20% difference. (Based on calculation.)
* Middle Range Variance $636,250 Middle Range Variance is future range Typical Home Price (Median) Price will vary by. Never more, Never less.
TheMLS/CLAW (Combined Los Angeles Westside)
For questions, comments, a tailor-made report for your home area, or a complimentary home valuation please contact LeHoa Gacki
$1,324,438 $1,525,000 $1,697,500 $1,558,750 $1,540,500 $1,650,000 $2,150,000 $1,845,000 $2,306,250 $2,300,000 $3,175,000 $2,195,000 $$500,000 $1,000,000 $1,500,000 $2,000,000 $2,500,000 $3,000,000 $3,500,000 May 01, 2019 to Apr 30, 2020 May 01, 2020 to Apr 30, 2021 May 01, 2021 to Apr 30, 2022 May 01, 2022 to Apr 30, 2023
LeHoa Gacki, DRE #01422855 Douglas Elliman Real Estate 11990 San Vicente Blvd., #100, L.A., Ca 90049 Email: Lehoa.Gacki@elliman.com Tel | Fax: (424) 276-7587 www.Lehoagacki.com | Lehoagacki.elliman.com 4 YEAR OBSERVATION Pico Robertson Number of Homes Sold: 28 43 33 36 May 01, 2019 to Apr 30, 2020 May 01, 2020 to Apr 30, 2021 May 01, 2021 to Apr 30, 2022 May 01, 2022 to Apr 30, 2023 Actual Lowest Sold $960,000 $1,145,000 $1,440,000 $1,211,280 Mid-Low $1,324,438 $1,525,000 $1,697,500 $1,558,750 Typical Home Price-Median $1,540,500 $1,650,000 $2,150,000 $1,845,000 Mid-High $2,306,250 $2,300,000 $3,175,000 $2,195,000 Actual Highest Sold $2,900,000 $3,425,000 $4,325,000 $3,800,000 Average Price Sold $1,772,640 $1,878,110 $2,462,303 $2,014,911 12 MONTH OBSERVATION Pico Robertson Cumulative 12 months sold home analysis from: May 01, 2022 to April 30, 2023 36 Sold Sold Price **Overbid / Underbid Square Feet Price per/SqFt YB LotSqFt BD BA Days on Market Actual Lowest Sold $1,211,280 102 1,515 $800 2016 1,851 3 3 8 Mid-Low* $1,558,750 96 1,520 $860 1929 5,416 3 2 5 Typical Home Price-Median* $1,845,000 100 1,749 $1,015 1938 6,004 3 2 11 Mid-High* $2,195,000 105 2,148 $1,163 1946 6,439 4 3 27 Actual Highest Sold $3,800,000 95 5,000 $760 2022 6,404 6 8 4 Average $2,014,911 103 2,062 $1,014 1949 5,774 3 3 21
Source:
© 2022 LEHOA GACKI. DRE# 01422855. ALL WORLDWIDE RIGHTS RESERVED. DOUGLAS ELLIMAN REAL ESTATE. 150 EL CAMINO DRIVE, BEVERLY HILLS, CA 90212. 310.595.3888. ALL MATERIAL PRESENTED HEREIN IS INTENDED FOR INFORMATION PURPOSES ONLY AND NOT INTENDED TO CONSTITUTE PROFESSIONAL ADVICE OR WARRANTY OUTSIDE THE REALM OF REAL ESTATE BROKERAGE. MAPS CREATED FOR REFERENCE PURPOSE ONLY. WHILE THIS INFORMATION IS BELIEVED TO BE CORRECT, IT IS REPRESENTED SUBJECT TO ERRORS, OMISSIONS, CHANGES OR WITHDRAWAL WITHOUT NOTICE. BASED ON DATA SOURCED FROM THE COMBINED LOS ANGELES WESTSIDE MULTIPLE LISTING SERVICE AND PUBLIC RECORDS. STATISTICS ARE SUBJECT TO CHANGE DUE TO INDIVIDUAL REAL ESTATE COMPANY REPORTING DISCIPLINES. BUYER ADVANTAGE OR SELLER ADVANTAGE IS STRICTLY OF THE OPINION OF LEHOA GACKI AND ACCURACY CANNOT BE GUARANTEED AND MAY NOT REFLECT ALL REAL ESTATE ACTIVITY ON THE MARKET. ALL PROPERTY INFORMATION, INCLUDING, BUT NOT LIMITED TO MAPS, GRAPHS, DEPICTIONS, SQUARE FOOTAGE, ROOM COUNT, NUMBER OF BEDROOMS AND THE SCHOOL DISTRICT IN PROPERTY LISTINGS SHOULD BE VERIFIED BY YOUR OWN ATTORNEY, ARCHITECT OR ZONING EXPERT. NEW CONSTRUCTION COUNT, SQUARE FOOTAGE AND YEAR BUILT IS BASED ON INDIVIDUAL REAL ESTATE COMPANY REPORTING AND MAY BE DIFFERENT THAN PUBLIC RECORDS. NEW CONSTRUCTION COUNT IS BASED ON LISTING BROKERAGE LISTING YEAR. THE BROKER/AGENT PROVIDING THE INFORMATION CONTAINED HEREIN MAY OR MAY HAVE NOT BEEN THE LISTING AND/OR SELLING AGENT. THIS IS NOT INTENDED TO SOLICIT PROPERTY ALREADY LISTED. EQUAL HOUSING OPPORTUNITY. NEIGHBORHOOD BOUNDARY SOURCE: PUBLIC RECORDS, COMBINED LOS ANGELES WESTSIDE MULTIPLE LISTING SERVICE AND LOS ANGELES TIMES MAPPING L.A. https://maps.latimes.com/neighborhoods/index.html
PICO ROBERTSON
SOLD HOME PRICE PER SQUARE FOOT - PRE & POST MAR 2020 PANDEMIC
$831 $866 $942 $920 $921 $929 $946 $1,043 $881 $894 $884 $917 $913 $939 $943 $1,073 $$200 $400 $600 $800 $1,000 $1,200 Jan 01 to Jun 30, 2019 Jul 01 to Dec 31, 2019 Jan 01 to Jun 30, 2020 Jul 01 to Dec 31, 2020 Jan 01 to Jun 30, 2021 Jul 01 to Dec 31, 2021 Jan 01 to Jun 30, 2022 Jul 01 to Dec 31, 2022 Median Price Per Square Foot Average Price per SquareFt 56 32 15 32 18 9 16 1210 20 30 40 50 60 Jan 01 to Jun 30, 2019 Jul 01 to Dec 31, 2019 Jan 01 to Jun 30, 2020 Jul 01 to Dec 31, 2020 Jan 01 to Jun 30, 2021 Jul 01 to Dec 31, 2021 Jan 01 to Jun 30, 2022 Jul 01 to Dec 31, 2022 Number of Homes Sold 15 14 10 29 20 19 10 16 Days on Market before Sold 6.5 2.0 3.8 2.2 1.3 1.5 0.0 1.0 2.0 3.0 4.0 5.0 6.0 7.0 Nov 30, 2022 Dec 31, 2022 Jan 31, 2023 Feb 28, 2023 Mar 31, 2023 Apr 30, 2023 Number of months it would take to sell all properties Active for sale if no new listings entered the market. END OF PICO ROBERTSON 6 PAGE REPORT
DAYS ON MARKET
PANDEMIC MONTHS SUPPLY OF INVENTORY - BASED ON LAST FEW MONTHS OF HOME SALES 3 and Under Favors Seller 4-6 = Balanced Market 7 and over Favors Buyer PICO ROBERTSON PICO ROBERTSON PICO ROBERTSON
BEFORE SOLD- PRE & POST MAR 2020
NEIGHBORING AREAS:
**Overbid/Underbid: 100 is list price paid. Under 100 means sold for less than asking, over 100 sold probably in multiples and over asking.
Note: Square Footage calculation could be more or less (+-) 20% difference. (Based on calculation.)
Source: TheMLS/CLAW (Combined Los Angeles Westside)
For questions, comments, a tailor-made report for your home area, or a complimentary home valuation please contact LeHoa Gacki LeHoa Gacki Douglas Elliman Real Estate DRE #01422855 Lehoa.Gacki@elliman.com www.LeHoaGacki.com 424.276.7587 LeHoa’s Neighborhood Data Charts Los Angeles Real Estate LNDC APRIL 2023
A neighborhood in the City of Los Angeles Marina Del Rey PLAYA VISTA Del Rey Culver City Playa Del Rey Westchester Single Family Homes April 2023 $2,185,000 TYPICAL HOME PRICE (MEDIAN) $871 SOLD PRICE PER SQUARE FOOT 14 DAYS ON MARKET BEFORE SOLD (DOM) $1,575,000 ACTUAL LOWEST SOLD $2,795,000 ACTUAL HIGHEST SOLD WHAT YOUR MONEY BUYS YOU THIS MONTH CLICK HERE FOR MORE Playa Vista Home Analysis from: April 01, 2023 to April 30, 2023 2 Sold Sold Price **Overbid/ Underbid Square Feet Price per/SqFt YB LotSqFt BD BA Days on Market Actual Lowest Sold $1,575,000 107 1,560 $1,010 1952 5,758 3 2 5 Typical Home Price (Median)* $2,185,000 103 2,690 $871 1979 42,974 3 3 14 Actual Highest Sold $2,795,000 100 3,820 $732 2005 80,189 3 4 23 Average $2,185,000 103 2,690 $871 1979 42,974 3 3 14
Playa Vista
Area Typical Home Price (Median) Price per/ SqFt Days on Market Mid-Low Mid-High Homes Sold Playa Del Rey $3,440,000 $732 14 1 Del Rey $1,504,000 $1,069 12 $1,271,500 $2,443,250 9 Culver City $1,601,000 $1,190 29 $1,400,000 $1,930,000 7 Westchester $1,422,500 $808 12 $1,207,500 $1,836,500 18
Buyer or Seller Advantage by Price Point for Playa Vista as of April 30, 2023
Based on last 3 months of homes sales, Playa Vista has 1.0 months supply of inventory.
$6,000,000 $10,000,000
Months supply of Inventory =
4-6 = BALANCED MARKET
3 and under FAVORS SELLER
7 and over FAVORS BUYER
$5,000,000 $5,999,999 SELLER ADVANTAGE
$4,450,000 $4,999,999
$4,300,000 $4,449,999
$4,150,000 $4,299,999
$4,000,000 $4,149,999
$3,850,000 $3,999,999
$3,700,000 $3,849,999
$3,550,000 $3,699,999
$3,400,000 $3,549,999
$3,250,000 $3,399,999
$3,100,000 $3,249,999
$2,950,000 $3,099,999
$2,800,000 $2,949,999
$2,650,000 $2,799,999 SELLER ADVANTAGE
$2,500,000 $2,649,999
BUYER ADVANTAGE
$2,350,000 $2,499,999
$2,200,000 $2,349,999
$2,050,000 $2,199,999 SELLER ADVANTAGE
$1,900,000 $2,049,999 SELLER ADVANTAGE
BUYER ADVANTAGE $1,750,000 $1,899,999
$1,600,000 $1,749,999 SELLER ADVANTAGE
$1,450,000 $1,599,999 SELLER ADVANTAGE
$1,300,000 $1,449,999
$1,150,000 $1,299,999
$1,000,000 $1,149,999
$750,000 $999,999
$500,000 $749,999
SELLER ADVANTAGE
SELLER ADVANTAGE
SELLER ADVANTAGE
HOME PRICE RANGE
View homes below Contact for up to date homes for sale
Playa Vista Inventory for New Construction and Resale of Homes SELLER
SUPPLY & DEMAND
ADVANTAGE
For Sale
Under Contract Pending - Closing Soon New Construction New Con DOM Resale Resale DOM Home Price Range Homes Resold 2 1 4 26 3 $500,000 $749,999 $750,000 $999,999 $1,000,000 $1,149,999 1 $1,150,000 $1,299,999 $1,300,000 $1,449,999 $1,450,000 $1,599,999 $1,600,000 $1,749,999 1 24 $1,750,000 $1,899,999 $1,900,000 $2,049,999 1 1 $2,050,000 $2,199,999 1 $2,200,000 $2,349,999 1 4 $2,350,000 $2,499,999 $2,500,000 $2,649,999 2 39 $2,650,000 $2,799,999 $2,800,000 $2,949,999 1 1 $2,950,000 $3,099,999 $3,100,000 $3,249,999 $3,250,000 $3,399,999 $3,400,000 $3,549,999 $3,550,000 $3,699,999 $3,700,000 $3,849,999 $3,850,000 $3,999,999 $4,000,000 $4,149,999 $4,150,000 $4,299,999 $4,300,000 $4,449,999 $4,450,000 $4,999,999 $5,000,000 $5,999,999 $6,000,000 $10,000,000 REALTORS
Source: TheMLS/CLAW (Combined Los Angeles Westside)
Based on last 3 months of homes sales, Bel-Air has 7.9 months supply of inventory.
BUYER / INVESTOR ADVANTAGE
Homes as
DEMAND
of April 30, 2023
Sold Homes Days on Market Before Sold = DOM February March April Resold DOM New Cons New DOM Homes Resold Resold DOM New Cons New DOM Homes Resold Resold DOM New Cons New DOM 16 7 28 2 14 2 27 28 1 15 1 5 1 12 6 13 1 95 1 23 2 10 REALTORS
DIGEST
4 YEAR TREND
Mid-Low Typical Home Price-Median Mid-High
**Overbid / Underbid: 100 is list price paid. Under 100 means sold for less than asking, over 100 sold probably in multiples and over asking.
Note: Square Footage calculation could be more or less (+-) 20% difference. (Based on calculation.)
* Middle Range Variance $1,283,000 Middle Range Variance is future range Typical Home Price (Median) Price will vary by. Never more, Never less.
TheMLS/CLAW (Combined Los Angeles Westside)
For questions, comments, a tailor-made report for your home area, or a complimentary home valuation please contact LeHoa Gacki
$1,116,250 $1,465,000 $1,689,000 $1,575,000 $1,797,500 $1,875,000 $2,349,500 $2,050,000 $2,861,000 $2,275,000 $2,625,000 $2,858,000 $$500,000 $1,000,000 $1,500,000 $2,000,000 $2,500,000 $3,000,000 $3,500,000 May 01, 2019 to Apr 30, 2020 May 01, 2020 to Apr 30, 2021 May 01, 2021 to Apr 30, 2022 May 01, 2022 to Apr 30, 2023
LeHoa Gacki, DRE #01422855 Douglas Elliman Real Estate 11990 San Vicente Blvd., #100, L.A., Ca 90049 Email: Lehoa.Gacki@elliman.com Tel | Fax: (424) 276-7587 www.Lehoagacki.com | Lehoagacki.elliman.com 4 YEAR OBSERVATION Playa Vista Number of Homes Sold: 56 55 74 39 May 01, 2019 to Apr 30, 2020 May 01, 2020 to Apr 30, 2021 May 01, 2021 to Apr 30, 2022 May 01, 2022 to Apr 30, 2023 Actual Lowest Sold $662,000 $900,000 $920,000 $905,000 Mid-Low $1,116,250 $1,465,000 $1,689,000 $1,575,000 Typical Home Price-Median $1,797,500 $1,875,000 $2,349,500 $2,050,000 Mid-High $2,861,000 $2,275,000 $2,625,000 $2,858,000 Actual Highest Sold $4,000,000 $3,988,888 $4,700,000 $5,150,000 Average Price Sold $1,965,880 $1,942,226 $2,323,866 $2,345,618 12 MONTH OBSERVATION Playa Vista Cumulative 12 months sold home analysis from: May 01, 2022 to April 30, 2023 39 Sold Sold Price **Overbid / Underbid Square Feet Price per/SqFt YB LotSqFt BD BA Days on Market Actual Lowest Sold $905,000 102 1,121 $807 1957 3,244 3 1 53 Mid-Low* $1,575,000 99 1,608 $770 1952 5,746 3 2 6 Typical Home Price-Median* $2,050,000 100 2,304 $899 2002 7,961 3 4 13 Mid-High* $2,858,000 104 2,849 $1,026 2014 49,074 4 4 23 Actual Highest Sold $5,150,000 95 4,494 $1,146 2018 7,961 5 7 4 Average $2,345,618 102 2,440 $921 1987 27,168 4 3 18
Source:
© 2022 LEHOA GACKI. DRE# 01422855. ALL WORLDWIDE RIGHTS RESERVED. DOUGLAS ELLIMAN REAL ESTATE. 150 EL CAMINO DRIVE, BEVERLY HILLS, CA 90212. 310.595.3888. ALL MATERIAL PRESENTED HEREIN IS INTENDED FOR INFORMATION PURPOSES ONLY AND NOT INTENDED TO CONSTITUTE PROFESSIONAL ADVICE OR WARRANTY OUTSIDE THE REALM OF REAL ESTATE BROKERAGE. MAPS CREATED FOR REFERENCE PURPOSE ONLY. WHILE THIS INFORMATION IS BELIEVED TO BE CORRECT, IT IS REPRESENTED SUBJECT TO ERRORS, OMISSIONS, CHANGES OR WITHDRAWAL WITHOUT NOTICE. BASED ON DATA SOURCED FROM THE COMBINED LOS ANGELES WESTSIDE MULTIPLE LISTING SERVICE AND PUBLIC RECORDS. STATISTICS ARE SUBJECT TO CHANGE DUE TO INDIVIDUAL REAL ESTATE COMPANY REPORTING DISCIPLINES. BUYER ADVANTAGE OR SELLER ADVANTAGE IS STRICTLY OF THE OPINION OF LEHOA GACKI AND ACCURACY CANNOT BE GUARANTEED AND MAY NOT REFLECT ALL REAL ESTATE ACTIVITY ON THE MARKET. ALL PROPERTY INFORMATION, INCLUDING, BUT NOT LIMITED TO MAPS, GRAPHS, DEPICTIONS, SQUARE FOOTAGE, ROOM COUNT, NUMBER OF BEDROOMS AND THE SCHOOL DISTRICT IN PROPERTY LISTINGS SHOULD BE VERIFIED BY YOUR OWN ATTORNEY, ARCHITECT OR ZONING EXPERT. NEW CONSTRUCTION COUNT, SQUARE FOOTAGE AND YEAR BUILT IS BASED ON INDIVIDUAL REAL ESTATE COMPANY REPORTING AND MAY BE DIFFERENT THAN PUBLIC RECORDS. NEW CONSTRUCTION COUNT IS BASED ON LISTING BROKERAGE LISTING YEAR. THE BROKER/AGENT PROVIDING THE INFORMATION CONTAINED HEREIN MAY OR MAY HAVE NOT BEEN THE LISTING AND/OR SELLING AGENT. THIS IS NOT INTENDED TO SOLICIT PROPERTY ALREADY LISTED. EQUAL HOUSING OPPORTUNITY. NEIGHBORHOOD BOUNDARY SOURCE: PUBLIC RECORDS, COMBINED LOS ANGELES WESTSIDE MULTIPLE LISTING SERVICE AND LOS ANGELES TIMES MAPPING L.A. https://maps.latimes.com/neighborhoods/index.html PLAYA VISTA
SOLD HOME PRICE PER SQUARE FOOT - PRE & POST MAR 2020 PANDEMIC
$812 $810 $784 $806 $831 $891 $966 $860 $784 $792 $776 $804 $824 $865 $971 $896 $$200 $400 $600 $800 $1,000 $1,200 Jan 01 to Jun 30, 2019 Jul 01 to Dec 31, 2019 Jan 01 to Jun 30, 2020 Jul 01 to Dec 31, 2020 Jan 01 to Jun 30, 2021 Jul 01 to Dec 31, 2021 Jan 01 to Jun 30, 2022 Jul 01 to Dec 31, 2022 Median Price Per Square Foot Average Price per SquareFt 58 44 22 31 20 11 13 1310 20 30 40 50 60 70 Jan 01 to Jun 30, 2019 Jul 01 to Dec 31, 2019 Jan 01 to Jun 30, 2020 Jul 01 to Dec 31, 2020 Jan 01 to Jun 30, 2021 Jul 01 to Dec 31, 2021 Jan 01 to Jun 30, 2022 Jul 01 to Dec 31, 2022 Number of Homes Sold 22 28 24 32 37 41 24 15 Days on Market before Sold 2.4 1.5 3.5 1.5 1.1 1.0 0.0 0.5 1.0 1.5 2.0 2.5 3.0 3.5 4.0 Nov 30, 2022 Dec 31, 2022 Jan 31, 2023 Feb 28, 2023 Mar 31, 2023 Apr 30, 2023 Number of months it would take to sell all properties Active for sale if no new listings entered the market. END OF PLAYA VISTA 6 PAGE REPORT
DAYS ON MARKET BEFORE SOLD- PRE & POST MAR 2020 PANDEMIC MONTHS SUPPLY OF INVENTORY - BASED ON LAST FEW MONTHS OF HOME SALES 3 and Under Favors Seller 4-6 = Balanced Market 7 and over Favors Buyer PLAYA VISTA PLAYA VISTA PLAYA VISTA
Rancho Park
For questions, comments, a tailor-made report for your home area, or a complimentary home valuation please contact
**Overbid/Underbid: 100 is list price paid. Under 100 means sold for less than asking, over 100 sold probably in multiples and over asking. Note: Square Footage calculation could be more or less (+-) 20% difference. (Based on calculation.)
LeHoa Gacki LeHoa Gacki Douglas Elliman Real Estate DRE #01422855 Lehoa.Gacki@elliman.com www.LeHoaGacki.com 424.276.7587 LeHoa’s Neighborhood Data Charts Los Angeles Real Estate LNDC APRIL 2023
A neighborhood in the City of Los Angeles MarVista RANCHO PARK West Los Angeles Palms Cheviot Hills Sawtelle WHAT YOUR MONEY BUYS YOU THIS MONTH CLICK HERE FOR MORE Rancho Park Home Analysis from: April 01, 2023 to April 30, 2023 1 Sold Sold Price **Overbid/ Underbid Square Feet Price per/SqFt YB LotSqFt BD BA Days on Market Typical Home Price (Median)* $1,350,000 104 1,014 $1,331 1945 6,324 3 1 5
Source: TheMLS/CLAW (Combined Los Angeles
Single Family Homes April 2023 $1,350,000 TYPICAL HOME PRICE (MEDIAN) $1,331 SOLD PRICE PER SQUARE FOOT 5 DAYS ON MARKET BEFORE SOLD (DOM) NEIGHBORING AREAS: Area Typical Home Price (Median) Price per/ SqFt Days on Market Mid-Low Mid-High Homes Sold Sawtelle $1,719,125 $994 10 $1,225,188 $2,596,875 4 West Los Angeles $1,875,000 $1,131 6 $1,775,000 $2,250,000 3 Cheviot Hills $2,962,500 $1,283 4 $2,317,500 $4,532,500 6 Palms $1,415,000 $898 14 $1,250,000 $2,240,000 5 Mar Vista $1,795,000 $1,105 10 $1,544,000 $2,235,000 17
Westside)
Buyer or Seller Advantage by Price Point for Rancho Park as of April 30, 2023
$9,999,999
$6,999,999
$6,499,999
$4,999,999
$4,749,999
$4,499,999
$4,249,999
$3,999,999
HOME PRICE RANGE
$12,000,000
$11,000,000
$10,000,000
$9,000,000
$8,000,000
$4,750,000
$4,500,000
$4,250,000
$4,000,000
$3,750,000
$3,500,000
BUYER ADVANTAGE $3,250,000
$3,000,000 $3,249,999 $2,750,000 $2,999,999 SELLER ADVANTAGE $2,500,000 $2,749,999 SELLER ADVANTAGE $2,250,000 $2,499,999 SELLER ADVANTAGE
ADVANTAGE $2,000,000
$1,750,000 $1,999,999 SELLER ADVANTAGE BUYER ADVANTAGE $1,500,000 $1,749,999 $1,250,000 $1,499,999 SELLER ADVANTAGE $900,000 $1,249,999 SELLER ADVANTAGE
$15,000,000 $20,000,000
$14,999,999
$11,999,999
$10,999,999
$8,999,999 $7,500,000 $7,999,999 $7,000,000 $7,499,999 $6,500,000
$6,000,000
$5,500,000 $5,999,999 $5,000,000 $5,499,999
$3,749,999
$3,499,999
BUYER
$2,249,999
Based on last 3 months of homes sales, Rancho Park has 2.1 months supply of inventory.
4-6 = BALANCED MARKET
BUYER
View homes below Contact for up to date homes for sale
3 and under FAVORS SELLER 7 and over FAVORS
Months supply of Inventory =
Rancho Park Inventory for New Construction and Resale of Homes
SUPPLY & DEMAND
TheMLS/CLAW (Combined Los Angeles Westside) Under Contract Pending - Closing Soon New Construction New Con DOM Resale Resale DOM Home Price Range Homes Resold 1 3 5 25 3 1 $900,000 $1,149,999 1 1 $1,150,000 $1,399,999 $1,400,000 $1,649,999 2 12 $1,650,000 $1,899,999 1 2 42 $1,900,000 $2,149,999 1 $2,150,000 $2,399,999 1 $2,400,000 $2,649,999 1 $2,650,000 $2,899,999 $2,900,000 $3,149,999 $3,150,000 $3,399,999 1 18 $3,400,000 $3,649,999 $3,650,000 $3,899,999 $3,900,000 $4,149,999 $4,150,000 $4,399,999 $4,400,000 $4,649,999 $4,650,000 $4,899,999 $4,900,000 $5,499,999 $5,500,000 $5,999,999 $6,000,000 $6,499,999 $6,500,000 $6,999,999 $7,000,000 $7,499,999 $7,500,000 $7,999,999 $8,000,000 $8,999,999 $9,000,000 $9,999,999 $10,000,000 $10,999,999 $11,000,000 $11,999,999 $12,000,000 $14,999,999 $15,000,000 $20,000,000 REALTORS
SELLER ADVANTAGE
For Sale Source:
Homes as of April 30, 2023
Based on last 3 months of homes sales, Bel-Air has 7.9 months supply of inventory.
BUYER / INVESTOR ADVANTAGE
DEMAND
Sold Homes Days on Market Before Sold = DOM February March April Resold DOM New Cons New DOM Homes Resold Resold DOM New Cons New DOM Homes Resold Resold DOM New Cons New DOM 18 3 62 1 5 29 1 185 1 5 14 11 1 0 1 0
REALTORS DIGEST
4 YEAR TREND
Mid-Low Typical Home Price-Median Mid-High
**Overbid / Underbid: 100 is list price paid. Under 100 means sold for less than asking, over 100 sold probably in multiples and over asking.
Note: Square Footage calculation could be more or less (+-) 20% difference. (Based on calculation.)
* Middle Range Variance $783,000 Middle Range Variance is future range Typical Home Price (Median) Price will vary by. Never more, Never less.
TheMLS/CLAW (Combined Los Angeles Westside)
For questions, comments, a tailor-made report for your home area, or a complimentary home valuation please contact LeHoa Gacki
$1,246,250 $1,460,000 $1,500,000 $1,502,500 $1,453,750 $1,650,000 $1,620,000 $1,807,000 $1,732,500 $1,957,000 $1,958,000 $2,285,500 $$500,000 $1,000,000 $1,500,000 $2,000,000 $2,500,000 May 01, 2019 to Apr 30, 2020 May 01, 2020 to Apr 30, 2021 May 01, 2021 to Apr 30, 2022 May 01, 2022 to Apr 30, 2023
LeHoa Gacki, DRE #01422855 Douglas Elliman Real Estate 11990 San Vicente Blvd., #100, L.A., Ca 90049 Email: Lehoa.Gacki@elliman.com Tel | Fax: (424) 276-7587 www.Lehoagacki.com | Lehoagacki.elliman.com 4 YEAR OBSERVATION Rancho Park Number of Homes Sold: 34 35 55 36 May 01, 2019 to Apr 30, 2020 May 01, 2020 to Apr 30, 2021 May 01, 2021 to Apr 30, 2022 May 01, 2022 to Apr 30, 2023 Actual Lowest Sold $850,000 $1,125,000 $720,000 $1,070,000 Mid-Low $1,246,250 $1,460,000 $1,500,000 $1,502,500 Typical Home Price-Median $1,453,750 $1,650,000 $1,620,000 $1,807,000 Mid-High $1,732,500 $1,957,000 $1,958,000 $2,285,500 Actual Highest Sold $2,520,000 $2,905,000 $2,595,000 $3,528,000 Average Price Sold $1,539,941 $1,730,522 $1,710,476 $1,886,562 12 MONTH OBSERVATION Rancho Park Cumulative 12 months sold home analysis from: May 01, 2022 to April 30, 2023 36 Sold Sold Price **Overbid / Underbid Square Feet Price per/SqFt YB LotSqFt BD BA Days on Market Actual Lowest Sold $1,070,000 93 1,124 $952 1940 3,456 2 2 20 Mid-Low* $1,502,500 98 1,278 $910 1941 5,764 3 2 9 Typical Home Price-Median* $1,807,000 100 1,659 $1,055 1945 6,091 3 2 13 Mid-High* $2,285,500 106 2,098 $1,226 1948 6,306 4 3 25 Actual Highest Sold $3,528,000 101 3,296 $1,070 2022 5,819 4 5 12 Average $1,886,562 103 1,868 $1,080 1952 6,024 3 3 21
Source:
© 2022 LEHOA GACKI. DRE# 01422855. ALL WORLDWIDE RIGHTS RESERVED. DOUGLAS ELLIMAN REAL ESTATE. 150 EL CAMINO DRIVE, BEVERLY HILLS, CA 90212. 310.595.3888. ALL MATERIAL PRESENTED HEREIN IS INTENDED FOR INFORMATION PURPOSES ONLY AND NOT INTENDED TO CONSTITUTE PROFESSIONAL ADVICE OR WARRANTY OUTSIDE THE REALM OF REAL ESTATE BROKERAGE. MAPS CREATED FOR REFERENCE PURPOSE ONLY. WHILE THIS INFORMATION IS BELIEVED TO BE CORRECT, IT IS REPRESENTED SUBJECT TO ERRORS, OMISSIONS, CHANGES OR WITHDRAWAL WITHOUT NOTICE. BASED ON DATA SOURCED FROM THE COMBINED LOS ANGELES WESTSIDE MULTIPLE LISTING SERVICE AND PUBLIC RECORDS. STATISTICS ARE SUBJECT TO CHANGE DUE TO INDIVIDUAL REAL ESTATE COMPANY REPORTING DISCIPLINES. BUYER ADVANTAGE OR SELLER ADVANTAGE IS STRICTLY OF THE OPINION OF LEHOA GACKI AND ACCURACY CANNOT BE GUARANTEED AND MAY NOT REFLECT ALL REAL ESTATE ACTIVITY ON THE MARKET. ALL PROPERTY INFORMATION, INCLUDING, BUT NOT LIMITED TO MAPS, GRAPHS, DEPICTIONS, SQUARE FOOTAGE, ROOM COUNT, NUMBER OF BEDROOMS AND THE SCHOOL DISTRICT IN PROPERTY LISTINGS SHOULD BE VERIFIED BY YOUR OWN ATTORNEY, ARCHITECT OR ZONING EXPERT. NEW CONSTRUCTION COUNT, SQUARE FOOTAGE AND YEAR BUILT IS BASED ON INDIVIDUAL REAL ESTATE COMPANY REPORTING AND MAY BE DIFFERENT THAN PUBLIC RECORDS. NEW CONSTRUCTION COUNT IS BASED ON LISTING BROKERAGE LISTING YEAR. THE BROKER/AGENT PROVIDING THE INFORMATION CONTAINED HEREIN MAY OR MAY HAVE NOT BEEN THE LISTING AND/OR SELLING AGENT. THIS IS NOT INTENDED TO SOLICIT PROPERTY ALREADY LISTED. EQUAL HOUSING OPPORTUNITY. NEIGHBORHOOD BOUNDARY SOURCE: PUBLIC RECORDS, COMBINED LOS ANGELES WESTSIDE MULTIPLE LISTING SERVICE AND LOS ANGELES TIMES MAPPING L.A. https://maps.latimes.com/neighborhoods/index.html
RANCHO PARK
SOLD HOME PRICE PER SQUARE FOOT - PRE & POST MAR 2020 PANDEMIC
BEFORE SOLD- PRE & POST MAR 2020
$765 $909 $910 $969 $903 $941 $1,137 $944 $819 $910 $919 $938 $932 $979 $1,105 $1,008 $$200 $400 $600 $800 $1,000 $1,200 Jan 01 to Jun 30, 2019 Jul 01 to Dec 31, 2019 Jan 01 to Jun 30, 2020 Jul 01 to Dec 31, 2020 Jan 01 to Jun 30, 2021 Jul 01 to Dec 31, 2021 Jan 01 to Jun 30, 2022 Jul 01 to Dec 31, 2022 Median Price Per Square Foot Average Price per SquareFt 47 43 19 28 13 12 10 205 10 15 20 25 30 35 40 45 50 Jan 01 to Jun 30, 2019 Jul 01 to Dec 31, 2019 Jan 01 to Jun 30, 2020 Jul 01 to Dec 31, 2020 Jan 01 to Jun 30, 2021 Jul 01 to Dec 31, 2021 Jan 01 to Jun 30, 2022 Jul 01 to Dec 31, 2022 Number of Homes Sold 16 19 9 22 28 28 21 17 Days on Market before Sold 0.6 1.5 2.5 2.4 1.5 2.1 0.0 0.5 1.0 1.5 2.0 2.5 3.0 Nov 30, 2022 Dec 31, 2022 Jan 31, 2023 Feb 28, 2023 Mar 31, 2023 Apr 30, 2023 Number of months it would take to sell all properties Active for sale if no new listings entered the market. END OF RANCHO PARK 6 PAGE REPORT
DAYS
MARKET
PANDEMIC MONTHS SUPPLY OF INVENTORY - BASED
FEW MONTHS OF HOME SALES 3 and Under Favors Seller 4-6 = Balanced Market 7 and over Favors Buyer RANCHO PARK RANCHO PARK RANCHO PARK
ON
ON LAST
NEIGHBORING AREAS:
**Overbid/Underbid: 100 is list price paid. Under 100 means sold for less than asking, over 100 sold probably in multiples and over asking.
Note: Square Footage calculation could be more or less (+-) 20% difference. (Based on calculation.)
Single Family Homes April 2023 $2,700,000 TYPICAL HOME PRICE (MEDIAN)
PRICE PER SQUARE FOOT 8 DAYS ON MARKET BEFORE SOLD (DOM)
For questions, comments, a tailor-made report for your home area, or a complimentary home valuation please contact LeHoa Gacki LeHoa Gacki Douglas Elliman Real Estate DRE #01422855 Lehoa.Gacki@elliman.com www.LeHoaGacki.com 424.276.7587 LeHoa’s Neighborhood Data Charts Los Angeles Real Estate LNDC APRIL 2023
A City in Los Angeles County SANTA MONICA Brentwood Venice Mar Vista Pacific Palicades Sawtelle WHAT YOUR MONEY BUYS YOU THIS MONTH CLICK HERE FOR MORE Santa Monica Home Analysis from: April 01, 2023 to April 30, 2023 13 Sold Sold Price **Overbid/ Underbid Square Feet Price per/SqFt YB LotSqFt BD BA Days on Market Actual Lowest Sold $1,090,000 84 944 $1,155 1924 4,126 3 2 0 Mid-Low* $2,052,500 100 1,153 $1,158 1926 5,625 3 2 2 Typical Home Price (Median)* $2,700,000 100 1,677 $1,425 1934 7,122 3 2 8 Mid-High* $5,495,356 107 2,865 $1,891 1939 7,925 4 4 15 Actual Highest Sold $7,990,000 102 5,915 $1,351 1998 8,930 5 5 4 Average $3,606,495 102 2,218 $1,584 1937 6,834 3 3 14
$1,425 SOLD
$2,052,500 MID-LOW $5,495,356 MID-HIGH
Santa Monica
* Middle Range Variance $3,442,856 Middle Range Variance is future range Typical Home Price (Median) Price will vary by. Never more, Never less. Source: TheMLS/CLAW (Combined Los Angeles Westside)
Area Typical Home Price (Median) Price per/ SqFt Days on Market Mid-Low Mid-High Homes Sold Pacific Palisades $3,900,000 $1,389 30 $2,580,000 $4,950,000 15 Brentwood $3,377,500 $1,313 18 $2,555,875 $4,912,499 12 Sawtelle $1,719,125 $994 10 $1,225,188 $2,596,875 4 Mar Vista $1,795,000 $1,105 10 $1,544,000 $2,235,000 17 Venice $2,755,000 $1,461 46 $1,800,817 $4,300,000 19
Buyer or Seller Advantage by Price Point for Santa Monica as
of April 30, 2023
Based on last 3 months of homes sales, Santa Monica has 3.5 months supply of inventory.
$19,999,999
$17,499,999
$14,999,999
Months supply of Inventory =
4-6 = BALANCED MARKET
3 and under FAVORS SELLER
7 and over FAVORS BUYER
$4,499,999 $3,500,000 $3,999,999
HOME PRICE RANGE
$70,000,000
BUYER ADVANTAGE $60,000,000
$50,000,000
$30,000,000
$17,500,000
$15,000,000
$13,500,000
$12,000,000
ADVANTAGE $10,000,000
$9,000,000
SELLER ADVANTAGE $8,000,000 $8,999,999 SELLER ADVANTAGE $7,000,000 $7,999,999 BUYER ADVANTAGE $6,500,000 $6,999,999 $6,000,000 $6,499,999 SELLER ADVANTAGE $5,500,000 $5,999,999 SELLER ADVANTAGE $5,000,000 $5,499,999 SELLER ADVANTAGE
ADVANTAGE $4,500,000 $4,999,999 $4,000,000
$2,500,000
SELLER
$2,000,000
SELLER
SELLER
$1,000,000
$80,000,000 $100,000,000
$79,999,999
$69,999,999
$59,999,999 $40,000,000 $49,999,999
$39,999,999 $25,000,000 $29,999,999 $20,000,000 $24,999,999 BUYER ADVANTAGE
$13,499,999 BUYER
$11,999,999
$9,999,999
BUYER
SELLER ADVANTAGE $3,000,000 $3,499,999 SELLER ADVANTAGE
$2,999,999
ADVANTAGE
$2,499,999
ADVANTAGE $1,500,000 $1,999,999
ADVANTAGE
$1,499,999 SELLER ADVANTAGE
View homes below Contact for up to date homes for sale
Santa Monica Inventory for New Construction and Resale of Homes
SELLER ADVANTAGE SUPPLY
For Sale
DEMAND
&
Under Contract Pending - Closing Soon New Construction New Con DOM Resale Resale DOM Home Price Range Homes Resold 4 4 6 76 54 61 14 1 8 $1,000,000 $1,499,999 1 3 154 $1,500,000 $1,999,999 2 1 1 32 4 18 $2,000,000 $2,499,999 1 4 59 $2,500,000 $2,999,999 3 1 32 $3,000,000 $3,499,999 1 1 1 1 12 5 60 $3,500,000 $3,999,999 2 1 7 78 $4,000,000 $4,499,999 1 186 4 24 $4,500,000 $4,999,999 $5,000,000 $5,499,999 4 45 $5,500,000 $5,999,999 $6,000,000 $6,499,999 4 47 $6,500,000 $6,999,999 4 45 $7,000,000 $7,999,999 1 2 102 $8,000,000 $8,999,999 3 1 14 2 154 $9,000,000 $9,999,999 3 1 19 3 60 $10,000,000 $11,999,999 $12,000,000 $13,499,999 1 192 1 21 $13,500,000 $14,999,999 1 2 38 $15,000,000 $17,499,999 2 66 $17,500,000 $19,999,999 $20,000,000 $24,999,999 $25,000,000 $29,999,999 $30,000,000 $39,999,999 $40,000,000 $49,999,999 $50,000,000 $59,999,999 1 68 $60,000,000 $69,999,999 $70,000,000 $79,999,999 $80,000,000 $100,000,000 REALTORS
Source:
TheMLS/CLAW (Combined Los Angeles Westside)
Homes as of April 30, 2023
Based on last 3 months of homes sales, Bel-Air has 7.9 months supply of inventory.
BUYER / INVESTOR ADVANTAGE
DEMAND
Sold Homes Days on Market Before Sold = DOM February March April Resold DOM New Cons New DOM Homes Resold Resold DOM New Cons New DOM Homes Resold Resold DOM New Cons New DOM 60 1 20 21 36 2 71 13 14 2 79 1 0 8 2 7 3 4 2 21 33 3 22 2 11 11 1 10 1 84 1 17 4 48 1 54 1 0 1 67 1 12 2 37 1 57 1 12 3 44 1 7 53 1 4 111 24 1 52 252 1 20 REALTORS
DIGEST
4 YEAR TREND
**Overbid / Underbid: 100 is list price paid. Under 100 means sold for less than asking, over 100 sold probably in multiples and over asking.
Note: Square Footage calculation could be more or less (+-) 20% difference. (Based on calculation.)
* Middle Range Variance $2,912,500 Middle Range Variance is future range Typical Home Price (Median) Price will vary by. Never more, Never less.
TheMLS/CLAW (Combined Los Angeles Westside)
For questions, comments, a tailor-made report for your home area, or a complimentary home valuation please contact LeHoa Gacki
$1,825,000 $2,121,500 $2,408,750 $2,481,250 $2,672,500 $3,003,000 $3,450,000 $3,645,500 $3,998,127 $4,369,000 $5,360,738 $5,393,750 $$1,000,000 $2,000,000 $3,000,000 $4,000,000 $5,000,000 $6,000,000 May 01, 2019 to Apr 30, 2020 May 01, 2020 to Apr 30, 2021 May 01, 2021 to Apr 30, 2022 May 01, 2022 to Apr 30, 2023 Mid-Low Typical Home Price-Median Mid-High
LeHoa Gacki, DRE #01422855 Douglas Elliman Real Estate 11990 San Vicente Blvd., #100, L.A., Ca 90049 Email: Lehoa.Gacki@elliman.com Tel | Fax: (424) 276-7587 www.Lehoagacki.com | Lehoagacki.elliman.com 4 YEAR OBSERVATION Santa Monica Number of Homes Sold: 214 249 332 196 May 01, 2019 to Apr 30, 2020 May 01, 2020 to Apr 30, 2021 May 01, 2021 to Apr 30, 2022 May 01, 2022 to Apr 30, 2023 Actual Lowest Sold $1,070,000 $725,000 $1,150,000 $1,000,000 Mid-Low $1,825,000 $2,121,500 $2,408,750 $2,481,250 Typical Home Price-Median $2,672,500 $3,003,000 $3,450,000 $3,645,500 Mid-High $3,998,127 $4,369,000 $5,360,738 $5,393,750 Actual Highest Sold $16,000,000 $48,674,649 $12,920,000 $19,500,000 Average Price Sold $3,206,160 $3,652,371 $4,170,718 $4,366,866 12 MONTH OBSERVATION Santa Monica Cumulative 12 months sold home analysis from: May 01, 2022 to April 30, 2023 196 Sold Sold Price **Overbid / Underbid Square Feet Price per/SqFt YB LotSqFt BD BA Days on Market Actual Lowest Sold $1,000,000 80 1,626 $615 1969 8,944 4 2 44 Mid-Low* $2,481,250 96 1,627 $1,217 1926 5,894 3 2 9 Typical Home Price-Median* $3,645,500 100 2,424 $1,513 1939 7,475 4 3 17 Mid-High* $5,393,750 104 3,687 $1,777 1964 8,714 5 5 41 Actual Highest Sold $19,500,000 98 12,379 $1,575 2021 20,807 7 12 91 Average $4,366,866 100 2,882 $1,554 1952 8,178 4 4 31
Source:
© 2022 LEHOA GACKI. DRE# 01422855. ALL WORLDWIDE RIGHTS RESERVED. DOUGLAS ELLIMAN REAL ESTATE. 150 EL CAMINO DRIVE, BEVERLY HILLS, CA 90212. 310.595.3888. ALL MATERIAL PRESENTED HEREIN IS INTENDED FOR INFORMATION PURPOSES ONLY AND NOT INTENDED TO CONSTITUTE PROFESSIONAL ADVICE OR WARRANTY OUTSIDE THE REALM OF REAL ESTATE BROKERAGE. MAPS CREATED FOR REFERENCE PURPOSE ONLY. WHILE THIS INFORMATION IS BELIEVED TO BE CORRECT, IT IS REPRESENTED SUBJECT TO ERRORS, OMISSIONS, CHANGES OR WITHDRAWAL WITHOUT NOTICE. BASED ON DATA SOURCED FROM THE COMBINED LOS ANGELES WESTSIDE MULTIPLE LISTING SERVICE AND PUBLIC RECORDS. STATISTICS ARE SUBJECT TO CHANGE DUE TO INDIVIDUAL REAL ESTATE COMPANY REPORTING DISCIPLINES. BUYER ADVANTAGE OR SELLER ADVANTAGE IS STRICTLY OF THE OPINION OF LEHOA GACKI AND ACCURACY CANNOT BE GUARANTEED AND MAY NOT REFLECT ALL REAL ESTATE ACTIVITY ON THE MARKET. ALL PROPERTY INFORMATION, INCLUDING, BUT NOT LIMITED TO MAPS, GRAPHS, DEPICTIONS, SQUARE FOOTAGE, ROOM COUNT, NUMBER OF BEDROOMS AND THE SCHOOL DISTRICT IN PROPERTY LISTINGS SHOULD BE VERIFIED BY YOUR OWN ATTORNEY, ARCHITECT OR ZONING EXPERT. NEW CONSTRUCTION COUNT, SQUARE FOOTAGE AND YEAR BUILT IS BASED ON INDIVIDUAL REAL ESTATE COMPANY REPORTING AND MAY BE DIFFERENT THAN PUBLIC RECORDS. NEW CONSTRUCTION COUNT IS BASED ON LISTING BROKERAGE LISTING YEAR. THE BROKER/AGENT PROVIDING THE INFORMATION CONTAINED HEREIN MAY OR MAY HAVE NOT BEEN THE LISTING AND/OR SELLING AGENT. THIS IS NOT INTENDED TO SOLICIT PROPERTY ALREADY LISTED. EQUAL HOUSING OPPORTUNITY. NEIGHBORHOOD BOUNDARY SOURCE: PUBLIC RECORDS, COMBINED LOS ANGELES WESTSIDE MULTIPLE LISTING SERVICE AND LOS ANGELES TIMES MAPPING L.A. https://maps.latimes.com/neighborhoods/index.html
SANTA MONICA
$1,229 $1,189 $1,121 $1,241 $1,303 $1,302 $1,552 $1,513 $1,343 $1,247 $1,222 $1,305 $1,395 $1,390 $1,612 $1,501 $$200 $400 $600 $800 $1,000 $1,200 $1,400 $1,600 $1,800 Jan 01 to Jun 30, 2019 Jul 01 to Dec 31, 2019 Jan 01 to Jun 30, 2020 Jul 01 to Dec 31, 2020 Jan 01 to Jun 30, 2021 Jul 01 to Dec 31, 2021 Jan 01 to Jun 30, 2022 Jul 01 to Dec 31, 2022 Median Price Per Square Foot Average Price per SquareFt 36 40 15 20 18 14 13 185 10 15 20 25 30 35 40 45 Jan 01 to Jun 30, 2019 Jul 01 to Dec 31, 2019 Jan 01 to Jun 30, 2020 Jul 01 to Dec 31, 2020 Jan 01 to Jun 30, 2021 Jul 01 to Dec 31, 2021 Jan 01 to Jun 30, 2022 Jul 01 to Dec 31, 2022 Number of Homes Sold 91 118 84 143 151 191 110 99 Days on Market before Sold 4.0 3.7 4.7 3.8 3.1 3.5 0.0 0.5 1.0 1.5 2.0 2.5 3.0 3.5 4.0 4.5 5.0 Nov 30, 2022 Dec 31, 2022 Jan 31, 2023 Feb 28, 2023 Mar 31, 2023 Apr 30, 2023 Number of months it would take to sell all properties Active for sale if no new listings entered the market. END OF SANTA MONICA 6 PAGE REPORT
DAYS ON MARKET BEFORE SOLD- PRE & POST
2020 PANDEMIC MONTHS SUPPLY OF INVENTORY - BASED ON LAST FEW MONTHS OF HOME SALES 3 and Under Favors Seller 4-6 = Balanced Market 7 and over Favors Buyer
SANTA
SOLD HOME PRICE PER SQUARE FOOT - PRE & POST MAR 2020 PANDEMIC
MAR
SANTA MONICA
MONICA SANTA MONICA
NEIGHBORING AREAS:
**Overbid/Underbid: 100 is list price paid. Under 100 means sold for less than asking, over 100 sold probably in multiples and over asking.
Note: Square Footage calculation could be more or less (+-) 20% difference. (Based on calculation.)
For questions, comments, a tailor-made report for your home area, or a complimentary home valuation please contact LeHoa Gacki LeHoa Gacki Douglas Elliman Real Estate DRE #01422855 Lehoa.Gacki@elliman.com www.LeHoaGacki.com 424.276.7587 LeHoa’s Neighborhood Data Charts Los Angeles Real Estate LNDC APRIL 2023 Sawtelle A neighborhood in the City of Los Angeles SAWTELLE Brentwood Westwood West Los Angeles Santa Monica Mar Vista Rancho Park Palms Single Family Homes April 2023 $1,719,125 TYPICAL HOME PRICE (MEDIAN) $994 SOLD PRICE PER SQUARE FOOT 10 DAYS ON MARKET BEFORE SOLD (DOM) $1,225,188 ACTUAL LOWEST SOLD $2,596,875 ACTUAL HIGHEST SOLD WHAT YOUR MONEY BUYS YOU THIS MONTH CLICK HERE FOR MORE Sawtelle Home Analysis from: April 01, 2023 to April 30, 2023 4 Sold Sold Price **Overbid/ Underbid Square Feet Price per/SqFt YB LotSqFt BD BA Days on Market Actual Lowest Sold $1,100,000 100 1,237 $889 1951 5,403 3 1 0 Mid-Low* $1,225,188 91 1,092 $823 1934 5,638 2 1 2 Typical Home Price (Median)* $1,719,125 98 1,766 $994 1978 6,449 3 3 10 Mid-High* $2,596,875 104 2,521 $1,424 2018 6,617 5 5 16 Actual Highest Sold $2,850,000 95 2,596 $1,098 2022 6,554 5 5 17 Average $1,847,063 97 1,793 $1,080 1976 6,235 3 3 9
Middle Range Variance $1,371,688 Middle Range Variance is future range Typical Home Price (Median) Price will vary by. Never more, Never less. Source: TheMLS/CLAW (Combined Los Angeles Westside)
*
Area Typical Home Price (Median) Price per/ SqFt Days on Market Mid-Low Mid-High Homes Sold Brentwood $3,377,500 $1,313 18 $2,555,875 $4,912,499 12 Westwood $3,333,300 $1,080 9 $2,374,000 $3,620,590 7 West Los Angeles $1,875,000 $1,131 6 $1,775,000 $2,250,000 3 Rancho Park $1,350,000 $1,331 5 $1,350,000 $1,350,000 1 Palms $1,415,000 $898 14 $1,250,000 $2,240,000 5 Mar Vista $1,795,000 $1,105 10 $1,544,000 $2,235,000 17 Santa Monica $2,700,000 $1,425 8 $2,052,500 $5,495,356 13
Buyer or Seller Advantage by Price Point for Sawtelle as of April 30, 2023
Based on last 3 months of homes sales, Sawtelle has 1.1 months supply of inventory.
$6,000,000 $11,000,000
$5,000,000 $5,999,999
$4,450,000 $4,999,999
$4,300,000 $4,449,999
$4,150,000 $4,299,999
$4,000,000 $4,149,999
$3,850,000 $3,999,999
$3,700,000 $3,849,999
$3,550,000 $3,699,999
$3,400,000 $3,549,999
Months supply of Inventory =
4-6 = BALANCED MARKET
3 and under FAVORS SELLER
7 and over FAVORS BUYER
$3,250,000 $3,399,999 SELLER ADVANTAGE
$3,100,000 $3,249,999
$2,950,000 $3,099,999
$2,800,000 $2,949,999 SELLER ADVANTAGE
$2,650,000 $2,799,999 SELLER ADVANTAGE
$2,500,000 $2,649,999 SELLER ADVANTAGE
$2,350,000 $2,499,999 SELLER ADVANTAGE
$2,200,000 $2,349,999
$2,050,000 $2,199,999 SELLER ADVANTAGE
$1,900,000 $2,049,999
$1,750,000 $1,899,999 SELLER ADVANTAGE
$1,600,000 $1,749,999 SELLER ADVANTAGE
$1,450,000 $1,599,999 SELLER ADVANTAGE
$1,300,000 $1,449,999 SELLER ADVANTAGE
$1,150,000 $1,299,999 SELLER ADVANTAGE
$1,000,000 $1,149,999 SELLER ADVANTAGE
$750,000 $999,999
$500,000 $749,999
HOME PRICE RANGE
View homes below Contact for up to date homes for sale
Sawtelle Inventory for New Construction and Resale of Homes as
& DEMAND
TheMLS/CLAW (Combined Los Angeles Westside) Under Contract Pending - Closing Soon New Construction New Con DOM Resale Resale DOM Home Price Range Homes Resold 6 8 6 31 4 $500,000 $749,999 $750,000 $999,999 $1,000,000 $1,149,999 4 1 2 47 $1,150,000 $1,299,999 $1,300,000 $1,449,999 2 1 $1,450,000 $1,599,999 1 $1,600,000 $1,749,999 1 3 $1,750,000 $1,899,999 1 $1,900,000 $2,049,999 1 $2,050,000 $2,199,999 $2,200,000 $2,349,999 1 1 42 $2,350,000 $2,499,999 $2,500,000 $2,649,999 1 1 $2,650,000 $2,799,999 $2,800,000 $2,949,999 2 19 $2,950,000 $3,099,999 $3,100,000 $3,249,999 1 12 $3,250,000 $3,399,999 $3,400,000 $3,549,999 $3,550,000 $3,699,999 $3,700,000 $3,849,999 $3,850,000 $3,999,999 $4,000,000 $4,149,999 $4,150,000 $4,299,999 $4,300,000 $4,449,999 $4,450,000 $4,999,999 $5,000,000 $5,999,999 $6,000,000 $11,000,000 REALTORS
SELLER ADVANTAGE SUPPLY
For Sale Source:
Based on last 3 months of homes sales, Bel-Air has 7.9 months supply of inventory.
BUYER / INVESTOR ADVANTAGE
as of April
30, 2023 DEMAND
Sold Homes Days on Market Before Sold = DOM February March April Resold DOM New Cons New DOM Homes Resold Resold DOM New Cons New DOM Homes Resold Resold DOM New Cons New DOM 11 8 13 3 6 1 17 1 0 1 0 12 2 0 1 8 5 1 11 1 40 1 47 16 1 17 1 17 2 0 REALTORS DIGEST
4 YEAR TREND
**Overbid / Underbid: 100 is list price paid. Under 100 means sold for less than asking, over 100 sold probably in multiples and over asking.
Note: Square Footage calculation could be more or less (+-) 20% difference. (Based on calculation.)
* Middle Range Variance $749,469 Middle Range Variance is future range Typical Home Price (Median) Price will vary by. Never more, Never less.
TheMLS/CLAW (Combined Los Angeles Westside)
For questions, comments, a tailor-made report for your home area, or a complimentary home valuation please contact LeHoa Gacki
$1,200,000 $1,225,500 $1,324,344 $1,342,500 $1,315,000 $1,556,000 $1,595,000 $1,618,375 $1,692,500 $1,784,750 $2,018,750 $2,091,969 $$500,000 $1,000,000 $1,500,000 $2,000,000 $2,500,000 May 01, 2019 to Apr 30, 2020 May 01, 2020 to Apr 30, 2021 May 01, 2021 to Apr 30, 2022 May 01, 2022 to Apr 30, 2023 Mid-Low Typical Home Price-Median Mid-High
LeHoa Gacki, DRE #01422855 Douglas Elliman Real Estate 11990 San Vicente Blvd., #100, L.A., Ca 90049 Email: Lehoa.Gacki@elliman.com Tel | Fax: (424) 276-7587 www.Lehoagacki.com | Lehoagacki.elliman.com 4 YEAR OBSERVATION Sawtelle Number of Homes Sold: 70 76 94 64 May 01, 2019 to Apr 30, 2020 May 01, 2020 to Apr 30, 2021 May 01, 2021 to Apr 30, 2022 May 01, 2022 to Apr 30, 2023 Actual Lowest Sold $810,000 $879,120 $1,010,000 $750,000 Mid-Low $1,200,000 $1,225,500 $1,324,344 $1,342,500 Typical Home Price-Median $1,315,000 $1,556,000 $1,595,000 $1,618,375 Mid-High $1,692,500 $1,784,750 $2,018,750 $2,091,969 Actual Highest Sold $3,175,000 $3,250,000 $3,350,000 $3,350,000 Average Price Sold $1,487,636 $1,582,916 $1,735,067 $1,790,948 12 MONTH OBSERVATION Sawtelle Cumulative 12 months sold home analysis from: May 01, 2022 to April 30, 2023 64 Sold Sold Price **Overbid / Underbid Square Feet Price per/SqFt YB LotSqFt BD BA Days on Market Actual Lowest Sold $750,000 94 700 $1,071 1924 2,162 2 2 89 Mid-Low* $1,342,500 95 1,179 $889 1939 4,993 2 2 9 Typical Home Price-Median* $1,618,375 100 1,542 $1,039 1947 5,790 3 2 16 Mid-High* $2,091,969 103 2,228 $1,209 1961 6,407 4 3 35 Actual Highest Sold $3,350,000 100 649 $5,162 1939 4,275 2 1 0 Average $1,790,948 100 1,699 $1,150 1955 5,581 3 2 24
© 2022 LEHOA GACKI. DRE# 01422855. ALL WORLDWIDE RIGHTS RESERVED. DOUGLAS ELLIMAN REAL ESTATE. 150 EL CAMINO DRIVE, BEVERLY HILLS, CA 90212. 310.595.3888. ALL MATERIAL PRESENTED HEREIN IS INTENDED FOR INFORMATION PURPOSES ONLY AND NOT INTENDED TO CONSTITUTE PROFESSIONAL ADVICE OR WARRANTY OUTSIDE THE REALM OF REAL ESTATE BROKERAGE. MAPS CREATED FOR REFERENCE PURPOSE ONLY. WHILE THIS INFORMATION IS BELIEVED TO BE CORRECT, IT IS REPRESENTED SUBJECT TO ERRORS, OMISSIONS, CHANGES OR WITHDRAWAL WITHOUT NOTICE. BASED ON DATA SOURCED FROM THE COMBINED LOS ANGELES WESTSIDE MULTIPLE LISTING SERVICE AND PUBLIC RECORDS. STATISTICS ARE SUBJECT TO CHANGE DUE TO INDIVIDUAL REAL ESTATE COMPANY REPORTING DISCIPLINES. BUYER ADVANTAGE OR SELLER ADVANTAGE IS STRICTLY OF THE OPINION OF LEHOA GACKI AND ACCURACY CANNOT BE GUARANTEED AND MAY NOT REFLECT ALL REAL ESTATE ACTIVITY ON THE MARKET. ALL PROPERTY INFORMATION, INCLUDING, BUT NOT LIMITED TO MAPS, GRAPHS, DEPICTIONS, SQUARE FOOTAGE, ROOM COUNT, NUMBER OF BEDROOMS AND THE SCHOOL DISTRICT IN PROPERTY LISTINGS SHOULD BE VERIFIED BY YOUR OWN ATTORNEY, ARCHITECT OR ZONING EXPERT. NEW CONSTRUCTION COUNT, SQUARE FOOTAGE AND YEAR BUILT IS BASED ON INDIVIDUAL REAL ESTATE COMPANY REPORTING AND MAY BE DIFFERENT THAN PUBLIC RECORDS. NEW CONSTRUCTION COUNT IS BASED ON LISTING BROKERAGE LISTING YEAR. THE BROKER/AGENT PROVIDING THE INFORMATION CONTAINED HEREIN MAY OR MAY HAVE NOT BEEN THE LISTING AND/OR SELLING AGENT. THIS IS NOT INTENDED TO SOLICIT PROPERTY ALREADY LISTED. EQUAL HOUSING OPPORTUNITY. NEIGHBORHOOD BOUNDARY SOURCE: PUBLIC RECORDS, COMBINED LOS ANGELES WESTSIDE MULTIPLE LISTING SERVICE AND LOS ANGELES TIMES MAPPING L.A. https://maps.latimes.com/neighborhoods/index.html
Source:
SAWTELLE
SOLD HOME PRICE PER SQUARE FOOT - PRE & POST MAR 2020 PANDEMIC
$778 $844 $885 $959 $934 $967 $1,080 $1,028 $835 $899 $937 $954 $1,018 $1,028 $1,080 $1,067 $$200 $400 $600 $800 $1,000 $1,200 Jan 01 to Jun 30, 2019 Jul 01 to Dec 31, 2019 Jan 01 to Jun 30, 2020 Jul 01 to Dec 31, 2020 Jan 01 to Jun 30, 2021 Jul 01 to Dec 31, 2021 Jan 01 to Jun 30, 2022 Jul 01 to Dec 31, 2022 Median Price Per Square Foot Average Price per SquareFt 31 36 15 18 27 23 14 285 10 15 20 25 30 35 40 Jan 01 to Jun 30, 2019 Jul 01 to Dec 31, 2019 Jan 01 to Jun 30, 2020 Jul 01 to Dec 31, 2020 Jan 01 to Jun 30, 2021 Jul 01 to Dec 31, 2021 Jan 01 to Jun 30, 2022 Jul 01 to Dec 31, 2022 Number of Homes Sold 43 34 28 50 41 50 35 31 Days on Market before Sold 1.7 1.5 2.4 2.8 2.5 1.1 0.0 0.5 1.0 1.5 2.0 2.5 3.0 Nov 30, 2022 Dec 31, 2022 Jan 31, 2023 Feb 28, 2023 Mar 31, 2023 Apr 30, 2023 Number of months it would take to sell all properties Active for sale if no new listings entered the market. END OF SAWTELLE 6 PAGE REPORT
DAYS ON MARKET BEFORE SOLD-
PANDEMIC MONTHS SUPPLY OF INVENTORY - BASED ON LAST FEW MONTHS OF HOME SALES 3 and Under Favors Seller 4-6 = Balanced Market 7 and over Favors Buyer SAWTELLE SAWTELLE SAWTELLE
PRE & POST MAR 2020
For questions, comments, a tailor-made report for your home area, or a complimentary home valuation please contact LeHoa Gacki
NEIGHBORING AREAS:
**Overbid/Underbid: 100 is list price paid. Under 100 means sold for less than asking, over 100 sold probably in multiples and over asking.
Note: Square Footage calculation could be more or less (+-) 20% difference. (Based on calculation.)
Single Family Homes April 2023 $2,755,000 TYPICAL HOME PRICE (MEDIAN) $1,461 SOLD PRICE PER SQUARE FOOT 46 DAYS ON MARKET BEFORE SOLD (DOM) $1,800,817 MID-LOW $4,300,000 MID-HIGH VENICE Marina Del Rey Del Rey Mar Vista Santa Monica Culver City LeHoa’s Neighborhood Data Charts Los Angeles Real Estate LNDC APRIL 2023
LeHoa Gacki Douglas Elliman Real Estate DRE #01422855 Lehoa.Gacki@elliman.com www.LeHoaGacki.com 424.276.7587 Venice A neighborhood in the City of Los Angeles WHAT YOUR MONEY BUYS YOU THIS MONTH CLICK HERE FOR MORE Venice Home Analysis from: April 01, 2023 to April 30, 2023 19 Sold Sold Price **Overbid/ Underbid Square Feet Price per/SqFt YB LotSqFt BD BA Days on Market Actual Lowest Sold $1,430,000 96 704 $2,031 1922 2,987 2 2 47 Mid-Low* $1,800,817 95 1,204 $1,099 1924 2,848 2 2 11 Typical Home Price (Median)* $2,755,000 98 1,603 $1,461 1953 3,900 3 3 46 Mid-High* $4,300,000 102 3,408 $1,922 2003 5,751 4 4 62 Actual Highest Sold $7,500,000 94 7,034 $1,066 2019 10,882 5 7 83 Average $3,116,490 99 2,355 $1,585 1965 4,673 3 3 41
Middle Range Variance $2,499,183 Middle Range Variance is future range Typical Home Price (Median) Price will vary by. Never more, Never less. Source: TheMLS/CLAW (Combined Los Angeles Westside)
*
Area Typical Home Price (Median) Price per/ SqFt Days on Market Mid-Low Mid-High Homes Sold Santa Monica $2,700,000 $1,425 8 $2,052,500 $5,495,356 13 Mar Vista $1,795,000 $1,105 10 $1,544,000 $2,235,000 17 Culver City $1,601,000 $1,190 29 $1,400,000 $1,930,000 7 Del Rey $1,504,000 $1,069 12 $1,271,500 $2,443,250 9
Buyer or Seller Advantage by Price Point for Venice as of April 30, 2023
Months supply of Inventory =
4-6 = BALANCED MARKET
3 and under FAVORS SELLER
7 and over FAVORS BUYER
$2,500,000 $2,749,999 SELLER ADVANTAGE
$2,250,000 $2,499,999 SELLER ADVANTAGE $2,000,000 $2,249,999 SELLER ADVANTAGE $1,750,000 $1,999,999 SELLER ADVANTAGE
$1,500,000 $1,749,999 SELLER ADVANTAGE $1,250,000 $1,499,999 SELLER ADVANTAGE
$1,000,000 $1,249,999 SELLER ADVANTAGE
$750,000 $999,999
HOME PRICE RANGE $15,000,000 $20,000,000 $12,000,000 $14,999,999 $11,000,000 $11,999,999 $10,000,000 $10,999,999 BUYER ADVANTAGE $9,000,000 $9,999,999 BUYER ADVANTAGE $8,000,000 $8,999,999 $7,500,000 $7,999,999 SELLER ADVANTAGE $7,000,000 $7,499,999 SELLER ADVANTAGE $6,500,000 $6,999,999 SELLER ADVANTAGE $6,000,000 $6,499,999 SELLER ADVANTAGE BUYER ADVANTAGE $5,500,000 $5,999,999 $4,750,000 $5,499,999 SELLER ADVANTAGE $4,500,000 $4,749,999 $4,250,000 $4,499,999 $4,000,000 $4,249,999 BUYER ADVANTAGE $3,750,000 $3,999,999 $3,500,000 $3,749,999 BUYER ADVANTAGE $3,250,000 $3,499,999 $3,000,000 $3,249,999 SELLER ADVANTAGE $2,750,000 $2,999,999 SELLER ADVANTAGE
Based on last 3 months of homes sales, Venice has 3.3 months supply of inventory.
View
homes below Contact for up to date homes for sale
Venice Inventory for New Construction and Resale of Homes as of
& DEMAND
TheMLS/CLAW
Westside) Under Contract Pending - Closing Soon New Construction New Con DOM Resale Resale DOM Home Price Range Homes Resold 8 7 6 31 55 73 13 $750,000 $999,999 $1,000,000 $1,249,999 1 2 $1,250,000 $1,499,999 1 2 72 $1,500,000 $1,749,999 2 1 2 7 63 $1,750,000 $1,999,999 4 2 1 3 67 $2,000,000 $2,249,999 2 1 1 6 49 $2,250,000 $2,499,999 6 28 $2,500,000 $2,749,999 2 1 7 $2,750,000 $2,999,999 1 1 1 5 $3,000,000 $3,249,999 1 2 4 4 58 $3,250,000 $3,499,999 3 57 $3,500,000 $3,749,999 2 12 5 46 $3,750,000 $3,999,999 1 2 107 $4,000,000 $4,249,999 1 52 4 191 $4,250,000 $4,499,999 1 $4,500,000 $4,749,999 1 101 2 83 $4,750,000 $5,499,999 3 52 $5,500,000 $5,999,999 $6,000,000 $6,499,999 1 1 315 $6,500,000 $6,999,999 1 112 $7,000,000 $7,499,999 $7,500,000 $7,999,999 2 59 $8,000,000 $8,999,999 1 286 $9,000,000 $9,999,999 $10,000,000 $10,999,999 $11,000,000 $11,999,999 $12,000,000 $14,999,999 $15,000,000 $20,000,000 REALTORS
SELLER ADVANTAGE SUPPLY
For Sale Source:
(Combined Los Angeles
of April 30, 2023
DEMAND
Based on last 3 months of homes sales, Bel-Air has 7.9 months supply of inventory.
BUYER / INVESTOR ADVANTAGE
Sold Homes Days on Market Before Sold = DOM February March April Resold DOM New Cons New DOM Homes Resold Resold DOM New Cons New DOM Homes Resold Resold DOM New Cons New DOM 46 3 41 19 28 2 106 18 39 1 91 17 2 16 1 47 31 4 66 2 7 46 1 0 3 12 14 2 18 2 36 2 28 20 3 22 1 52 1 88 2 9 3 51 128 2 23 1 11 1 42 1 46 146 1 26 1 91 1 20 1 0 2 85 1 169 1 16 1 83
REALTORS DIGEST
4 YEAR TREND
**Overbid / Underbid: 100 is list price paid. Under 100 means sold for less than asking, over 100 sold probably in multiples and over asking.
Note: Square Footage calculation could be more or less (+-) 20% difference. (Based on calculation.)
* Middle Range Variance $1,485,125 Middle Range Variance is future range Typical Home Price (Median) Price will vary by. Never more, Never less.
TheMLS/CLAW (Combined Los Angeles Westside)
For questions, comments, a tailor-made report for your home area, or a complimentary home valuation please contact LeHoa Gacki
$1,605,000 $1,700,000 $1,807,500 $1,802,375 $2,015,000 $2,052,500 $2,482,500 $2,310,000 $2,705,000 $2,725,000 $3,216,250 $3,287,500 $$500,000 $1,000,000 $1,500,000 $2,000,000 $2,500,000 $3,000,000 $3,500,000 May 01, 2019 to Apr 30, 2020 May 01, 2020 to Apr 30, 2021 May 01, 2021 to Apr 30, 2022 May 01, 2022 to Apr 30, 2023
Typical Home Price-Median Mid-High
Mid-Low
LeHoa Gacki, DRE #01422855 Douglas Elliman Real Estate 11990 San Vicente Blvd., #100, L.A., Ca 90049 Email: Lehoa.Gacki@elliman.com Tel | Fax: (424) 276-7587 www.Lehoagacki.com | Lehoagacki.elliman.com 4 YEAR OBSERVATION Venice Number of Homes Sold: 201 294 358 224 May 01, 2019 to Apr 30, 2020 May 01, 2020 to Apr 30, 2021 May 01, 2021 to Apr 30, 2022 May 01, 2022 to Apr 30, 2023 Actual Lowest Sold $1,025,000 $660,000 $1,025,000 $950,000 Mid-Low $1,605,000 $1,700,000 $1,807,500 $1,802,375 Typical Home Price-Median $2,015,000 $2,052,500 $2,482,500 $2,310,000 Mid-High $2,705,000 $2,725,000 $3,216,250 $3,287,500 Actual Highest Sold $9,050,000 $6,800,000 $9,000,000 $10,000,000 Average Price Sold $2,292,543 $2,259,972 $2,688,411 $2,748,091 12 MONTH
Venice Cumulative 12 months sold home analysis from: May 01, 2022 to April 30, 2023 224 Sold Sold Price **Overbid / Underbid Square Feet Price per/SqFt YB LotSqFt BD BA Days on Market Actual Lowest Sold $950,000 97 484 $1,963 1922 1,573 1 1 138 Mid-Low* $1,802,375 95 1,236 $1,032 1925 2,852 2 2 11 Typical Home Price-Median* $2,310,000 99 1,912 $1,300 1951 4,000 3 3 20 Mid-High* $3,287,500 101 2,769 $1,659 2001 5,240 4 4 51 Actual Highest Sold $10,000,000 83 4,043 $2,473 1966 3,801 6 6 62 Average $2,748,091 99 2,164 $1,400 1962 4,704 3 3 38
OBSERVATION
Source:
© 2022 LEHOA GACKI. DRE# 01422855. ALL WORLDWIDE RIGHTS RESERVED. DOUGLAS ELLIMAN REAL ESTATE. 150 EL CAMINO DRIVE, BEVERLY HILLS, CA 90212. 310.595.3888. ALL MATERIAL PRESENTED HEREIN IS INTENDED FOR INFORMATION PURPOSES ONLY AND NOT INTENDED TO CONSTITUTE PROFESSIONAL ADVICE OR WARRANTY OUTSIDE THE REALM OF REAL ESTATE BROKERAGE. MAPS CREATED FOR REFERENCE PURPOSE ONLY. WHILE THIS INFORMATION IS BELIEVED TO BE CORRECT, IT IS REPRESENTED SUBJECT TO ERRORS, OMISSIONS, CHANGES OR WITHDRAWAL WITHOUT NOTICE. BASED ON DATA SOURCED FROM THE COMBINED LOS ANGELES WESTSIDE MULTIPLE LISTING SERVICE AND PUBLIC RECORDS. STATISTICS ARE SUBJECT TO CHANGE DUE TO INDIVIDUAL REAL ESTATE COMPANY REPORTING DISCIPLINES. BUYER ADVANTAGE OR SELLER ADVANTAGE IS STRICTLY OF THE OPINION OF LEHOA GACKI AND ACCURACY CANNOT BE GUARANTEED AND MAY NOT REFLECT ALL REAL ESTATE ACTIVITY ON THE MARKET. ALL PROPERTY INFORMATION, INCLUDING, BUT NOT LIMITED TO MAPS, GRAPHS, DEPICTIONS, SQUARE FOOTAGE, ROOM COUNT, NUMBER OF BEDROOMS AND THE SCHOOL DISTRICT IN PROPERTY LISTINGS SHOULD BE VERIFIED BY YOUR OWN ATTORNEY, ARCHITECT OR ZONING EXPERT. NEW CONSTRUCTION COUNT, SQUARE FOOTAGE AND YEAR BUILT IS BASED ON INDIVIDUAL REAL ESTATE COMPANY REPORTING AND MAY BE DIFFERENT THAN PUBLIC RECORDS. NEW CONSTRUCTION COUNT IS BASED ON LISTING BROKERAGE LISTING YEAR. THE BROKER/AGENT PROVIDING THE INFORMATION CONTAINED HEREIN MAY OR MAY HAVE NOT BEEN THE LISTING AND/OR SELLING AGENT. THIS IS NOT INTENDED TO SOLICIT PROPERTY ALREADY LISTED. EQUAL HOUSING OPPORTUNITY. NEIGHBORHOOD BOUNDARY SOURCE: PUBLIC RECORDS, COMBINED LOS ANGELES WESTSIDE MULTIPLE LISTING SERVICE AND LOS ANGELES TIMES MAPPING L.A. https://maps.latimes.com/neighborhoods/index.html VENICE
$1,062 $1,100 $1,076 $1,045 $1,132 $1,148 $1,269 $1,267 $1,185 $1,165 $1,132 $1,153 $1,197 $1,231 $1,351 $1,339 $$200 $400 $600 $800 $1,000 $1,200 $1,400 $1,600 Jan 01 to Jun 30, 2019 Jul 01 to Dec 31, 2019 Jan 01 to Jun 30, 2020 Jul 01 to Dec 31, 2020 Jan 01 to Jun 30, 2021 Jul 01 to Dec 31, 2021 Jan 01 to Jun 30, 2022 Jul 01 to Dec 31, 2022 Median Price Per Square Foot Average Price per SquareFt 34 42 37 31 32 33 15 255 10 15 20 25 30 35 40 45 Jan 01 to Jun 30, 2019 Jul 01 to Dec 31, 2019 Jan 01 to Jun 30, 2020 Jul 01 to Dec 31, 2020 Jan 01 to Jun 30, 2021 Jul 01 to Dec 31, 2021 Jan 01 to Jun 30, 2022 Jul 01 to Dec 31, 2022 Number of Homes Sold 89 111 83 162 171 182 165 102 Days on Market before Sold 5.0 4.6 5.4 5.1 4.1 3.3 0.0 1.0 2.0 3.0 4.0 5.0 6.0 Nov 30, 2022 Dec 31, 2022 Jan 31, 2023 Feb 28, 2023 Mar 31, 2023 Apr 30, 2023 Number of months it would take to sell all properties Active for sale if no new listings entered the market. END OF VENICE 6 PAGE REPORT
PER SQUARE FOOT
PRE & POST
PANDEMIC DAYS ON MARKET BEFORE SOLD- PRE & POST MAR 2020 PANDEMIC MONTHS SUPPLY OF INVENTORY - BASED ON LAST FEW MONTHS OF HOME SALES 3 and Under Favors Seller 4-6 = Balanced Market 7 and over Favors Buyer VENICE VENICE VENICE
SOLD HOME PRICE
-
MAR 2020
**Overbid/Underbid: 100 is list price paid. Under 100 means sold for less than asking, over 100 sold probably in multiples and over asking. Note: Square Footage calculation could be more or less (+-) 20% difference. (Based on calculation.)
Single Family Homes April 2023 $1,875,000 TYPICAL HOME PRICE (MEDIAN) $1,131 SOLD PRICE PER SQUARE FOOT 6 DAYS ON MARKET BEFORE SOLD (DOM) $1,775,000 ACTUAL LOWEST SOLD $2,250,000 ACTUAL HIGHEST SOLD For questions, comments, a tailor-made report for your home area, or a complimentary home valuation please contact LeHoa Gacki
Gacki Douglas Elliman Real Estate DRE #01422855 Lehoa.Gacki@elliman.com www.LeHoaGacki.com 424.276.7587 LeHoa’s Neighborhood Data Charts Los Angeles Real Estate LNDC APRIL 2023
Angeles A neighborhood in the City of Los Angeles WEST LOS ANGELES Century City Westwood Rancho Park Cheviot Hills Sawtelle WHAT YOUR MONEY BUYS YOU THIS MONTH CLICK HERE FOR MORE West Los Angeles Home Analysis from: April 01, 2023 to April 30, 2023 3 Sold Sold Price **Overbid/ Underbid Square Feet Price per/SqFt YB LotSqFt BD BA Days on Market Actual Lowest Sold $1,775,000 105 1,536 $1,156 1937 5,053 3 2 39 Typical Home Price (Median)* $1,875,000 100 1,666 $1,131 1930 6,076 3 2 6 Actual Highest Sold $2,250,000 100 1,990 $1,131 1930 6,076 4 3 0 Average $1,966,667 101 1,731 $1,137 1931 5,961 3 2 15
LeHoa
West Los
* Middle Range Variance $475,000 Middle Range Variance is future range Typical Home Price (Median)
vary
Never more, Never less. Source: TheMLS/CLAW (Combined Los Angeles Westside)
Area Typical Home Price (Median) Price per/ SqFt Days on Market Mid-Low Mid-High Homes Sold Westwood $3,333,300 $1,080 9 $2,374,000 $3,620,590 7 Century City $2,180,000 $954 87 $2,085,000 $2,275,000 2 Cheviot Hills $2,962,500 $1,283 4 $2,317,500 $4,532,500 6 Rancho Park $1,350,000 $1,331 5 $1,350,000 $1,350,000 1 Sawtelle $1,719,125 $994 10 $1,225,188 $2,596,875 4
Price will
by.
NEIGHBORING AREAS:
Buyer or Seller Advantage by Price Point for West Los Angeles as of April 30, 2023
Months supply of Inventory =
4-6 = BALANCED MARKET
Based on last 3 months of homes sales, West Los Angeles has 3.7 months supply of inventory.
$3,699,999
3 and under FAVORS SELLER
7 and over FAVORS BUYER
$3,249,999
$3,099,999
$2,799,999
$2,649,999
$2,499,999
$2,349,999
$2,199,999
$1,899,999
$1,449,999
$1,299,999
$1,149,999
$999,999
$749,999
HOME PRICE RANGE $6,000,000
BUYER
$5,000,000
$4,450,000
$4,300,000
$4,150,000
$4,000,000
$3,550,000
BUYER
BUYER
$3,100,000
$2,950,000
$2,800,000
$2,650,000
$2,500,000
$2,350,000
$2,200,000
SELLER
$2,050,000
SELLER
$1,750,000
SELLER
$1,450,000
$1,300,000
$1,150,000
SELLER
$1,000,000
$750,000
$500,000
$10,000,000
ADVANTAGE
$5,999,999
$4,999,999
$4,449,999
$4,299,999
$4,149,999 BUYER ADVANTAGE $3,850,000 $3,999,999 BUYER ADVANTAGE $3,700,000 $3,849,999
ADVANTAGE $3,400,000 $3,549,999
ADVANTAGE $3,250,000 $3,399,999
$2,949,999 BUYER ADVANTAGE
ADVANTAGE
ADVANTAGE BUYER ADVANTAGE $1,900,000 $2,049,999
ADVANTAGE $1,600,000 $1,749,999 SELLER ADVANTAGE
$1,599,999 SELLER ADVANTAGE
ADVANTAGE
View homes below Contact for up to date homes for sale
West Los Angeles Inventory for New Construction and Resale of
SELLER ADVANTAGE SUPPLY
For Sale
Homes
& DEMAND
Under Contract Pending - Closing Soon New Construction New Con DOM Resale Resale DOM Home Price Range Homes Resold 2 2 2 10 9 34 3 $500,000 $749,999 $750,000 $999,999 $1,000,000 $1,149,999 $1,150,000 $1,299,999 $1,300,000 $1,449,999 1 3 $1,450,000 $1,599,999 2 1 4 $1,600,000 $1,749,999 1 2 10 $1,750,000 $1,899,999 1 1 76 $1,900,000 $2,049,999 1 $2,050,000 $2,199,999 1 1 $2,200,000 $2,349,999 $2,350,000 $2,499,999 $2,500,000 $2,649,999 1 49 $2,650,000 $2,799,999 $2,800,000 $2,949,999 $2,950,000 $3,099,999 $3,100,000 $3,249,999 1 21 $3,250,000 $3,399,999 1 5 $3,400,000 $3,549,999 $3,550,000 $3,699,999 1 87 $3,700,000 $3,849,999 1 14 $3,850,000 $3,999,999 $4,000,000 $4,149,999 $4,150,000 $4,299,999 $4,300,000 $4,449,999 $4,450,000 $4,999,999 1 42 $5,000,000 $5,999,999 $6,000,000 $10,000,000 REALTORS
Source: TheMLS/CLAW (Combined Los Angeles Westside)
Homes as of April 30, 2023
Based on last 3 months of homes sales, Bel-Air has 7.9 months supply of inventory.
BUYER / INVESTOR ADVANTAGE
DEMAND
Sold Homes Days on Market Before Sold = DOM February March April Resold DOM New Cons New DOM Homes Resold Resold DOM New Cons New DOM Homes Resold Resold DOM New Cons New DOM 51 3 46 3 15 1 13 71 1 103 1 21 11 2 23 1 0
REALTORS DIGEST
4 YEAR TREND
**Overbid / Underbid: 100 is list price paid. Under 100 means sold for less than asking, over 100 sold probably in multiples and over asking.
Note: Square Footage calculation could be more or less (+-) 20% difference. (Based on calculation.)
* Middle Range Variance $696,013 Middle Range Variance is future range Typical Home Price (Median) Price will vary by. Never more, Never less.
TheMLS/CLAW (Combined Los Angeles Westside)
For questions, comments, a tailor-made report for your home area, or a complimentary home valuation please contact LeHoa Gacki
$1,695,000 $1,710,313 $1,720,000 $1,717,500 $1,869,500 $2,027,500 $1,975,000 $1,945,000 $2,338,500 $2,479,375 $2,565,000 $2,413,513 $$500,000 $1,000,000 $1,500,000 $2,000,000 $2,500,000 $3,000,000 May 01, 2019 to Apr 30, 2020 May 01, 2020 to Apr 30, 2021 May 01, 2021 to Apr 30, 2022 May 01, 2022 to Apr 30, 2023
Typical
Mid-High
Mid-Low
Home Price-Median
LeHoa Gacki, DRE #01422855 Douglas Elliman Real Estate 11990 San Vicente Blvd., #100, L.A., Ca 90049 Email: Lehoa.Gacki@elliman.com Tel | Fax: (424) 276-7587 www.Lehoagacki.com | Lehoagacki.elliman.com 4 YEAR OBSERVATION West Los Angeles Number of Homes Sold: 54 60 71 45 May 01, 2019 to Apr 30, 2020 May 01, 2020 to Apr 30, 2021 May 01, 2021 to Apr 30, 2022 May 01, 2022 to Apr 30, 2023 Actual Lowest Sold $1,325,000 $1,300,000 $1,200,000 $1,150,000 Mid-Low $1,695,000 $1,710,313 $1,720,000 $1,717,500 Typical Home Price-Median $1,869,500 $2,027,500 $1,975,000 $1,945,000 Mid-High $2,338,500 $2,479,375 $2,565,000 $2,413,513 Actual Highest Sold $3,950,000 $4,750,000 $3,420,000 $3,607,000 Average Price Sold $2,109,399 $2,168,572 $2,116,238 $2,121,448 12 MONTH OBSERVATION West Los Angeles Cumulative 12 months sold home analysis from: May 01, 2022 to April 30, 2023 45 Sold Sold Price **Overbid / Underbid Square Feet Price per/SqFt YB LotSqFt BD BA Days on Market Actual Lowest Sold $1,150,000 96 785 $1,465 1952 4,761 2 1 89 Mid-Low* $1,717,500 97 1,499 $989 1927 5,400 2 2 9 Typical Home Price-Median* $1,945,000 100 1,907 $1,135 1930 6,212 3 2 12 Mid-High* $2,413,513 107 2,201 $1,258 1939 6,750 4 3 23 Actual Highest Sold $3,607,000 96 3,754 $961 2017 6,749 5 5 9 Average $2,121,448 102 1,939 $1,142 1943 5,866 3 3 22
Source:
© 2022 LEHOA GACKI. DRE# 01422855. ALL WORLDWIDE RIGHTS RESERVED. DOUGLAS ELLIMAN REAL ESTATE. 150 EL CAMINO DRIVE, BEVERLY HILLS, CA 90212. 310.595.3888. ALL MATERIAL PRESENTED HEREIN IS INTENDED FOR INFORMATION PURPOSES ONLY AND NOT INTENDED TO CONSTITUTE PROFESSIONAL ADVICE OR WARRANTY OUTSIDE THE REALM OF REAL ESTATE BROKERAGE. MAPS CREATED FOR REFERENCE PURPOSE ONLY. WHILE THIS INFORMATION IS BELIEVED TO BE CORRECT, IT IS REPRESENTED SUBJECT TO ERRORS, OMISSIONS, CHANGES OR WITHDRAWAL WITHOUT NOTICE. BASED ON DATA SOURCED FROM THE COMBINED LOS ANGELES WESTSIDE MULTIPLE LISTING SERVICE AND PUBLIC RECORDS. STATISTICS ARE SUBJECT TO CHANGE DUE TO INDIVIDUAL REAL ESTATE COMPANY REPORTING DISCIPLINES. BUYER ADVANTAGE OR SELLER ADVANTAGE IS STRICTLY OF THE OPINION OF LEHOA GACKI AND ACCURACY CANNOT BE GUARANTEED AND MAY NOT REFLECT ALL REAL ESTATE ACTIVITY ON THE MARKET. ALL PROPERTY INFORMATION, INCLUDING, BUT NOT LIMITED TO MAPS, GRAPHS, DEPICTIONS, SQUARE FOOTAGE, ROOM COUNT, NUMBER OF BEDROOMS AND THE SCHOOL DISTRICT IN PROPERTY LISTINGS SHOULD BE VERIFIED BY YOUR OWN ATTORNEY, ARCHITECT OR ZONING EXPERT. NEW CONSTRUCTION COUNT, SQUARE FOOTAGE AND YEAR BUILT IS BASED ON INDIVIDUAL REAL ESTATE COMPANY REPORTING AND MAY BE DIFFERENT THAN PUBLIC RECORDS. NEW CONSTRUCTION COUNT IS BASED ON LISTING BROKERAGE LISTING YEAR. THE BROKER/AGENT PROVIDING THE INFORMATION CONTAINED HEREIN MAY OR MAY HAVE NOT BEEN THE LISTING AND/OR SELLING AGENT. THIS IS NOT INTENDED TO SOLICIT PROPERTY ALREADY LISTED. EQUAL HOUSING OPPORTUNITY. NEIGHBORHOOD BOUNDARY SOURCE: PUBLIC RECORDS, COMBINED LOS ANGELES WESTSIDE MULTIPLE LISTING SERVICE AND LOS ANGELES TIMES MAPPING L.A. https://maps.latimes.com/neighborhoods/index.html
WEST LOS ANGELES
$968 $903 $911 $979 $976 $1,114 $1,111 $1,147 $970 $972 $931 $1,023 $996 $1,127 $1,130 $1,136 $$200 $400 $600 $800 $1,000 $1,200 $1,400 Jan 01 to Jun 30, 2019 Jul 01 to Dec 31, 2019 Jan 01 to Jun 30, 2020 Jul 01 to Dec 31, 2020 Jan 01 to Jun 30, 2021 Jul 01 to Dec 31, 2021 Jan 01 to Jun 30, 2022 Jul 01 to Dec 31, 2022 Median Price Per Square Foot Average Price per SquareFt 37 22 33 18 10 16 11 155 10 15 20 25 30 35 40 Jan 01 to Jun 30, 2019 Jul 01 to Dec 31, 2019 Jan 01 to Jun 30, 2020 Jul 01 to Dec 31, 2020 Jan 01 to Jun 30, 2021 Jul 01 to Dec 31, 2021 Jan 01 to Jun 30, 2022 Jul 01 to Dec 31, 2022 Number of Homes Sold 36 27 9 35 39 33 34 21 Days on Market before Sold 1.1 0.8 1.0 1.5 2.0 3.7 0.0 0.5 1.0 1.5 2.0 2.5 3.0 3.5 4.0 Nov 30, 2022 Dec 31, 2022 Jan 31, 2023 Feb 28, 2023 Mar 31, 2023 Apr 30, 2023 Number of months it would take to sell all properties Active for sale if no new listings entered the market. END OF WEST LOS ANGELES 6 PAGE REPORT
PER SQUARE
- PRE & POST
PANDEMIC DAYS ON MARKET BEFORE SOLD- PRE & POST MAR 2020 PANDEMIC MONTHS SUPPLY OF INVENTORY - BASED ON LAST FEW MONTHS OF HOME SALES 3 and Under Favors Seller 4-6 = Balanced Market 7 and over Favors Buyer WEST LOS ANGELES WEST LOS ANGELES WEST LOS ANGELES
SOLD HOME PRICE
FOOT
MAR 2020
NEIGHBORING AREAS:
**Overbid/Underbid: 100 is list price paid. Under 100 means sold for less than asking, over 100 sold probably in multiples and over asking.
Note: Square Footage calculation could be more or less (+-) 20% difference. (Based on calculation.) *
LeHoa’s Neighborhood Data Charts Los Angeles Real Estate LNDC APRIL 2023 For questions, comments, a tailor-made report for your home area, or a complimentary home valuation please contact LeHoa Gacki LeHoa Gacki Douglas Elliman Real Estate DRE #01422855 Lehoa.Gacki@elliman.com www.LeHoaGacki.com 424.276.7587 Westwood A neighborhood in the City of Los Angeles Sawtelle WESTWOOD West Los Angeles Beverly Hills Century City Bel Air Brentwood Holmby Hills WHAT YOUR MONEY BUYS YOU THIS MONTH CLICK HERE FOR MORE Westwood Home Analysis from: April 01, 2023 to April 30, 2023 7 Sold Sold Price **Overbid/ Underbid Square Feet Price per/SqFt YB LotSqFt BD BA Days on Market Actual Lowest Sold $2,340,000 111 2,166 $1,080 1933 6,505 4 2 9 Mid-Low* $2,374,000 100 2,389 $935 1933 7,042 3 3 7 Typical Home Price (Median)* $3,333,300 103 2,947 $1,080 1938 7,192 4 3 9 Mid-High* $3,620,590 111 3,316 $1,131 1952 8,101 4 4 11 Actual Highest Sold $3,650,000 97 4,097 $891 1939 8,775 3 4 18 Average $3,113,984 104 2,951 $1,070 1941 7,482 4 3 9
$1,246,590 Middle
Typical Home
(Median)
will vary
Never more, Never less. Source: TheMLS/CLAW (Combined Los Angeles
April 2023 $3,333,300 TYPICAL HOME PRICE (MEDIAN) $1,080 SOLD PRICE PER SQUARE FOOT 9 DAYS ON MARKET BEFORE SOLD (DOM) $2,374,000 ACTUAL LOWEST SOLD $3,620,590 ACTUAL HIGHEST SOLD
Middle Range Variance
Range Variance is future range
Price
Price
by.
Westside) Single Family Homes
Area Typical Home Price (Median) Price per/ SqFt Days on Market Mid-Low Mid-High Homes Sold Brentwood $3,377,500 $1,313 18 $2,555,875 $4,912,499 12 Bel Air $3,716,500 $703 109 $2,533,000 $4,900,000 2 Holmby Hills - - - $- $- 0 Beverly Hills $8,250,000 $1,448 66 $3,331,000 $9,600,000 11 Century City $2,180,000 $954 87 $2,085,000 $2,275,000 2 West Los Angeles $1,875,000 $1,131 6 $1,775,000 $2,250,000 3 Sawtelle $1,719,125 $994 10 $1,225,188 $2,596,875 4
Buyer or Seller Advantage by Price Point for Westwood as of April 30, 2023
Based on last 3 months of homes sales, Westwood has 2.1 months supply of inventory.
Months supply of Inventory =
4-6 = BALANCED MARKET
3 and under FAVORS SELLER
7 and over FAVORS BUYER
$20,000,000 $30,000,000 $15,000,000 $19,999,999 $12,000,000 $14,999,999 SELLER ADVANTAGE
$11,000,000 $11,999,999 $10,000,000 $10,999,999
BUYER ADVANTAGE $9,000,000 $9,999,999 $8,000,000 $8,999,999 $7,000,000 $7,999,999 $6,500,000 $6,999,999 SELLER ADVANTAGE
$6,000,000 $6,499,999 SELLER ADVANTAGE
$5,500,000 $5,999,999 SELLER ADVANTAGE
$5,000,000 $5,499,999 SELLER ADVANTAGE
$4,750,000 $4,999,999 SELLER ADVANTAGE
$4,500,000 $4,749,999 SELLER ADVANTAGE
$4,250,000 $4,499,999 SELLER ADVANTAGE
$4,000,000 $4,249,999 $3,750,000 $3,999,999
$3,500,000 $3,749,999 SELLER ADVANTAGE
$3,250,000 $3,499,999 SELLER ADVANTAGE
$3,000,000 $3,249,999 SELLER ADVANTAGE
BUYER ADVANTAGE
$2,750,000 $2,999,999
$2,500,000 $2,749,999 SELLER ADVANTAGE
$2,250,000 $2,499,999 SELLER ADVANTAGE
$2,000,000 $2,249,999
$1,750,000 $1,999,999 SELLER ADVANTAGE
$1,500,000 $1,749,999
$1,250,000 $1,499,999
$750,000 $1,249,999
HOME PRICE RANGE
View homes below Contact for up to date homes for sale
Westwood Inventory for New Construction and Resale of Homes
& DEMAND
Under Contract Pending - Closing Soon New Construction New Con DOM Resale Resale DOM Home Price Range Homes Resold 5 2 13 33 2 $750,000 $1,249,999 $1,250,000 $1,499,999 $1,500,000 $1,749,999 1 $1,750,000 $1,999,999 $2,000,000 $2,249,999 1 3 $2,250,000 $2,499,999 1 1 27 $2,500,000 $2,749,999 3 12 $2,750,000 $2,999,999 1 24 $3,000,000 $3,249,999 1 1 1 $3,250,000 $3,499,999 1 42 $3,500,000 $3,749,999 $3,750,000 $3,999,999 $4,000,000 $4,249,999 1 2 6 $4,250,000 $4,499,999 $4,500,000 $4,749,999 2 $4,750,000 $4,999,999 $5,000,000 $5,499,999 1 52 $5,500,000 $5,999,999 $6,000,000 $6,499,999 2 86 $6,500,000 $6,999,999 1 $7,000,000 $7,999,999 $8,000,000 $8,999,999 1 66 $9,000,000 $9,999,999 $10,000,000 $10,999,999 $11,000,000 $11,999,999 $12,000,000 $14,999,999 $15,000,000 $19,999,999 $20,000,000 $30,000,000 REALTORS
SELLER ADVANTAGE SUPPLY
For Sale Source: TheMLS/CLAW (Combined Los Angeles Westside)
as of April 30, 2023
Based on last 3 months of homes sales, Bel-Air has 7.9 months supply of inventory.
BUYER / INVESTOR ADVANTAGE
DEMAND
Sold Homes Days on Market Before Sold = DOM February March April Resold DOM New Cons New DOM Homes Resold Resold DOM New Cons New DOM Homes Resold Resold DOM New Cons New DOM 6 10 18 7 9 1 11 2 9 1 32 12 1 11 2 5 2 13 1 12 1 33 1 16 1 52 1 11 1 9 0 1 5 1 0 REALTORS
DIGEST
4 YEAR TREND
**Overbid / Underbid: 100 is list price paid. Under 100 means sold for less than asking, over 100 sold probably in multiples and over asking.
Note: Square Footage calculation could be more or less (+-) 20% difference. (Based on calculation.)
* Middle Range Variance $1,837,853 Middle Range Variance is future range Typical Home Price (Median) Price will vary by. Never more, Never less.
For questions, comments, a tailor-made report for your home area, or a complimentary home valuation please contact LeHoa Gacki
$2,382,500 $2,210,000 $2,635,000 $2,680,897 $3,000,000 $2,720,000 $3,375,000 $3,354,150 $4,000,000 $3,687,500 $4,430,000 $4,518,750 $$500,000 $1,000,000 $1,500,000 $2,000,000 $2,500,000 $3,000,000 $3,500,000 $4,000,000 $4,500,000 $5,000,000 May 01, 2019 to Apr 30, 2020 May 01, 2020 to Apr 30, 2021 May 01, 2021 to Apr 30, 2022 May 01, 2022 to Apr 30, 2023 Mid-Low Typical Home Price-Median Mid-High
LeHoa Gacki, DRE #01422855 Douglas Elliman Real Estate 11990 San Vicente Blvd., #100, L.A., Ca 90049 Email: Lehoa.Gacki@elliman.com Tel | Fax: (424) 276-7587 www.Lehoagacki.com | Lehoagacki.elliman.com 4 YEAR OBSERVATION Westwood Number of Homes Sold: 77 89 111 80 May 01, 2019 to Apr 30, 2020 May 01, 2020 to Apr 30, 2021 May 01, 2021 to Apr 30, 2022 May 01, 2022 to Apr 30, 2023 Actual Lowest Sold $1,300,000 $1,712,500 $1,745,000 $1,633,000 Mid-Low $2,382,500 $2,210,000 $2,635,000 $2,680,897 Typical Home Price-Median $3,000,000 $2,720,000 $3,375,000 $3,354,150 Mid-High $4,000,000 $3,687,500 $4,430,000 $4,518,750 Actual Highest Sold $6,800,000 $8,975,000 $16,750,000 $17,470,000 Average Price Sold $3,215,614 $3,212,008 $3,945,537 $4,011,911 12 MONTH OBSERVATION Westwood Cumulative 12 months sold home analysis from: May 01, 2022 to April 30, 2023 80 Sold Sold Price **Overbid / Underbid Square Feet Price per/SqFt YB LotSqFt BD BA Days on Market Actual Lowest Sold $1,633,000 93 3,440 $475 1936 8,429 4 4 100 Mid-Low* $2,680,897 96 2,336 $1,041 1930 6,985 3 3 10 Typical Home Price-Median* $3,354,150 99 2,915 $1,156 1937 8,025 4 4 17 Mid-High* $4,518,750 108 3,879 $1,342 1949 9,349 4 5 43 Actual Highest Sold $17,470,000 92 13,000 $1,344 2022 20,004 8 11 76 Average $4,011,911 102 3,288 $1,192 1943 9,013 4 4 30
Source: TheMLS/CLAW (Combined
Angeles Westside) © 2022 LEHOA GACKI. DRE# 01422855. ALL WORLDWIDE RIGHTS RESERVED. DOUGLAS ELLIMAN REAL ESTATE. 150 EL CAMINO DRIVE, BEVERLY HILLS, CA 90212. 310.595.3888. ALL MATERIAL PRESENTED HEREIN IS INTENDED FOR INFORMATION PURPOSES ONLY AND NOT INTENDED TO CONSTITUTE PROFESSIONAL ADVICE OR WARRANTY OUTSIDE THE REALM OF REAL ESTATE BROKERAGE. MAPS CREATED FOR REFERENCE PURPOSE ONLY. WHILE THIS INFORMATION IS BELIEVED TO BE CORRECT, IT IS REPRESENTED SUBJECT TO ERRORS, OMISSIONS, CHANGES OR WITHDRAWAL WITHOUT NOTICE. BASED ON DATA SOURCED FROM THE COMBINED LOS ANGELES WESTSIDE MULTIPLE LISTING SERVICE AND PUBLIC RECORDS. STATISTICS ARE SUBJECT TO CHANGE DUE TO INDIVIDUAL REAL ESTATE COMPANY REPORTING DISCIPLINES. BUYER ADVANTAGE OR SELLER ADVANTAGE IS STRICTLY OF THE OPINION OF LEHOA GACKI AND ACCURACY CANNOT BE GUARANTEED AND MAY NOT REFLECT ALL REAL ESTATE ACTIVITY ON THE MARKET. ALL PROPERTY INFORMATION, INCLUDING, BUT NOT LIMITED TO MAPS, GRAPHS, DEPICTIONS, SQUARE FOOTAGE, ROOM COUNT, NUMBER OF BEDROOMS AND THE SCHOOL DISTRICT IN PROPERTY LISTINGS SHOULD BE VERIFIED BY YOUR OWN ATTORNEY, ARCHITECT OR ZONING EXPERT. NEW CONSTRUCTION COUNT, SQUARE FOOTAGE AND YEAR BUILT IS BASED ON INDIVIDUAL REAL ESTATE COMPANY REPORTING AND MAY BE DIFFERENT THAN PUBLIC RECORDS. NEW CONSTRUCTION COUNT IS BASED ON LISTING BROKERAGE LISTING YEAR. THE BROKER/AGENT PROVIDING THE INFORMATION CONTAINED HEREIN MAY OR MAY HAVE NOT BEEN THE LISTING AND/OR SELLING AGENT. THIS IS NOT INTENDED TO SOLICIT PROPERTY ALREADY LISTED. EQUAL HOUSING OPPORTUNITY. NEIGHBORHOOD BOUNDARY SOURCE: PUBLIC RECORDS, COMBINED LOS ANGELES WESTSIDE MULTIPLE LISTING SERVICE AND LOS ANGELES TIMES MAPPING L.A. https://maps.latimes.com/neighborhoods/index.html WESTWOOD
Los
$954 $951 $966 $976 $1,019 $1,139 $1,157 $1,136 $956 $966 $956 $994 $1,027 $1,231 $1,237 $1,137 $$200 $400 $600 $800 $1,000 $1,200 $1,400 Jan 01 to Jun 30, 2019 Jul 01 to Dec 31, 2019 Jan 01 to Jun 30, 2020 Jul 01 to Dec 31, 2020 Jan 01 to Jun 30, 2021 Jul 01 to Dec 31, 2021 Jan 01 to Jun 30, 2022 Jul 01 to Dec 31, 2022 Median Price Per Square Foot Average Price per SquareFt 36 61 33 31 17 13 14 3910 20 30 40 50 60 70 Jan 01 to Jun 30, 2019 Jul 01 to Dec 31, 2019 Jan 01 to Jun 30, 2020 Jul 01 to Dec 31, 2020 Jan 01 to Jun 30, 2021 Jul 01 to Dec 31, 2021 Jan 01 to Jun 30, 2022 Jul 01 to Dec 31, 2022 Number of Homes Sold 36 41 26 49 56 51 62 35 Days on Market before Sold 2.3 2.4 3.8 6.9 3.4 2.1 0.0 1.0 2.0 3.0 4.0 5.0 6.0 7.0 8.0 Nov 30, 2022 Dec 31, 2022 Jan 31, 2023 Feb 28, 2023 Mar 31, 2023 Apr 30, 2023 Number of months it would take to sell all properties Active for sale if no new listings entered the market. END OF WESTWOOD 6 PAGE REPORT
DAYS ON MARKET BEFORE SOLD- PRE & POST MAR 2020 PANDEMIC MONTHS SUPPLY OF INVENTORY - BASED ON LAST FEW MONTHS OF HOME SALES 3 and Under Favors Seller 4-6 = Balanced Market 7 and over Favors Buyer WESTWOOD WESTWOOD WESTWOOD
SOLD HOME PRICE PER SQUARE FOOT - PRE & POST MAR 2020 PANDEMIC
About LeHoa About LeHoa
Is the market going up? Is the market going down? Are we in a housing bubble? Is the market going to crash! What news source has the accurate data? Do you find yourself listening, reading to numerous news sources wondering what to make of it? Well, mixing a bookkeeper with a business management & legal background, now currently a Realtor AND frustrated artist at heart; you get... a Data Geek. LeHoa breaks it down to Supply and Demand, it’s as basic and simple as it sounds. And she has created data to show you this simplified, yet grossly complicated subject.
LeHoa Gacki is a residential Realtor specializing in Luxury Home Sales throughout Los Angeles. Aside from simultaneously working with Buyers and Sellers, LeHoa also represents Real Estate Developers. Together they turn outdated homes to truly luxurious properties.

LeHoa, (also) a long time Brentwood resident, follows the market on a daily basis, knows instantly about every listing and has a detailed knowledge about various areas in Los Angeles County. In 2006, her accomplishments in Real Estate landed her a role as one of the first Realtors on the one and only “The Fabulous Life Presents: Really Rich Real Estate” VH1’s reality show.
LeHoa has extensive experience in business management, accounting, legal documentation, and above all, contract negotiation. Her charismatic and kind persona mixed with extensive knowledge about everything real estate makes her a force to be reckoned with. In addition, LeHoa is a data geek- and can tell anyone everything about the market through her custom data reports called LNDC(LeHoa’s Neighborhood Data Charts). LeHoa’s strong belief that knowledge is power reflects back on her success and is even furthered with her friendly and magnetic energy. Above all, LeHoa understands the importance of finding her clients their ideal home, where they would feel comfortable with their loved ones and will always be your Realtor before you need one.
Frequently Asked Questions
Frequently Asked Questions
What is Month’s Supply Inventory based off of?
The number of months it would take to sell all the properties listed for sale at the current pace of sales and if no new listings entered the market based on the last 3 months of sales. Data is harvested from actual sales, not signed contracts or pending. Months supply of inventory does not count properties under contract.
What is Buyer/Seller Advantage based off of?
It is based off of sold+signed, under contract, what’s for sale and pending.
What does DOM stand for?
Days on the market before entering contract.
What is median?
Median is the midpoint in price out of all of the homes sold. For example, in areas where all of the homes have the same
lot home size, using an average number will work, but, due to Los Angeles real state having lot sizes 3 times different than a house two blocks away or other influences like views or busy roads- taking the median is a better way to gage market value.
What is price per square foot?
Price per square foot is price of the home divided by square footage of the house. It does not take into consideration lot size, it is solely home size. To clarify, sometimes a guest house, basement, or pool house is included and sometimes it is not which affects price per square foot.
What is New Construction and Resale?
New construction means homes that are newly built and no one has lived in it prior. Resale means someone has lived in it prior. New car vs. used car.
Inventory
What’s for sale on the market.
Under Contract
There is a contingency that has not been removed and the buyer has the option to cancel.
Pending/Closing
All contingencies have been removed and ready to close.
What is a contingency?
A contingency are contractual terms negotiated at purchase that allow a Buyer or Seller the ability to cancel the Purchase Agreement.
What is Mid-Low and Mid-High Price?
Mid-Low is between the Actual Lowest Sold and the Median Price. Mid-high is between the Median and the Actual Highest Sold.