Santa Monica Mountains: March 2023
LNDC
LeHoa’s Neighborhood Data Charts
Your Monthly Competitive Edge to Buying or Selling Real Estate in Los Angeles


CUSTOM REPORTS
Upon request, any data point can be supplied with links to view the properties.
Lehoa.Gacki@elliman.com
MAP CREDITS
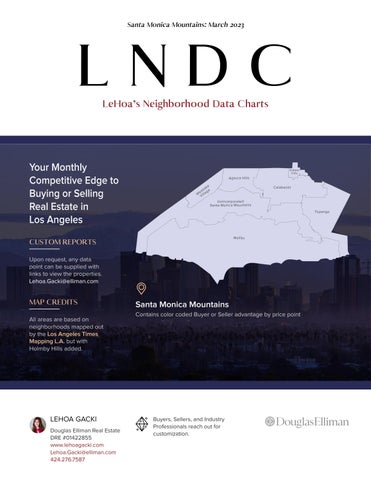
All areas are based on neighborhoods mapped out by the Los Angeles Times Mapping L.A. but with Holmby Hills added.
Santa Monica Mountains
Contains color coded Buyer or Seller advantage by price point
LEHOA GACKI
Douglas Elliman Real Estate
DRE #01422855
www.lehoagacki.com
Lehoa.Gacki@elliman.com 424.276.7587
Buyers, Sellers, and Industry Professionals reach out for customization.
Unincorporated Santa Monica Mountains Topanga Calabasas Agoura Hills Malibu Westlake Village Hidden HillsAbout LNDC
LeHoa’s Neighborhood Data Charts (LNDC) helps any Buyer, Seller, Investor, or Industry Professional navigate Los Angeles Real Estate.

Each area is 6 pages and provides invaluable information for anyone interested in the intricate Los Angeles Real Estate market. LNDC instantly advises what neighboring areas are priced at, what your money buys you the past month, plus 4 year historical fluctuations. LNDC also provides a Buyer or Seller advantage based on price bracket. Including, a bonus “Realtors Digest” separating new construction from resale and showing properties under contract, past 3 months sold transactions, Days on Market (DOM) prior to sale all separated by price bracket.
For questions, comments, a tailor-made report for your home area, or a complimentary home valuation please contact LeHoa Gacki.
Visit www.issuu.com/lehoagacki to view more publications. Other LNDC publications include Westside, San Fernando Valley, Central L.A., Northeast L.A., and Santa Monica Mountains.
Santa Monica Mountains
Agoura Calabasas Hidden Hills Malibu Topanga Westlake Village
Agoura Calabasas Hidden Hills Malibu Topanga Westlake Village → → → → → →
Table of Contents
About LeHoa
Is the market going up? Is the market going down? Are we in a housing bubble? Is the market going to crash! What news source has the accurate data? Do you find yourself listening, reading to numerous news sources wondering what to make of it? Well, mixing a bookkeeper with a business management & legal background, now currently a Realtor AND frustrated artist at heart; you get... a Data Geek. LeHoa breaks it down to Supply and Demand, it’s as basic and simple as it sounds. And she has created data to show you this simplified, yet grossly complicated subject.
LeHoa Gacki is a residential Realtor specializing in Luxury Home Sales throughout Los Angeles. Aside from simultaneously working with Buyers and Sellers, LeHoa also represents Real Estate Developers. Together they turn outdated homes to truly luxurious properties.

LeHoa, (also) a long time Brentwood resident, follows the market on a daily basis, knows instantly about every listing and has a detailed knowledge about various areas in Los Angeles County. In 2006, her accomplishments in Real Estate landed her a role as one of the first Realtors on the one and only “The Fabulous Life Presents: Really Rich Real Estate” VH1’s reality show.
LeHoa has extensive experience in business management, accounting, legal documentation, and above all, contract negotiation. Her charismatic and kind persona mixed with extensive knowledge about everything real estate makes her a force to be reckoned with. In addition, LeHoa is a data geek- and can tell anyone everything about the market through her custom data reports called LNDC(LeHoa’s Neighborhood Data Charts). LeHoa’s strong belief that knowledge is power reflects back on her success and is even furthered with her friendly and magnetic energy. Above all, LeHoa understands the importance of finding her clients their ideal home, where they would feel comfortable with their loved ones and will always be your Realtor before you need one.
Frequently Asked Questions
What is Month’s Supply Inventory based off of?
The number of months it would take to sell all the properties listed for sale at the current pace of sales and if no new listings entered the market based on the last 3 months of sales. Data is harvested from actual sales, not signed contracts or pending. Months supply of inventory does not count properties under contract.
What is Buyer/Seller Advantage based off of?
It is based off of sold+signed, under contract, what’s for sale and pending.
What does DOM stand for?
Days on the market before entering contract.
What is median?
Median is the midpoint in price out of all of the homes sold. For example, in areas where all of the homes have the same
lot home size, using an average number will work, but, due to Los Angeles real state having lot sizes 3 times different than a house two blocks away or other influences like views or busy roads- taking the median is a better way to gage market value.
What is price per square foot?
Price per square foot is price of the home divided by square footage of the house. It does not take into consideration lot size, it is solely home size. To clarify, sometimes a guest house, basement, or pool house is included and sometimes it is not which affects price per square foot.
What is New Construction and Resale?
New construction means homes that are newly built and no one has lived in it prior. Resale means someone has lived in it prior. New car vs. used car.
Inventory
What’s for sale on the market. Under Contract
There is a contingency that has not been removed and the buyer has the option to cancel.
Pending/Closing
All contingencies have been removed and ready to close.
What is a contingency?
A contingency are contractual terms negotiated at purchase that allow a Buyer or Seller the ability to cancel the Purchase Agreement.
What is Mid-Low and Mid-High Price?
Mid-Low is between the Actual Lowest Sold and the Median Price. Mid-high is between the Median and the Actual Highest Sold.
AREAS:

**Overbid/Underbid: 100 is list price paid. Under 100 means sold for less than asking, over 100 sold probably in multiples and over asking.
Note: Square Footage calculation could be more or less (+-) 20% difference. (Based on calculation.) *

Single Family Homes March 2023 $1,225,000 TYPICAL HOME PRICE (MEDIAN) $550 SOLD PRICE PER SQUARE FOOT 24 DAYS ON MARKET BEFORE SOLD (DOM) $1,041,500 MID-LOW $1,888,000 MID-HIGH For questions, comments, a tailor-made report for your home area, or a complimentary home valuation please contact LeHoa Gacki LeHoa Gacki Douglas Elliman Real Estate DRE #01422855 Lehoa.Gacki@elliman.com www.LeHoaGacki.com 424.276.7587 WHAT YOUR MONEY BUYS YOU THIS MONTH CLICK HERE FOR MORE Agoura Home Analysis from: March 01, 2023 to March 31, 2023 19 Sold Sold Price **Overbid/ Underbid Square Feet Price per/SqFt YB LotSqFt BD BA Days on Market Actual Lowest Sold $780,000 98 1,076 $725 1928 3,418 2 2 24 Mid-Low* $1,041,500 98 1,874 $522 1970 5,825 3 3 9 Typical Home Price (Median)* $1,225,000 100 2,366 $550 1983 8,471 4 3 24 Mid-High* $1,888,000 102 3,231 $625 1993 14,510 4 4 90 Actual Highest Sold $5,250,000 91 7,405 $709 2019 63,609 6 6 119 Average $1,536,755 99 2,695 $566 1981 13,313 4 3 50
Middle
$846,500 Middle
Home
(Median)
Never more,
less. Source: TheMLS/CLAW (Combined Los Angeles Westside) LeHoa’s Neighborhood Data Charts Los Angeles Real Estate LNDC MARCH 2023 Agoura A City in Los Angeles County Westlake Village Calabasas Malibu AGOURA Hidden Hills Woodland Hills West Hills NEIGHBORING
Area Typical Home Price (Median) Price per/ SqFt Days on Market Mid-Low Mid-High Homes Sold Westlake Village $1,450,000 $609 22 $1,127,500 $2,174,375 25 Hidden Hills $15,750,000 $1,460 0 $15,750,000 $15,750,000 1 West Hills $950,000 $503 29 $827,000 $1,167,500 37 Woodland Hills $1,300,000 $622 11 $1,077,000 $1,500,000 47 Calabasas $2,025,000 $696 7 $1,720,000 $3,020,000 11 Malibu $3,422,000 $1,716 9 $2,497,531 $6,531,250 12
Range Variance
Range Variance is future range Typical
Price
Price will vary by.
Never
Buyer or Seller Advantage by Price Point for Agoura as of March 31, 2023
Months supply of Inventory =
4-6 = BALANCED MARKET
Based on last 3 months of homes sales, Agoura has 2.1 months supply of inventory.
3 and under FAVORS SELLER
7 and over FAVORS BUYER
SELLER ADVANTAGE
$850,000 $899,999 SELLER ADVANTAGE
$800,000 $849,999 SELLER ADVANTAGE
$750,000 $799,999 SELLER ADVANTAGE
$700,000 $749,999
$650,000 $699,999
$600,000 $649,999 SELLER ADVANTAGE
$550,000 $599,999 SELLER ADVANTAGE
$500,000 $549,999
$100,000 $499,999
HOME PRICE RANGE BUYER ADVANTAGE $6,000,000 $10,000,000 $3,000,000 $5,999,999 SELLER ADVANTAGE $2,200,000 $2,999,999 $2,100,000 $2,199,999 SELLER ADVANTAGE $2,050,000 $2,099,999 $2,000,000 $2,049,999 SELLER ADVANTAGE $1,500,000 $1,999,999 BUYER ADVANTAGE $1,450,000 $1,499,999 $1,400,000 $1,449,999 SELLER ADVANTAGE $1,350,000 $1,399,999 SELLER ADVANTAGE BUYER ADVANTAGE $1,300,000 $1,349,999 $1,250,000 $1,299,999 SELLER ADVANTAGE $1,200,000 $1,249,999 SELLER ADVANTAGE $1,150,000 $1,199,999 SELLER ADVANTAGE $1,100,000 $1,149,999 SELLER ADVANTAGE $1,050,000 $1,099,999 SELLER ADVANTAGE $1,000,000 $1,049,999 SELLER ADVANTAGE $950,000 $999,999 SELLER ADVANTAGE $900,000 $949,999
View
homes below Contact for up to date homes for sale
Agoura Inventory for New Construction and Resale of Homes as of
DEMAND
Under Contract Pending - Closing Soon New Construction New Con DOM Resale Resale DOM Home Price Range Homes Resold 5 9 1 32 29 47 16 $100,000 $499,999 $500,000 $549,999 1 $550,000 $599,999 $600,000 $649,999 $650,000 $699,999 $700,000 $749,999 $750,000 $799,999 1 25 $800,000 $849,999 1 $850,000 $899,999 $900,000 $949,999 2 2 $950,000 $999,999 $1,000,000 $1,049,999 2 1 1 14 $1,050,000 $1,099,999 2 $1,100,000 $1,149,999 2 1 2 26 $1,150,000 $1,199,999 1 1 1 2 35 $1,200,000 $1,249,999 1 $1,250,000 $1,299,999 1 2 47 $1,300,000 $1,349,999 1 $1,350,000 $1,399,999 $1,400,000 $1,449,999 1 1 1 32 4 37 $1,450,000 $1,499,999 6 51 $1,500,000 $1,999,999 1 $2,000,000 $2,049,999 $2,050,000 $2,099,999 1 1 83 $2,100,000 $2,199,999 1 5 29 $2,200,000 $2,999,999 1 2 1 3 31 $3,000,000 $5,999,999 1 2 173 $6,000,000 $10,000,000 REALTORS
SELLER ADVANTAGE SUPPLY &
For Sale Source: TheMLS/CLAW (Combined Los Angeles Westside)
of March 31, 2023
BUYER / INVESTOR ADVANTAGE
DEMAND
Sold Homes Days on Market Before Sold = DOM January February March Resold DOM New Cons New DOM Homes Resold Resold DOM New Cons New DOM Homes Resold Resold DOM New Cons New DOM 57 8 36 19 50 1 0 2 14 53 1 38 110 1 5 115 1 83 1 4 14 1 30 32 3 20 37 2 65 1 183 38 5 72 33 1 9 22 1 13 41 2 14 2 62 101 1 14 43 1 119 REALTORS DIGEST
4 YEAR TREND
**Overbid

is list price paid. Under 100 means sold for less than asking, over 100 sold probably in multiples and over asking.
Note: Square Footage calculation could be more or less (+-) 20% difference. (Based on calculation.)
* Middle Range Variance $740,000 Middle Range Variance is future range Typical Home Price (Median) Price will vary by. Never more, Never less.
TheMLS/CLAW (Combined Los Angeles Westside)
For questions, comments, a tailor-made report for your home area, or a complimentary home valuation please contact LeHoa Gacki
$813,750 $855,000 $1,013,500 $1,100,000 $945,000 $990,000 $1,280,850 $1,350,000 $1,251,750 $1,370,000 $1,750,000 $1,840,000 $$200,000 $400,000 $600,000 $800,000 $1,000,000 $1,200,000 $1,400,000 $1,600,000 $1,800,000 $2,000,000 Apr 01, 2019 to Mar 31, 2020 Apr 01, 2020 to Mar 31, 2021 Apr 01, 2021 to Mar 31, 2022 Apr 01, 2022 to Mar 31, 2023 Mid-Low Typical Home Price-Median Mid-High
LeHoa Gacki, DRE #01422855 Douglas Elliman Real Estate 11990 San Vicente Blvd., #100, L.A., Ca 90049 Email: Lehoa.Gacki@elliman.com Tel | Fax: (424) 276-7587 www.Lehoagacki.com | Lehoagacki.elliman.com 4 YEAR OBSERVATION Agoura Number of Homes Sold: 342 369 412 261 Apr 01, 2019 to Mar 31, 2020 Apr 01, 2020 to Mar 31, 2021 Apr 01, 2021 to Mar 31, 2022 Apr 01, 2022 to Mar 31, 2023 Actual Lowest Sold $221,000 $465,000 $645,000 $600,000 Mid-Low $813,750 $855,000 $1,013,500 $1,100,000 Typical Home Price-Median $945,000 $990,000 $1,280,850 $1,350,000 Mid-High $1,251,750 $1,370,000 $1,750,000 $1,840,000 Actual Highest Sold $3,500,000 $4,453,000 $5,640,000 $5,850,000 Average Price Sold $1,086,255 $1,189,544 $1,517,129 $1,606,574 12 MONTH OBSERVATION Agoura Cumulative 12 months sold home analysis from: April 01, 2022 to March 31, 2023 261 Sold Sold Price **Overbid / Underbid Square Feet Price per/SqFt YB LotSqFt BD BA Days on Market Actual Lowest Sold $600,000 100 1,692 $355 1972 6,129 4 2 0 Mid-Low* $1,100,000 97 1,924 $516 1974 6,627 4 3 9 Typical Home Price-Median* $1,350,000 100 2,382 $574 1983 8,007 4 3 24 Mid-High* $1,840,000 105 3,290 $651 1988 13,558 5 4 45 Actual Highest Sold $5,850,000 90 7,768 $753 2004 47,510 5 6 51 Average $1,606,574 101 2,757 $584 1982 17,263 4 3 36
/ Underbid: 100
© 2022 LEHOA GACKI. DRE# 01422855. ALL WORLDWIDE RIGHTS RESERVED. DOUGLAS ELLIMAN REAL ESTATE. 150 EL CAMINO DRIVE, BEVERLY HILLS, CA 90212. 310.595.3888. ALL MATERIAL PRESENTED HEREIN IS INTENDED FOR INFORMATION PURPOSES ONLY AND NOT INTENDED TO CONSTITUTE PROFESSIONAL ADVICE OR WARRANTY OUTSIDE THE REALM OF REAL ESTATE BROKERAGE. MAPS CREATED FOR REFERENCE PURPOSE ONLY. WHILE THIS INFORMATION IS BELIEVED TO BE CORRECT, IT IS REPRESENTED SUBJECT TO ERRORS, OMISSIONS, CHANGES OR WITHDRAWAL WITHOUT NOTICE. BASED ON DATA SOURCED FROM THE COMBINED LOS ANGELES WESTSIDE MULTIPLE LISTING SERVICE AND PUBLIC RECORDS. STATISTICS ARE SUBJECT TO CHANGE DUE TO INDIVIDUAL REAL ESTATE COMPANY REPORTING DISCIPLINES. BUYER ADVANTAGE OR SELLER ADVANTAGE IS STRICTLY OF THE OPINION OF LEHOA GACKI AND ACCURACY CANNOT BE GUARANTEED AND MAY NOT REFLECT ALL REAL ESTATE ACTIVITY ON THE MARKET. ALL PROPERTY INFORMATION, INCLUDING, BUT NOT LIMITED TO MAPS, GRAPHS, DEPICTIONS, SQUARE FOOTAGE, ROOM COUNT, NUMBER OF BEDROOMS AND THE SCHOOL DISTRICT IN PROPERTY LISTINGS SHOULD BE VERIFIED BY YOUR OWN ATTORNEY, ARCHITECT OR ZONING EXPERT. NEW CONSTRUCTION COUNT, SQUARE FOOTAGE AND YEAR BUILT IS BASED ON INDIVIDUAL REAL ESTATE COMPANY REPORTING AND MAY BE DIFFERENT THAN PUBLIC RECORDS. NEW CONSTRUCTION COUNT IS BASED ON LISTING BROKERAGE LISTING YEAR. THE BROKER/AGENT PROVIDING THE INFORMATION CONTAINED HEREIN MAY OR MAY HAVE NOT BEEN THE LISTING AND/OR SELLING AGENT. THIS IS NOT INTENDED TO SOLICIT PROPERTY ALREADY LISTED. EQUAL HOUSING OPPORTUNITY. NEIGHBORHOOD BOUNDARY SOURCE: PUBLIC RECORDS, COMBINED LOS ANGELES WESTSIDE MULTIPLE LISTING SERVICE AND LOS ANGELES TIMES MAPPING L.A. https://maps.latimes.com/neighborhoods/index.html AGOURA
Source:
SOLD HOME PRICE PER SQUARE FOOT - PRE & POST MAR 2020 PANDEMIC DAYS ON MARKET BEFORE SOLD- PRE & POST MAR 2020 PANDEMIC
SUPPLY OF INVENTORY - BASED ON LAST FEW MONTHS OF HOME SALES
of months it would take to sell all properties listed for sale if no new listings entered the market.
$417 $413 $418 $439 $488 $524 $594 $561 $427 $421 $427 $482 $501 $549 $606 $571 $$100 $200 $300 $400 $500 $600 $700 Jan 01 to Jun 30, 2019 Jul 01 to Dec 31, 2019 Jan 01 to Jun 30, 2020 Jul 01 to Dec 31, 2020 Jan 01 to Jun 30, 2021 Jul 01 to Dec 31, 2021 Jan 01 to Jun 30, 2022 Jul 01 to Dec 31, 2022 Median Price Per Square Foot Average Price per SquareFt 48 44 33 32 26 25 15 3310 20 30 40 50 60 Jan 01 to Jun 30, 2019 Jul 01 to Dec 31, 2019 Jan 01 to Jun 30, 2020 Jul 01 to Dec 31, 2020 Jan 01 to Jun 30, 2021 Jul 01 to Dec 31, 2021 Jan 01 to Jun 30, 2022 Jul 01 to Dec 31, 2022 Number of Homes Sold 155 176 111 228 223 222 150 126 Days on Market before Sold 1.7 2.2 2.1 0.0 0.5 1.0 1.5 2.0 2.5 Jan 31, 2023 Feb 28, 2023 Mar 31, 2023 Number
END OF AGOURA 6 PAGE REPORT
MONTHS
3 and Under Favors Seller 4-6 = Balanced Market 7 and over Favors Buyer AGOURA AGOURA AGOURA
AREAS:
**Overbid/Underbid: 100 is list price paid. Under 100 means sold for less than asking, over 100 sold probably in multiples and over asking.
Note: Square Footage calculation could be more or less (+-) 20% difference. (Based on calculation.) *
Single Family Homes March 2023 $2,025,000 TYPICAL HOME PRICE (MEDIAN) $696 SOLD PRICE PER SQUARE FOOT 7 DAYS ON MARKET BEFORE SOLD (DOM) $1,720,000 MID-LOW $3,020,000 MID-HIGH For questions, comments, a tailor-made report for your home area, or a complimentary home valuation please contact LeHoa Gacki LeHoa Gacki Douglas Elliman Real Estate DRE #01422855 Lehoa.Gacki@elliman.com www.LeHoaGacki.com 424.276.7587 WHAT YOUR MONEY BUYS YOU THIS MONTH CLICK HERE FOR MORE Calabasas Home Analysis from: March 01, 2023 to March 31, 2023 11 Sold Sold Price **Overbid/ Underbid Square Feet Price per/SqFt YB LotSqFt BD BA Days on Market Actual Lowest Sold $1,120,000 117 1,817 $616 1999 359,251 3 3 5 Mid-Low* $1,720,000 96 2,511 $616 1970 6,133 4 3 3 Typical Home Price (Median)* $2,025,000 100 2,935 $696 1988 15,505 4 4 7 Mid-High* $3,020,000 104 4,994 $885 2001 23,257 5 6 33 Actual Highest Sold $5,150,000 97 5,186 $993 2002 15,505 5 6 36 Average $2,403,545 101 3,282 $729 1986 57,760 4 4 16
Middle
$1,300,000 Middle
range Typical Home Price (Median)
Never more, Never less. Source: TheMLS/CLAW (Combined Los Angeles Westside) LeHoa’s Neighborhood Data Charts Los Angeles Real Estate LNDC MARCH 2023 Calabasas A City in Los Angeles County CALABASAS Agoura Topanga Hidden Hills Malibu Woodland Hills NEIGHBORING
Area Typical Home Price (Median) Price per/ SqFt Days on Market Mid-Low Mid-High Homes Sold Agoura $1,225,000 $550 24 $1,041,500 $1,888,000 19 Hidden Hills $15,750,000 $1,460 0 $15,750,000 $15,750,000 1 Woodland Hills $1,300,000 $622 11 $1,077,000 $1,500,000 47 Topanga $2,175,000 $1,134 16 $1,998,899 $2,800,000 11 Malibu $3,422,000 $1,716 9 $2,497,531 $6,531,250 12
Range Variance
Range Variance is future
Price will vary by.
Buyer or Seller Advantage by Price Point for Calabasas as of March 31, 2023
Months supply of Inventory =
4-6 = BALANCED MARKET
Based
3 and under FAVORS SELLER
7 and over FAVORS BUYER
$2,000,000 $2,249,999 SELLER ADVANTAGE
$1,750,000 $1,999,999 SELLER ADVANTAGE
$1,500,000 $1,749,999 SELLER ADVANTAGE
$1,250,000 $1,499,999 SELLER ADVANTAGE
$1,000,000 $1,249,999 SELLER ADVANTAGE
$900,000 $999,999 SELLER ADVANTAGE
$800,000 $899,999
$100,000 $799,999 SELLER ADVANTAGE
HOME PRICE RANGE $40,000,000 $50,000,000 $30,000,000 $39,999,999 BUYER ADVANTAGE $20,000,000 $29,999,999 BUYER ADVANTAGE $15,000,000 $19,999,999 $12,250,000
ADVANTAGE $10,000,000
BUYER ADVANTAGE $9,000,000
$8,000,000
BUYER ADVANTAGE $7,000,000
$6,500,000
$6,000,000
SELLER ADVANTAGE BUYER ADVANTAGE $5,500,000
$5,000,000
SELLER ADVANTAGE $4,500,000 $4,999,999 SELLER ADVANTAGE BUYER ADVANTAGE $4,000,000 $4,499,999 $3,500,000 $3,999,999 $3,000,000 $3,499,999 SELLER ADVANTAGE $2,750,000 $2,999,999 SELLER ADVANTAGE $2,500,000
SELLER ADVANTAGE $2,250,000
$14,999,999 BUYER
$12,249,999
$9,999,999
$8,999,999
$7,999,999
$6,999,999
$6,499,999
$5,999,999
$5,499,999
$2,749,999
$2,499,999
on last 3 months of homes sales, Calabasas has 3.4 months supply of inventory.
TO VIEW MORE View homes below Contact for up to date homes for sale
Calabasas Inventory for New Construction and Resale of Homes SELLER
SUPPLY & DEMAND
Source: TheMLS/CLAW (Combined Los Angeles Westside) Under Contract Pending - Closing Soon New Construction New Con DOM Resale Resale DOM Home Price Range Homes Resold 9 11 1 2 38 62 11 1 $100,000 $799,999 $800,000 $899,999 1 $900,000 $999,999 2 3 6 $1,000,000 $1,249,999 1 2 4 7 $1,250,000 $1,499,999 3 1 1 2 42 $1,500,000 $1,749,999 1 1 3 40 $1,750,000 $1,999,999 1 18 $2,000,000 $2,249,999 2 1 1 4 106 $2,250,000 $2,499,999 1 2 114 $2,500,000 $2,749,999 2 1 2 16 $2,750,000 $2,999,999 2 2 2 79 $3,000,000 $3,499,999 1 2 31 $3,500,000 $3,999,999 2 120 $4,000,000 $4,499,999 2 2 50 $4,500,000 $4,999,999 1 1 28 $5,000,000 $5,499,999 2 108 $5,500,000 $5,999,999 1 19 $6,000,000 $6,499,999 1 $6,500,000 $6,999,999 1 52 $7,000,000 $7,999,999 $8,000,000 $8,999,999 1 216 $9,000,000 $9,999,999 1 2 $10,000,000 $12,249,999 $12,250,000 $14,999,999 2 39 $15,000,000 $19,999,999 1 234 $20,000,000 $29,999,999 $30,000,000 $39,999,999 $40,000,000 $50,000,000 REALTORS
ADVANTAGE
For Sale
as of March 31, 2023
BUYER / INVESTOR ADVANTAGE
DEMAND
Sold Homes Days on Market Before Sold = DOM January February March Resold DOM New Cons New DOM Homes Resold Resold DOM New Cons New DOM Homes Resold Resold DOM New Cons New DOM 64 12 51 11 16 60 3 20 2 4 58 2 148 1 6 1 7 3 19 2 21 83 1 78 1 5 1 118 59 1 25 1 0 1 25 2 17 97 1 36 27 REALTORS DIGEST
4 YEAR TREND
**Overbid / Underbid: 100 is list price paid. Under 100 means sold for less than asking, over 100 sold probably in multiples and over asking.
Note: Square Footage calculation could be more or less (+-) 20% difference. (Based on calculation.)
* Middle Range Variance $1,497,250 Middle Range Variance is future range Typical Home Price (Median) Price will vary by. Never more, Never less.
TheMLS/CLAW (Combined Los Angeles Westside)
For questions, comments, a tailor-made report for your home area, or a complimentary home valuation please contact LeHoa Gacki
$1,100,000 $1,197,500 $1,350,000 $1,483,750 $1,450,000 $1,670,000 $1,847,500 $1,900,000 $2,256,250 $2,449,750 $2,692,611 $2,981,000 $$500,000 $1,000,000 $1,500,000 $2,000,000 $2,500,000 $3,000,000 $3,500,000 Apr 01, 2019 to Mar 31, 2020 Apr 01, 2020 to Mar 31, 2021 Apr 01, 2021 to Mar 31, 2022 Apr 01, 2022 to Mar 31, 2023
Mid-Low Typical Home Price-Median Mid-High
LeHoa Gacki, DRE #01422855 Douglas Elliman Real Estate 11990 San Vicente Blvd., #100, L.A., Ca 90049 Email: Lehoa.Gacki@elliman.com Tel | Fax: (424) 276-7587 www.Lehoagacki.com | Lehoagacki.elliman.com 4 YEAR OBSERVATION Calabasas Number of Homes Sold: 262 285 328 190 Apr 01, 2019 to Mar 31, 2020 Apr 01, 2020 to Mar 31, 2021 Apr 01, 2021 to Mar 31, 2022 Apr 01, 2022 to Mar 31, 2023 Actual Lowest Sold $700,000 $200,000 $260,000 $839,375 Mid-Low $1,100,000 $1,197,500 $1,350,000 $1,483,750 Typical Home Price-Median $1,450,000 $1,670,000 $1,847,500 $1,900,000 Mid-High $2,256,250 $2,449,750 $2,692,611 $2,981,000 Actual Highest Sold $7,910,000 $10,161,150 $30,000,000 $20,000,000 Average Price Sold $1,772,091 $1,970,319 $2,230,003 $2,423,058 12 MONTH OBSERVATION Calabasas Cumulative 12 months sold home analysis from: April 01, 2022 to March 31, 2023 190 Sold Sold Price **Overbid / Underbid Square Feet Price per/SqFt YB LotSqFt BD BA Days on Market Actual Lowest Sold $839,375 84 2,028 $414 1984 5,227 3 3 13 Mid-Low* $1,483,750 96 2,244 $578 1970 7,839 4 3 8 Typical Home Price-Median* $1,900,000 100 2,867 $674 1987 10,829 4 3 15 Mid-High* $2,981,000 104 4,169 $772 1993 17,273 5 5 40 Actual Highest Sold $20,000,000 80 14,021 $1,426 2020 71,216 7 11 157 Average $2,423,058 105 3,431 $693 1983 28,212 4 4 31
© 2022 LEHOA GACKI. DRE# 01422855. ALL WORLDWIDE RIGHTS RESERVED. DOUGLAS ELLIMAN REAL ESTATE. 150 EL CAMINO DRIVE, BEVERLY HILLS, CA 90212. 310.595.3888. ALL MATERIAL PRESENTED HEREIN IS INTENDED FOR INFORMATION PURPOSES ONLY AND NOT INTENDED TO CONSTITUTE PROFESSIONAL ADVICE OR WARRANTY OUTSIDE THE REALM OF REAL ESTATE BROKERAGE. MAPS CREATED FOR REFERENCE PURPOSE ONLY. WHILE THIS INFORMATION IS BELIEVED TO BE CORRECT, IT IS REPRESENTED SUBJECT TO ERRORS, OMISSIONS, CHANGES OR WITHDRAWAL WITHOUT NOTICE. BASED ON DATA SOURCED FROM THE COMBINED LOS ANGELES WESTSIDE MULTIPLE LISTING SERVICE AND PUBLIC RECORDS. STATISTICS ARE SUBJECT TO CHANGE DUE TO INDIVIDUAL REAL ESTATE COMPANY REPORTING DISCIPLINES. BUYER ADVANTAGE OR SELLER ADVANTAGE IS STRICTLY OF THE OPINION OF LEHOA GACKI AND ACCURACY CANNOT BE GUARANTEED AND MAY NOT REFLECT ALL REAL ESTATE ACTIVITY ON THE MARKET. ALL PROPERTY INFORMATION, INCLUDING, BUT NOT LIMITED TO MAPS, GRAPHS, DEPICTIONS, SQUARE FOOTAGE, ROOM COUNT, NUMBER OF BEDROOMS AND THE SCHOOL DISTRICT IN PROPERTY LISTINGS SHOULD BE VERIFIED BY YOUR OWN ATTORNEY, ARCHITECT OR ZONING EXPERT. NEW CONSTRUCTION COUNT, SQUARE FOOTAGE AND YEAR BUILT IS BASED ON INDIVIDUAL REAL ESTATE COMPANY REPORTING AND MAY BE DIFFERENT THAN PUBLIC RECORDS. NEW CONSTRUCTION COUNT IS BASED ON LISTING BROKERAGE LISTING YEAR. THE BROKER/AGENT PROVIDING THE INFORMATION CONTAINED HEREIN MAY OR MAY HAVE NOT BEEN THE LISTING AND/OR SELLING AGENT. THIS IS NOT INTENDED TO SOLICIT PROPERTY ALREADY LISTED. EQUAL HOUSING OPPORTUNITY. NEIGHBORHOOD BOUNDARY SOURCE: PUBLIC RECORDS, COMBINED LOS ANGELES WESTSIDE MULTIPLE LISTING SERVICE AND LOS ANGELES TIMES MAPPING L.A. https://maps.latimes.com/neighborhoods/index.html CALABASAS
Source:
SOLD HOME PRICE PER SQUARE FOOT - PRE & POST MAR 2020 PANDEMIC
DAYS ON MARKET BEFORE SOLD- PRE & POST MAR 2020 PANDEMIC
OF INVENTORY - BASED ON LAST FEW MONTHS OF
of months it would take to sell all properties listed for sale if no new listings entered the market.
$459 $457 $466 $486 $546 $608 $675 $663 $490 $478 $484 $504 $564 $617 $687 $696 $$100 $200 $300 $400 $500 $600 $700 $800 Jan 01 to Jun 30, 2019 Jul 01 to Dec 31, 2019 Jan 01 to Jun 30, 2020 Jul 01 to Dec 31, 2020 Jan 01 to Jun 30, 2021 Jul 01 to Dec 31, 2021 Jan 01 to Jun 30, 2022 Jul 01 to Dec 31, 2022 Median Price Per Square Foot Average Price per SquareFt 54 42 21 19 11 13 11 2010 20 30 40 50 60 Jan 01 to Jun 30, 2019 Jul 01 to Dec 31, 2019 Jan 01 to Jun 30, 2020 Jul 01 to Dec 31, 2020 Jan 01 to Jun 30, 2021 Jul 01 to Dec 31, 2021 Jan 01 to Jun 30, 2022 Jul 01 to Dec 31, 2022 Number of Homes Sold 114 145 70 186 169 156 147 81 Days on Market before Sold 3.1 2.8 3.4 0.0 0.5 1.0 1.5 2.0 2.5 3.0 3.5 4.0 Jan 31, 2023 Feb 28, 2023 Mar 31, 2023 Number
END OF CALABASAS 6 PAGE REPORT
MONTHS SUPPLY
HOME
3 and Under Favors Seller 4-6 = Balanced Market 7 and over Favors Buyer CALABASAS CALABASAS CALABASAS
SALES
**Overbid/Underbid: 100 is list price paid. Under 100 means sold for less than asking, over 100 sold probably in multiples and over asking.
Note: Square Footage calculation could be more or less (+-) 20% difference. (Based on calculation.)
Single Family Homes March 2023 $15,750,000 TYPICAL HOME PRICE (MEDIAN) $1,460 SOLD PRICE PER SQUARE FOOT 0 DAYS ON MARKET BEFORE SOLD (DOM) For
home
a
home valuation
LeHoa Gacki LeHoa Gacki Douglas Elliman Real Estate DRE #01422855 Lehoa.Gacki@elliman.com www.Lehoagacki.com 424.276.7587 WHAT YOUR MONEY BUYS YOU THIS MONTH CLICK HERE FOR MORE HiddenHills Home Analysis from: March 01, 2023 to March 31, 2023 1 Sold Sold Price **Overbid/ Underbid Square Feet Price per/SqFt YB LotSqFt BD BA Days on Market Typical Home Price (Median)* $15,750,000 100 10,789 $1,460 2014 100,109 6 7 -
questions, comments, a tailor-made report for your
area, or
complimentary
please contact
Source: TheMLS/CLAW (Combined Los Angeles Westside) LeHoa’s Neighborhood Data Charts Los Angeles Real Estate LNDC MARCH 2023 Hidden
A City in Los Angeles County HIDDEN HILLS Calabasas Agoura Woodland Hills NEIGHBORING
Area Typical Home Price (Median) Price per/ SqFt Days on Market Mid-Low Mid-High Homes Sold Agoura $1,225,000 $550 24 $1,041,500 $1,888,000 19 Woodland Hills $1,300,000 $622 11 $1,077,000 $1,500,000 47 Calabasas $2,025,000 $696 7 $1,720,000 $3,020,000 11
Hills
AREAS:
Buyer or Seller Advantage by Price Point for Hidden Hills as of March 31, 2023
Months supply of Inventory =
4-6 = BALANCED MARKET
Based on last 3 months of homes sales, Hidden Hills has 12.0 months supply of inventory.
$6,499,999
$5,999,999
$5,499,999
$4,999,999
$4,499,999
$3,999,999
$3,499,999
$2,999,999
$2,749,999
$2,499,999
$2,249,999 $1,750,000 $1,999,999
$1,749,999
$1,499,999
$1,249,999
$999,999
$899,999
$799,999
3 and under FAVORS SELLER
7 and over FAVORS BUYER
HOME PRICE RANGE $40,000,000
$30,000,000
$20,000,000
BUYER ADVANTAGE $15,000,000
$12,250,000
$10,000,000
SELLER
BUYER ADVANTAGE $9,000,000
$8,000,000
$7,000,000
SELLER
BUYER
BUYER ADVANTAGE $6,000,000
BUYER ADVANTAGE $5,500,000
$5,000,000
$4,500,000
BUYER ADVANTAGE $4,000,000
BUYER ADVANTAGE $3,500,000
$3,000,000
$2,750,000
$2,250,000
$1,500,000
$1,250,000
$1,000,000
$900,000
$800,000
$100,000
$50,000,000
$39,999,999
$29,999,999
$19,999,999
$14,999,999
$12,249,999
ADVANTAGE
$9,999,999
$8,999,999
$7,999,999
ADVANTAGE
ADVANTAGE $6,500,000 $6,999,999
$2,500,000
$2,000,000
TO VIEW MORE View homes below Contact for up to date homes for sale
Hidden Hills Inventory for New Construction and Resale of Homes SELLER
SUPPLY & DEMAND
TheMLS/CLAW (Combined Los Angeles Westside) Under Contract Pending - Closing Soon New Construction New Con DOM Resale Resale DOM Home Price Range Homes Resold 1 164 23 79 3 $100,000 $799,999 $800,000 $899,999 $900,000 $999,999 $1,000,000 $1,249,999 $1,250,000 $1,499,999 $1,500,000 $1,749,999 $1,750,000 $1,999,999 $2,000,000 $2,249,999 $2,250,000 $2,499,999 $2,500,000 $2,749,999 $2,750,000 $2,999,999 $3,000,000 $3,499,999 2 11 $3,500,000 $3,999,999 1 47 $4,000,000 $4,499,999 $4,500,000 $4,999,999 2 179 $5,000,000 $5,499,999 4 100 $5,500,000 $5,999,999 1 1 92 $6,000,000 $6,499,999 4 109 $6,500,000 $6,999,999 1 37 $7,000,000 $7,999,999 $8,000,000 $8,999,999 3 52 $9,000,000 $9,999,999 $10,000,000 $12,249,999 1 $12,250,000 $14,999,999 1 164 3 63 $15,000,000 $19,999,999 2 44 $20,000,000 $29,999,999 1 $30,000,000 $39,999,999 $40,000,000 $50,000,000
ADVANTAGE
For Sale Source:
REALTORS
Homes as of March 31, 2023
BUYER / INVESTOR ADVANTAGE
DEMAND
Sold Homes Days on Market Before Sold = DOM January February March Resold DOM New Cons New DOM Homes Resold Resold DOM New Cons New DOM Homes Resold Resold DOM New Cons New DOM 90 2 19 1 0 1 17 1 1 21 195 1 0 75 REALTORS DIGEST
For questions, comments, a tailor-made report for your home area, or a complimentary home valuation please contact LeHoa Gacki

4 YEAR TREND

$2,832,500 $3,600,000 $3,750,000 $5,800,000 $3,300,000 $5,232,000 $4,850,000 $11,500,000 $4,772,500 $8,425,000 $8,450,000 $15,750,000 $$2,000,000 $4,000,000 $6,000,000 $8,000,000 $10,000,000 $12,000,000 $14,000,000 $16,000,000 $18,000,000 Apr 01, 2019 to Mar 31, 2020 Apr 01, 2020 to Mar 31, 2021 Apr 01, 2021 to Mar 31, 2022 Apr 01, 2022 to Mar 31, 2023 Mid-Low Typical Home Price-Median Mid-High
Elliman Real Estate 11990 San Vicente Blvd., #100, L.A., Ca 90049 Email: Lehoa.Gacki@elliman.com Tel | Fax: (424) 276-7587 www.Lehoagacki.com | Lehoagacki.elliman.com 4 YEAR OBSERVATION HiddenHills Number of Homes Sold: 28 39 47 27 Apr 01, 2019 to Mar 31, 2020 Apr 01, 2020 to Mar 31, 2021 Apr 01, 2021 to Mar 31, 2022 Apr 01, 2022 to Mar 31, 2023 Actual Lowest Sold $1,920,000 $1,800,000 $2,680,000 $3,212,000 Mid-Low $2,832,500 $3,600,000 $3,750,000 $5,800,000 Typical Home Price-Median $3,300,000 $5,232,000 $4,850,000 $11,500,000 Mid-High $4,772,500 $8,425,000 $8,450,000 $15,750,000 Actual Highest Sold $22,200,000 $18,000,000 $19,300,000 $25,950,000 Average Price Sold $5,335,722 $6,426,563 $6,595,385 $10,806,731 12 MONTH OBSERVATION HiddenHills Cumulative 12 months sold home analysis from: April 01, 2022 to March 31, 2023 27 Sold Sold Price **Overbid / Underbid Square Feet Price per/SqFt YB LotSqFt BD BA Days on Market Actual Lowest Sold $3,212,000 97 2,824 $1,137 1959 21,598 4 3 21 Mid-Low* $5,800,000 92 4,239 $1,109 1959 52,851 4 5 3 Typical Home Price-Median* $11,500,000 97 8,435 $1,205 1991 62,023 6 7 21 Mid-High* $15,750,000 100 11,126 $1,460 2014 88,039 7 9 60 Actual Highest Sold $25,950,000 94 14,678 $1,768 2018 323,650 6 9 75 Average $10,806,731 100 8,341 $1,319 1992 78,536 6 7 48 **Overbid / Underbid: 100 is list price paid. Under 100 means sold for less than asking, over 100 sold probably in multiples and over asking.
Middle
Variance $9,950,000 Middle
Variance is future range Typical Home Price (Median) Price will vary by. Never more, Never less. Source: TheMLS/CLAW (Combined Los Angeles Westside) © 2022 LEHOA GACKI. DRE# 01422855. ALL WORLDWIDE RIGHTS RESERVED. DOUGLAS ELLIMAN REAL ESTATE. 150 EL CAMINO DRIVE, BEVERLY HILLS, CA 90212. 310.595.3888. ALL MATERIAL PRESENTED HEREIN IS INTENDED FOR INFORMATION PURPOSES ONLY AND NOT INTENDED TO CONSTITUTE PROFESSIONAL ADVICE OR WARRANTY OUTSIDE THE REALM OF REAL ESTATE BROKERAGE. MAPS CREATED FOR REFERENCE PURPOSE ONLY. WHILE THIS INFORMATION IS BELIEVED TO BE CORRECT, IT IS REPRESENTED SUBJECT TO ERRORS, OMISSIONS, CHANGES OR WITHDRAWAL WITHOUT NOTICE. BASED ON DATA SOURCED FROM THE COMBINED LOS ANGELES WESTSIDE MULTIPLE LISTING SERVICE AND PUBLIC RECORDS. STATISTICS ARE SUBJECT TO CHANGE DUE TO INDIVIDUAL REAL ESTATE COMPANY REPORTING DISCIPLINES. BUYER ADVANTAGE OR SELLER ADVANTAGE IS STRICTLY OF THE OPINION OF LEHOA GACKI AND ACCURACY CANNOT BE GUARANTEED AND MAY NOT REFLECT ALL REAL ESTATE ACTIVITY ON THE MARKET. ALL PROPERTY INFORMATION, INCLUDING, BUT NOT LIMITED TO MAPS, GRAPHS, DEPICTIONS, SQUARE FOOTAGE, ROOM COUNT, NUMBER OF BEDROOMS AND THE SCHOOL DISTRICT IN PROPERTY LISTINGS SHOULD BE VERIFIED BY YOUR OWN ATTORNEY, ARCHITECT OR ZONING EXPERT. NEW CONSTRUCTION COUNT, SQUARE FOOTAGE AND YEAR BUILT IS BASED ON INDIVIDUAL REAL ESTATE COMPANY REPORTING AND MAY BE DIFFERENT THAN PUBLIC RECORDS. NEW CONSTRUCTION COUNT IS BASED ON LISTING BROKERAGE LISTING YEAR. THE BROKER/AGENT PROVIDING THE INFORMATION CONTAINED HEREIN MAY OR MAY HAVE NOT BEEN THE LISTING AND/OR SELLING AGENT. THIS IS NOT INTENDED TO SOLICIT PROPERTY ALREADY LISTED. EQUAL HOUSING OPPORTUNITY. NEIGHBORHOOD BOUNDARY SOURCE: PUBLIC RECORDS, COMBINED LOS ANGELES WESTSIDE MULTIPLE LISTING SERVICE AND LOS ANGELES TIMES MAPPING L.A. https://maps.latimes.com/neighborhoods/index.html HIDDEN HILLS
LeHoa Gacki, DRE #01422855 Douglas
Note: Square Footage calculation could be more or less (+-) 20% difference. (Based on calculation.) *
Range
Range
SOLD HOME PRICE PER SQUARE FOOT - PRE & POST MAR 2020 PANDEMIC
ON
BEFORE SOLD- PRE & POST MAR 2020
$1,063 $766 $740 $731 $980 $1,022 $1,260 $1,191 $1,071 $821 $752 $842 $998 $1,055 $1,310 $1,227 $$200 $400 $600 $800 $1,000 $1,200 $1,400 Jan 01 to Jun 30, 2019 Jul 01 to Dec 31, 2019 Jan 01 to Jun 30, 2020 Jul 01 to Dec 31, 2020 Jan 01 to Jun 30, 2021 Jul 01 to Dec 31, 2021 Jan 01 to Jun 30, 2022 Jul 01 to Dec 31, 2022 Median Price Per Square Foot Average Price per SquareFt 70 86 47 63 41 37 46 2110 20 30 40 50 60 70 80 90 100 Jan 01 to Jun 30, 2019 Jul 01 to Dec 31, 2019 Jan 01 to Jun 30, 2020 Jul 01 to Dec 31, 2020 Jan 01 to Jun 30, 2021 Jul 01 to Dec 31, 2021 Jan 01 to Jun 30, 2022 Jul 01 to Dec 31, 2022 Number of Homes Sold 12 13 10 23 28 23 20 9 Days on Market before Sold 6.4 6.3 12.0 0.0 2.0 4.0 6.0 8.0 10.0 12.0 14.0 Jan 31, 2023 Feb 28, 2023 Mar 31, 2023 Number of months it would take to sell all properties listed for sale if no new listings entered the market. END OF HIDDEN HILLS 6 PAGE REPORT
DAYS
PANDEMIC MONTHS SUPPLY OF INVENTORY - BASED ON LAST FEW MONTHS OF HOME SALES HIDDEN HILLS HIDDEN HILLS HIDDEN HILLS 3 and Under Favors Seller 4-6 = Balanced Market 7 and over Favors Buyer
MARKET
NEIGHBORING AREAS:
**Overbid/Underbid: 100 is list price paid. Under 100 means sold for less than asking, over 100 sold probably in multiples and over asking. Note: Square Footage calculation could be more or less (+-) 20% difference. (Based on calculation.)
Single Family Homes March 2023 $3,422,000 TYPICAL HOME PRICE (MEDIAN) $1,716 SOLD PRICE PER SQUARE FOOT 9 DAYS ON MARKET BEFORE SOLD (DOM) $2,497,531 MID-LOW $6,531,250 MID-HIGH For questions, comments, a tailor-made report for your home area, or a complimentary home valuation please contact LeHoa Gacki LeHoa Gacki Douglas Elliman Real Estate DRE #01422855 Lehoa.Gacki@elliman.com www.LeHoaGacki.com 424.276.7587 WHAT YOUR MONEY BUYS YOU THIS MONTH CLICK HERE FOR MORE Malibu Home Analysis from: March 01, 2023 to March 31, 2023 12 Sold Sold Price **Overbid/ Underbid Square Feet Price per/SqFt YB LotSqFt BD BA Days on Market Actual Lowest Sold $1,750,000 100 1853 $944 1960 2,135 3 3 0 Mid-Low* $2,497,531 94 1241 $968 1958 3,681 2 2 0 Typical Home Price (Median)* $3,422,000 99 2034 $1,716 1962 12,293 4 3 9 Mid-High* $6,531,250 100 2722 $3,045 1975 52,164 4 4 90 Actual Highest Sold $14,000,000 100 3819 $3,666 1965 55,276 4 3 0 Average $4,990,198 97 2420 $2,056 1972 27,958 3 3 49
Middle
Variance $4,033,719 Middle
Home
(Median)
less. Source: TheMLS/CLAW (Combined Los Angeles Westside) LeHoa’s Neighborhood Data Charts Los Angeles Real Estate LNDC MARCH 2023
A City in Los Angeles County Topanga Calabasas Westlake Village Agoura MALIBU Pacific Palisades
*
Range
Range Variance is future range Typical
Price
Price will vary by. Never more, Never
Malibu
Area Typical Home Price (Median) Price per/ SqFt Days on Market Mid-Low Mid-High Homes Sold Westlake Village $1,450,000 $609 22 $1,127,500 $2,174,375 25 Agoura $1,225,000 $550 24 $1,041,500 $1,888,000 19 Calabasas $2,025,000 $696 7 $1,720,000 $3,020,000 11 Topanga $2,175,000 $1,134 16 $1,998,899 $2,800,000 11 Pacific Palisades $6,200,000 $1,552 12 $4,875,000 $8,750,000 35
Buyer or Seller Advantage by Price Point for Malibu as of March 31, 2023
4-6 =
Based on last 3 months of homes sales, Malibu has 10.4 months supply of inventory.
HOME PRICE RANGE BUYER ADVANTAGE $100,000,000 $225,000,000 $80,000,000 $99,999,999 BUYER ADVANTAGE $60,000,000 $79,999,999 BUYER ADVANTAGE $50,000,000
BUYER ADVANTAGE $40,000,000
BUYER ADVANTAGE $35,000,000
BUYER ADVANTAGE $30,000,000
BUYER ADVANTAGE
BUYER ADVANTAGE $20,000,000
BUYER ADVANTAGE
BUYER ADVANTAGE $12,500,000
BUYER ADVANTAGE $10,000,000 $12,499,999 $9,000,000 $9,999,999 BUYER ADVANTAGE $8,000,000 $8,999,999 BUYER ADVANTAGE $7,000,000 $7,999,999 $6,500,000 $6,999,999 $6,000,000 $6,499,999 SELLER ADVANTAGE BUYER ADVANTAGE $5,500,000 $5,999,999 $5,000,000 $5,499,999 SELLER ADVANTAGE BUYER ADVANTAGE $4,500,000 $4,999,999 $4,000,000 $4,499,999 SELLER ADVANTAGE $3,500,000 $3,999,999 SELLER ADVANTAGE BUYER ADVANTAGE $3,000,000 $3,499,999 $2,500,000 $2,999,999 SELLER ADVANTAGE $2,000,000 $2,499,999 $1,500,000 $1,999,999 SELLER ADVANTAGE $1,000,000 $1,499,999 SELLER ADVANTAGE $500,000 $999,999
$59,999,999
$49,999,999
$39,999,999
$34,999,999
$25,000,000 $29,999,999
$24,999,999
$15,000,000 $19,999,999
$14,999,999
BALANCED MARKET
FAVORS SELLER
3 and under
BUYER
7 and over FAVORS
TO VIEW MORE View homes below Contact for up to date homes for sale
Months supply of Inventory =
Malibu Inventory for New Construction and Resale of Homes as of SELLER
SUPPLY & DEMAND
Source: TheMLS/CLAW (Combined Los Angeles Westside) Under Contract Pending - Closing Soon New Construction New Con DOM Resale Resale DOM Home Price Range Homes Resold 13 9 6 61 115 90 13 1 1 3 82 $500,000 $999,999 2 $1,000,000 $1,499,999 4 3 51 $1,500,000 $1,999,999 1 6 92 $2,000,000 $2,499,999 2 1 1 3 42 $2,500,000 $2,999,999 1 7 57 $3,000,000 $3,499,999 1 5 1 1 54 8 49 $3,500,000 $3,999,999 1 2 70 $4,000,000 $4,499,999 8 51 $4,500,000 $4,999,999 2 196 $5,000,000 $5,499,999 1 1 1 44 4 121 $5,500,000 $5,999,999 1 $6,000,000 $6,499,999 1 4 97 $6,500,000 $6,999,999 1 1 1 43 7 46 $7,000,000 $7,999,999 1 1 86 7 113 $8,000,000 $8,999,999 $9,000,000 $9,999,999 1 10 82 $10,000,000 $12,499,999 1 1 6 122 $12,500,000 $14,999,999 6 177 $15,000,000 $19,999,999 1 1 117 6 84 $20,000,000 $24,999,999 4 82 $25,000,000 $29,999,999 5 102 $30,000,000 $34,999,999 6 120 $35,000,000 $39,999,999 3 46 $40,000,000 $49,999,999 1 1 170 $50,000,000 $59,999,999 1 1 23 3 66 $60,000,000 $79,999,999 $80,000,000 $99,999,999 1 339 $100,000,000 $225,000,000 REALTORS
ADVANTAGE
For Sale
of March 31, 2023
BUYER / INVESTOR ADVANTAGE
DEMAND
Sold Homes Days on Market Before Sold = DOM January February March Resold DOM New Cons New DOM Homes Resold Resold DOM New Cons New DOM Homes Resold Resold DOM New Cons New DOM 76 10 45 12 49 52 2 3 2 3 21 1 83 1 35 0 1 58 2 59 6 1 0 2 2 1 43 1 247 100 1 82 1 7 0 1 0 1 143 0 1 55 1 127 1 0 419 1 23 212 REALTORS DIGEST
4 YEAR TREND
**Overbid / Underbid: 100 is list price paid. Under 100 means sold for less than asking, over 100 sold probably in multiples and over asking.
Note: Square Footage calculation could be more or less (+-) 20% difference. (Based on calculation.)
* Middle Range Variance $5,806,500 Middle Range Variance is future range Typical Home Price (Median) Price will vary by. Never more, Never less.
For questions, comments, a tailor-made report for your home area, or a complimentary home valuation please contact LeHoa Gacki

$1,987,500 $2,300,000 $2,742,000 $2,706,000 $3,105,000 $4,000,000 $4,350,000 $4,437,500 $5,650,000 $7,650,000 $8,750,000 $8,512,500 $$1,000,000 $2,000,000 $3,000,000 $4,000,000 $5,000,000 $6,000,000 $7,000,000 $8,000,000 $9,000,000 $10,000,000 Apr 01, 2019 to Mar 31, 2020 Apr 01, 2020 to Mar 31, 2021 Apr 01, 2021 to Mar 31, 2022 Apr 01, 2022 to Mar 31, 2023
Mid-Low Typical Home Price-Median Mid-High
LeHoa Gacki, DRE #01422855 Douglas Elliman Real Estate 11990 San Vicente Blvd., #100, L.A., Ca 90049 Email: Lehoa.Gacki@elliman.com Tel | Fax: (424) 276-7587 www.Lehoagacki.com | Lehoagacki.elliman.com 4 YEAR OBSERVATION Malibu Number of Homes Sold: 141 315 419 242 Apr 01, 2019 to Mar 31, 2020 Apr 01, 2020 to Mar 31, 2021 Apr 01, 2021 to Mar 31, 2022 Apr 01, 2022 to Mar 31, 2023 Actual Lowest Sold $740,000 $220,000 $225,000 $599,000 Mid-Low $1,987,500 $2,300,000 $2,742,000 $2,706,000 Typical Home Price-Median $3,105,000 $4,000,000 $4,350,000 $4,437,500 Mid-High $5,650,000 $7,650,000 $8,750,000 $8,512,500 Actual Highest Sold $100,000,000 $87,000,000 $177,000,000 $100,000,000 Average Price Sold $5,170,365 $6,023,533 $7,820,482 $8,106,834 12 MONTH OBSERVATION Malibu Cumulative 12 months sold home analysis from: April 01, 2022 to March 31, 2023 242 Sold Sold Price **Overbid / Underbid Square Feet Price per/SqFt YB LotSqFt BD BA Days on Market Actual Lowest Sold $599,000 96 848 $706 1947 3,863 2 2 66 Mid-Low* $2,706,000 94 1,730 $951 1955 7,764 3 3 0 Typical Home Price-Median* $4,437,500 100 2,469 $1,430 1972 22,374 4 3 20 Mid-High* $8,512,500 100 3,881 $2,517 1992 59,131 4 4 81 Actual Highest Sold $100,000,000 78 10,698 $9,348 2001 156,504 8 12 144 Average $8,106,834 98 3,305 $2,629 1977 102,330 4 4 60
Source: TheMLS/CLAW
© 2022 LEHOA GACKI. DRE# 01422855. ALL WORLDWIDE RIGHTS RESERVED. DOUGLAS ELLIMAN REAL ESTATE. 150 EL CAMINO DRIVE, BEVERLY HILLS, CA 90212. 310.595.3888. ALL MATERIAL PRESENTED HEREIN IS INTENDED FOR INFORMATION PURPOSES ONLY AND NOT INTENDED TO CONSTITUTE PROFESSIONAL ADVICE OR WARRANTY OUTSIDE THE REALM OF REAL ESTATE BROKERAGE. MAPS CREATED FOR REFERENCE PURPOSE ONLY. WHILE THIS INFORMATION IS BELIEVED TO BE CORRECT, IT IS REPRESENTED SUBJECT TO ERRORS, OMISSIONS, CHANGES OR WITHDRAWAL WITHOUT NOTICE. BASED ON DATA SOURCED FROM THE COMBINED LOS ANGELES WESTSIDE MULTIPLE LISTING SERVICE AND PUBLIC RECORDS. STATISTICS ARE SUBJECT TO CHANGE DUE TO INDIVIDUAL REAL ESTATE COMPANY REPORTING DISCIPLINES. BUYER ADVANTAGE OR SELLER ADVANTAGE IS STRICTLY OF THE OPINION OF LEHOA GACKI AND ACCURACY CANNOT BE GUARANTEED AND MAY NOT REFLECT ALL REAL ESTATE ACTIVITY ON THE MARKET. ALL PROPERTY INFORMATION, INCLUDING, BUT NOT LIMITED TO MAPS, GRAPHS, DEPICTIONS, SQUARE FOOTAGE, ROOM COUNT, NUMBER OF BEDROOMS AND THE SCHOOL DISTRICT IN PROPERTY LISTINGS SHOULD BE VERIFIED BY YOUR OWN ATTORNEY, ARCHITECT OR ZONING EXPERT. NEW CONSTRUCTION COUNT, SQUARE FOOTAGE AND YEAR BUILT IS BASED ON INDIVIDUAL REAL ESTATE COMPANY REPORTING AND MAY BE DIFFERENT THAN PUBLIC RECORDS. NEW CONSTRUCTION COUNT IS BASED ON LISTING BROKERAGE LISTING YEAR. THE BROKER/AGENT PROVIDING THE INFORMATION CONTAINED HEREIN MAY OR MAY HAVE NOT BEEN THE LISTING AND/OR SELLING AGENT. THIS IS NOT INTENDED TO SOLICIT PROPERTY ALREADY LISTED. EQUAL HOUSING OPPORTUNITY. NEIGHBORHOOD BOUNDARY SOURCE: PUBLIC RECORDS, COMBINED LOS ANGELES WESTSIDE MULTIPLE LISTING SERVICE AND LOS ANGELES TIMES MAPPING L.A. https://maps.latimes.com/neighborhoods/index.html MALIBU
(Combined Los Angeles Westside)
SOLD HOME PRICE PER SQUARE FOOT - PRE & POST MAR 2020 PANDEMIC
$1,052 $1,011 $1,014 $1,174 $1,250 $1,365 $1,494 $1,430 $1,606 $1,420 $1,444 $1,710 $2,114 $2,525 $2,407 $3,177 $$500 $1,000 $1,500 $2,000 $2,500 $3,000 $3,500 Jan 01 to Jun 30, 2019 Jul 01 to Dec 31, 2019 Jan 01 to Jun 30, 2020 Jul 01 to Dec 31, 2020 Jan 01 to Jun 30, 2021 Jul 01 to Dec 31, 2021 Jan 01 to Jun 30, 2022 Jul 01 to Dec 31, 2022 Median Price Per Square Foot Average Price per SquareFt 67 84 66 39 28 21 13 2810 20 30 40 50 60 70 80 90 Jan 01 to Jun 30, 2019 Jul 01 to Dec 31, 2019 Jan 01 to Jun 30, 2020 Jul 01 to Dec 31, 2020 Jan 01 to Jun 30, 2021 Jul 01 to Dec 31, 2021 Jan 01 to Jun 30, 2022 Jul 01 to Dec 31, 2022 Number of Homes Sold 58 75 69 189 209 205 182 120 Days on Market before Sold 5.7 5.8 10.4 0.0 2.0 4.0 6.0 8.0 10.0 12.0 Jan 31, 2023 Feb 28, 2023 Mar 31, 2023 Number of months it would take to sell all properties listed for sale if no new listings entered the market. END OF MALIBU 6 PAGE REPORT
DAYS ON MARKET
SOLD-
POST
PANDEMIC MONTHS SUPPLY OF INVENTORY - BASED ON LAST FEW MONTHS OF HOME SALES MALIBU MALIBU MALIBU 3 and Under Favors Seller 4-6 = Balanced Market 7 and over Favors Buyer
BEFORE
PRE &
MAR 2020
NEIGHBORING AREAS:
Single Family Homes March 2023 $2,175,000 TYPICAL HOME PRICE (MEDIAN) $1,134 SOLD PRICE PER SQUARE FOOT 16 DAYS ON MARKET BEFORE SOLD (DOM) $1,998,899 MID-LOW $2,800,000 MID-HIGH For questions, comments, a tailor-made report for your home area, or a complimentary home valuation please contact LeHoa Gacki LeHoa Gacki Douglas Elliman Real Estate DRE #01422855 Lehoa.Gacki@elliman.com www.LeHoaGacki.com 424.276.7587 WHAT YOUR MONEY BUYS YOU THIS MONTH CLICK HERE FOR MORE Topanga Home Analysis from: March 01, 2023 to March 31, 2023 11 Sold Sold Price **Overbid/ Underbid Square Feet Price per/SqFt YB LotSqFt BD BA Days on Market Actual Lowest Sold $1,075,000 93 2,293 $469 2022 5,338 3 3 95 Mid-Low* $1,998,899 97 1,276 $909 1947 21,714 2 2 0 Typical Home Price (Median)* $2,175,000 100 1,918 $1,134 1979 50,655 3 3 16 Mid-High* $2,800,000 100 2,293 $1,625 1997 77,972 4 3 95 Actual Highest Sold $3,495,914 100 3,400 $1,028 1991 50,655 4 3 8 Average $2,363,619 98 2,235 $1,358 1972 89,547 3 3 43 **Overbid/Underbid:
Note: Square Footage calculation could be more or less
20% difference. (Based on calculation.) * Middle Range Variance $801,101 Middle Range Variance is future range Typical Home Price (Median) Price will vary by. Never more, Never less. Source: TheMLS/CLAW (Combined Los Angeles Westside) LeHoa’s Neighborhood Data Charts Los Angeles Real Estate LNDC MARCH 2023 Topanga An unincorporated area in Los Angeles County TOPANGA Calabasas Malibu Pacific Palicades Woodland Hills
100 is list price paid. Under 100 means sold for less than asking, over 100 sold probably in multiples and over asking.
(+-)
Area Typical Home Price (Median) Price per/ SqFt Days on Market Mid-Low Mid-High Homes Sold Calabasas $2,025,000 $696 7 $1,720,000 $3,020,000 11 Woodland Hills $1,300,000 $622 11 $1,077,000 $1,500,000 47 Pacific Palisades $6,200,000 $1,552 12 $4,875,000 $8,750,000 35 Malibu $3,422,000 $1,716 9 $2,497,531 $6,531,250 12
Buyer or Seller Advantage by Price Point for Topanga as of March 31, 2023
Months supply
4-6 =
Based on last 3 months of homes sales, Topanga has 3.7 months supply of inventory.
3
7
HOME PRICE RANGE BUYER ADVANTAGE $6,000,000 $12,000,000 $3,000,000 $5,999,999 SELLER ADVANTAGE $2,200,000 $2,999,999 $2,100,000 $2,199,999 SELLER ADVANTAGE $2,050,000 $2,099,999 SELLER ADVANTAGE $2,000,000 $2,049,999 SELLER ADVANTAGE $1,500,000 $1,999,999 SELLER ADVANTAGE $1,450,000 $1,499,999 SELLER ADVANTAGE $1,400,000 $1,449,999 $1,350,000 $1,399,999 SELLER ADVANTAGE BUYER ADVANTAGE $1,300,000 $1,349,999 $1,250,000 $1,299,999 SELLER ADVANTAGE $1,200,000 $1,249,999 SELLER ADVANTAGE BUYER ADVANTAGE $1,150,000 $1,199,999 $1,100,000 $1,149,999 $1,050,000 $1,099,999 SELLER ADVANTAGE $1,000,000 $1,049,999 $950,000 $999,999 $900,000 $949,999 $850,000 $899,999 $800,000 $849,999 SELLER ADVANTAGE $750,000 $799,999 $700,000 $749,999 $650,000 $699,999 $600,000 $649,999 $550,000 $599,999 $500,000 $549,999 $100,000 $499,999
BALANCED MARKET
SELLER
and under FAVORS
and over FAVORS BUYER
of
View homes below Contact for up to date homes for sale
Inventory =
Topanga Inventory for New Construction and Resale of Homes as SELLER ADVANTAGE
& DEMAND
TheMLS/CLAW (Combined Los Angeles Westside) Under Contract Pending - Closing Soon New Construction New Con DOM Resale Resale DOM Home Price Range Homes Resold 6 3 1 225 20 71 5 $100,000 $499,999 $500,000 $549,999 $550,000 $599,999 $600,000 $649,999 $650,000 $699,999 $700,000 $749,999 $750,000 $799,999 1 $800,000 $849,999 $850,000 $899,999 $900,000 $949,999 $950,000 $999,999 $1,000,000 $1,049,999 1 17 $1,050,000 $1,099,999 $1,100,000 $1,149,999 1 9 $1,150,000 $1,199,999 $1,200,000 $1,249,999 1 1 1 45 $1,250,000 $1,299,999 1 17 $1,300,000 $1,349,999 1 1 11 $1,350,000 $1,399,999 $1,400,000 $1,449,999 1 $1,450,000 $1,499,999 1 3 53 $1,500,000 $1,999,999 2 $2,000,000 $2,049,999 1 1 139 $2,050,000 $2,099,999 $2,100,000 $2,199,999 1 1 225 6 112 $2,200,000 $2,999,999 2 1 1 2 30 $3,000,000 $5,999,999 3 97 $6,000,000 $12,000,000 REALTORS
SUPPLY
For Sale Source:
BUYER / INVESTOR ADVANTAGE
as of March
DEMAND
31, 2023
Sold Homes Days on Market Before Sold = DOM January February March Resold DOM New Cons New DOM Homes Resold Resold DOM New Cons New DOM Homes Resold Resold DOM New Cons New DOM 47 1 21 10 38 1 95 1 95 68 77 2 11 1 0 2 9 7 3 68 1 21 2 69 REALTORS DIGEST
4 YEAR TREND
Mid-Low Typical Home Price-Median Mid-High
**Overbid / Underbid: 100 is list price paid. Under 100 means sold for less than asking, over 100 sold probably in multiples and over asking.
Note: Square Footage calculation could be more or less (+-) 20% difference. (Based on calculation.)
* Middle Range Variance $1,212,500 Middle Range Variance is future range Typical Home Price (Median) Price will vary by. Never more, Never less.
TheMLS/CLAW (Combined Los Angeles Westside)
For questions, comments, a tailor-made report for your home area, or a complimentary home valuation please contact LeHoa Gacki
$1,018,750 $1,105,000 $1,378,000 $1,350,000 $1,302,500 $1,449,500 $1,800,000 $1,900,000 $1,876,000 $1,818,750 $2,330,750 $2,562,500 $$500,000 $1,000,000 $1,500,000 $2,000,000 $2,500,000 $3,000,000 Apr 01, 2019 to Mar 31, 2020 Apr 01, 2020 to Mar 31, 2021 Apr 01, 2021 to Mar 31, 2022 Apr 01, 2022 to Mar 31, 2023
LeHoa Gacki, DRE #01422855 Douglas Elliman Real Estate 11990 San Vicente Blvd., #100, L.A., Ca 90049 Email: Lehoa.Gacki@elliman.com Tel | Fax: (424) 276-7587 www.Lehoagacki.com | Lehoagacki.elliman.com 4 YEAR OBSERVATION Topanga Number of Homes Sold: 106 128 105 95 Apr 01, 2019 to Mar 31, 2020 Apr 01, 2020 to Mar 31, 2021 Apr 01, 2021 to Mar 31, 2022 Apr 01, 2022 to Mar 31, 2023 Actual Lowest Sold $390,000 $350,000 $601,000 $650,000 Mid-Low $1,018,750 $1,105,000 $1,378,000 $1,350,000 Typical Home Price-Median $1,302,500 $1,449,500 $1,800,000 $1,900,000 Mid-High $1,876,000 $1,818,750 $2,330,750 $2,562,500 Actual Highest Sold $5,443,000 $4,550,000 $11,100,000 $9,000,000 Average Price Sold $1,574,647 $1,611,606 $2,101,879 $2,192,778 12 MONTH OBSERVATION Topanga Cumulative 12 months sold home analysis from: April 01, 2022 to March 31, 2023 95 Sold Sold Price **Overbid / Underbid Square Feet Price per/SqFt YB LotSqFt BD BA Days on Market Actual Lowest Sold $650,000 46 320 $2,031 1954 211,647 2 1 129 Mid-Low* $1,350,000 95 1,247 $780 1943 10,538 2 2 8 Typical Home Price-Median* $1,900,000 100 2,039 $948 1968 19,534 3 3 16 Mid-High* $2,562,500 104 2,655 $1,249 1988 74,953 4 3 49 Actual Highest Sold $9,000,000 100 838 $10,740 1994 224,189 2 2 0 Average $2,192,778 100 2,183 $1,263 1966 111,152 3 3 46
Source:
© 2022 LEHOA GACKI. DRE# 01422855. ALL WORLDWIDE RIGHTS RESERVED. DOUGLAS ELLIMAN REAL ESTATE. 150 EL CAMINO DRIVE, BEVERLY HILLS, CA 90212. 310.595.3888. ALL MATERIAL PRESENTED HEREIN IS INTENDED FOR INFORMATION PURPOSES ONLY AND NOT INTENDED TO CONSTITUTE PROFESSIONAL ADVICE OR WARRANTY OUTSIDE THE REALM OF REAL ESTATE BROKERAGE. MAPS CREATED FOR REFERENCE PURPOSE ONLY. WHILE THIS INFORMATION IS BELIEVED TO BE CORRECT, IT IS REPRESENTED SUBJECT TO ERRORS, OMISSIONS, CHANGES OR WITHDRAWAL WITHOUT NOTICE. BASED ON DATA SOURCED FROM THE COMBINED LOS ANGELES WESTSIDE MULTIPLE LISTING SERVICE AND PUBLIC RECORDS. STATISTICS ARE SUBJECT TO CHANGE DUE TO INDIVIDUAL REAL ESTATE COMPANY REPORTING DISCIPLINES. BUYER ADVANTAGE OR SELLER ADVANTAGE IS STRICTLY OF THE OPINION OF LEHOA GACKI AND ACCURACY CANNOT BE GUARANTEED AND MAY NOT REFLECT ALL REAL ESTATE ACTIVITY ON THE MARKET. ALL PROPERTY INFORMATION, INCLUDING, BUT NOT LIMITED TO MAPS, GRAPHS, DEPICTIONS, SQUARE FOOTAGE, ROOM COUNT, NUMBER OF BEDROOMS AND THE SCHOOL DISTRICT IN PROPERTY LISTINGS SHOULD BE VERIFIED BY YOUR OWN ATTORNEY, ARCHITECT OR ZONING EXPERT. NEW CONSTRUCTION COUNT, SQUARE FOOTAGE AND YEAR BUILT IS BASED ON INDIVIDUAL REAL ESTATE COMPANY REPORTING AND MAY BE DIFFERENT THAN PUBLIC RECORDS. NEW CONSTRUCTION COUNT IS BASED ON LISTING BROKERAGE LISTING YEAR. THE BROKER/AGENT PROVIDING THE INFORMATION CONTAINED HEREIN MAY OR MAY HAVE NOT BEEN THE LISTING AND/OR SELLING AGENT. THIS IS NOT INTENDED TO SOLICIT PROPERTY ALREADY LISTED. EQUAL HOUSING OPPORTUNITY. NEIGHBORHOOD BOUNDARY SOURCE: PUBLIC RECORDS, COMBINED LOS ANGELES WESTSIDE MULTIPLE LISTING SERVICE AND LOS ANGELES TIMES MAPPING L.A. https://maps.latimes.com/neighborhoods/index.html TOPANGA
SOLD HOME PRICE PER SQUARE FOOT - PRE & POST MAR 2020 PANDEMIC
DAYS ON MARKET BEFORE SOLD- PRE & POST MAR 2020 PANDEMIC
MONTHS SUPPLY OF INVENTORY - BASED ON LAST FEW MONTHS OF HOME SALES
3.0 4.6 3.7 0.0 0.5 1.0 1.5 2.0 2.5 3.0 3.5 4.0 4.5 5.0 Jan 31, 2023 Feb 28, 2023 Mar 31, 2023 Number of months it would take to sell all properties listed for sale if no new listings entered the market. 35 50 39 29 24 13 14 2110 20 30 40 50 60 Jan 01 to Jun 30, 2019 Jul 01 to Dec 31, 2019 Jan 01 to Jun 30, 2020 Jul 01 to Dec 31, 2020 Jan 01 to Jun 30, 2021 Jul 01 to Dec 31, 2021 Jan 01 to Jun 30, 2022 Jul 01 to Dec 31, 2022 Number of Homes Sold 49 54 40 78 62 54 61 39 Days on Market before Sold $673 $613 $628 $724 $793 $883 $816 $1,007 $718 $714 $700 $794 $937 $952 $978 $1,488 $$200 $400 $600 $800 $1,000 $1,200 $1,400 $1,600 Jan 01 to Jun 30, 2019 Jul 01 to Dec 31, 2019 Jan 01 to Jun 30, 2020 Jul 01 to Dec 31, 2020 Jan 01 to Jun 30, 2021 Jul 01 to Dec 31, 2021 Jan 01 to Jun 30, 2022 Jul 01 to Dec 31, 2022 Median Price Per Square Foot Average Price per SquareFt END OF TOPANGA 6 PAGE REPORT
TOPANGA TOPANGA TOPANGA 3 and Under Favors Seller 4-6 = Balanced Market 7 and over Favors Buyer
Westlake Village
**Overbid/Underbid: 100 is list price paid. Under 100 means sold for less than asking, over 100 sold probably in multiples and over asking.
Footage calculation could be more or less (+-) 20% difference. (Based on calculation.)
Single Family Homes March 2023 $1,450,000 TYPICAL HOME PRICE (MEDIAN) $609 SOLD PRICE PER SQUARE FOOT 22 DAYS ON MARKET BEFORE SOLD (DOM) $1,127,500 MID-LOW $2,174,375 MID-HIGH For questions, comments, a tailor-made report for your home area, or a complimentary home valuation please contact LeHoa Gacki LeHoa Gacki Douglas Elliman Real Estate DRE #01422855 Lehoa.Gacki@elliman.com www.LeHoaGacki.com 424.276.7587 WHAT YOUR MONEY BUYS YOU THIS MONTH CLICK HERE FOR MORE WestlakeVillage Home Analysis from: March 01, 2023 to March 31, 2023 25 Sold Sold Price **Overbid/ Underbid Square Feet Price per/SqFt YB LotSqFt BD BA Days on Market Actual Lowest Sold $750,000 94 1,231 $609 1973 3,655 2 2 23 Mid-Low* $1,127,500 96 1,945 $532 1971 7,090 3 3 9 Typical Home Price (Median)* $1,450,000 99 2,396 $609 1977 9,850 4 3 22 Mid-High* $2,174,375 100 3,445 $731 1989 18,572 4 4 56 Actual Highest Sold $5,995,000 100 4,485 $1,337 2022 7,525 4 5 16 Average $1,818,506 98 2,674 $654 1981 29,601 4 3 34
Square
* Middle Range Variance $1,046,875 Middle Range Variance is future range Typical Home Price (Median) Price will vary by. Never more, Never less. Source: TheMLS/CLAW (Combined Los Angeles Westside) LeHoa’s Neighborhood Data Charts Los Angeles Real Estate LNDC MARCH 2023
Note:
A City in Los Angeles County WESTLAKE VILLAGE Agoura Malibu
Area Typical Home Price (Median) Price per/ SqFt Days on Market Mid-Low Mid-High Homes Sold Agoura $1,225,000 $550 24 $1,041,500 $1,888,000 19 Malibu $3,422,000 $1,716 9 $2,497,531 $6,531,250 12
NEIGHBORING AREAS:
Buyer or Seller Advantage by Price Point for Westlake Village as of March 31, 2023
Months supply of Inventory =
4-6 = BALANCED MARKET
Based
3 and under FAVORS SELLER
7 and over FAVORS BUYER
$2,249,999 SELLER ADVANTAGE
$1,750,000 $1,999,999 SELLER ADVANTAGE $1,500,000 $1,749,999
$1,250,000 $1,499,999 SELLER ADVANTAGE
$1,000,000 $1,249,999 SELLER ADVANTAGE
$900,000 $999,999 SELLER ADVANTAGE
$800,000 $899,999
$100,000 $799,999
SELLER ADVANTAGE
SELLER ADVANTAGE
HOME PRICE RANGE $40,000,000 $50,000,000 $30,000,000 $39,999,999 $20,000,000 $29,999,999 BUYER ADVANTAGE $15,000,000 $19,999,999 BUYER ADVANTAGE $12,250,000 $14,999,999 $10,000,000 $12,249,999 SELLER ADVANTAGE $9,000,000 $9,999,999 $8,000,000 $8,999,999 $7,000,000 $7,999,999 BUYER ADVANTAGE $6,500,000 $6,999,999 BUYER ADVANTAGE $6,000,000 $6,499,999 BUYER ADVANTAGE $5,500,000 $5,999,999 $5,000,000 $5,499,999 $4,500,000 $4,999,999 BUYER ADVANTAGE $4,000,000 $4,499,999 $3,500,000 $3,999,999 SELLER ADVANTAGE $3,000,000 $3,499,999 SELLER ADVANTAGE BUYER ADVANTAGE $2,750,000 $2,999,999 $2,500,000 $2,749,999 SELLER ADVANTAGE $2,250,000 $2,499,999 SELLER ADVANTAGE $2,000,000
on last 3 months of homes sales, Westlake Village has 3.3 months supply of inventory.
View homes below Contact for up to date homes for sale
Westlake Village Inventory for New Construction and Resale of Homes
SELLER
ADVANTAGE SUPPLY & DEMAND For Sale
Under Contract Pending - Closing Soon New Construction New Con DOM Resale Resale DOM Home Price Range Homes Resold 4 13 7 139 55 61 15 1 39 $100,000 $799,999 2 $800,000 $899,999 1 16 $900,000 $999,999 1 1 $1,000,000 $1,249,999 4 1 3 28 $1,250,000 $1,499,999 2 2 6 26 $1,500,000 $1,749,999 2 5 46 $1,750,000 $1,999,999 1 2 3 15 $2,000,000 $2,249,999 2 1 1 37 $2,250,000 $2,499,999 1 1 $2,500,000 $2,749,999 2 36 $2,750,000 $2,999,999 2 59 $3,000,000 $3,499,999 1 $3,500,000 $3,999,999 1 1 5 63 $4,000,000 $4,499,999 4 2 126 3 27 $4,500,000 $4,999,999 1 1 269 2 201 $5,000,000 $5,499,999 1 213 4 65 $5,500,000 $5,999,999 5 52 $6,000,000 $6,499,999 2 99 3 72 $6,500,000 $6,999,999 $7,000,000 $7,999,999 2 123 $8,000,000 $8,999,999 $9,000,000 $9,999,999 1 1 31 $10,000,000 $12,249,999 3 155 $12,250,000 $14,999,999 1 39 3 92 $15,000,000 $19,999,999 $20,000,000 $29,999,999 $30,000,000 $39,999,999 $40,000,000 $50,000,000 REALTORS
Source: TheMLS/CLAW (Combined Los Angeles Westside)
Homes as of March 31, 2023
BUYER / INVESTOR ADVANTAGE
DEMAND
Sold Homes Days on Market Before Sold = DOM January February March Resold DOM New Cons New DOM Homes Resold Resold DOM New Cons New DOM Homes Resold Resold DOM New Cons New DOM 68 1 0 15 55 24 35 1 16 15 1 53 1 23 2 78 1 0 272 1 22 7 4 40 6 40 101 2 80 4 61 3 29 0 1 76 3 32 84 42 1 20 2 21 2 50 203 2 58 2 0 79 1 56 1 16 1 0 REALTORS DIGEST
4 YEAR TREND
Mid-Low Typical Home Price-Median Mid-High
**Overbid / Underbid: 100 is list price paid. Under 100 means sold for less than asking, over 100 sold probably in multiples and over asking.
Note: Square Footage calculation could be more or less (+-) 20% difference. (Based on calculation.)
* Middle Range Variance $1,394,000 Middle Range Variance is future range Typical Home Price (Median) Price will vary by. Never more, Never less.
TheMLS/CLAW (Combined Los Angeles Westside)
For questions, comments, a tailor-made report for your home area, or a complimentary home valuation please contact LeHoa Gacki
$1,050,000 $1,100,000 $1,295,000 $1,360,000 $1,416,500 $1,545,000 $1,790,000 $1,784,000 $1,977,500 $2,210,000 $2,950,000 $2,754,000 $$500,000 $1,000,000 $1,500,000 $2,000,000 $2,500,000 $3,000,000 $3,500,000 Apr 01, 2019 to Mar 31, 2020 Apr 01, 2020 to Mar 31, 2021 Apr 01, 2021 to Mar 31, 2022 Apr 01, 2022 to Mar 31, 2023
LeHoa Gacki, DRE #01422855 Douglas Elliman Real Estate 11990 San Vicente Blvd., #100, L.A., Ca 90049 Email: Lehoa.Gacki@elliman.com Tel | Fax: (424) 276-7587 www.Lehoagacki.com | Lehoagacki.elliman.com 4 YEAR OBSERVATION WestlakeVillage Number of Homes Sold: 362 443 457 300 Apr 01, 2019 to Mar 31, 2020 Apr 01, 2020 to Mar 31, 2021 Apr 01, 2021 to Mar 31, 2022 Apr 01, 2022 to Mar 31, 2023 Actual Lowest Sold $361,000 $445,000 $375,000 $440,000 Mid-Low $1,050,000 $1,100,000 $1,295,000 $1,360,000 Typical Home Price-Median $1,416,500 $1,545,000 $1,790,000 $1,784,000 Mid-High $1,977,500 $2,210,000 $2,950,000 $2,754,000 Actual Highest Sold $35,000,000 $12,600,000 $12,500,000 $9,200,000 Average Price Sold $1,945,671 $1,935,530 $2,333,335 $2,328,737 12 MONTH OBSERVATION WestlakeVillage Cumulative 12 months sold home analysis from: April 01, 2022 to March 31, 2023 300 Sold Sold Price **Overbid / Underbid Square Feet Price per/SqFt YB LotSqFt BD BA Days on Market Actual Lowest Sold $440,000 93 1,632 $270 1976 3,842 2 2 22 Mid-Low* $1,360,000 96 2,097 $579 1970 7,134 3 3 7 Typical Home Price-Median* $1,784,000 100 2,657 $663 1978 10,636 4 3 22 Mid-High* $2,754,000 103 3,876 $769 1990 22,071 5 4 49 Actual Highest Sold $9,200,000 92 10,700 $860 1999 52,261 5 6 145 Average $2,328,737 100 3,285 $704 1982 30,381 4 4 36
Source:
© 2022 LEHOA GACKI. DRE# 01422855. ALL WORLDWIDE RIGHTS RESERVED. DOUGLAS ELLIMAN REAL ESTATE. 150 EL CAMINO DRIVE, BEVERLY HILLS, CA 90212. 310.595.3888. ALL MATERIAL PRESENTED HEREIN IS INTENDED FOR INFORMATION PURPOSES ONLY AND NOT INTENDED TO CONSTITUTE PROFESSIONAL ADVICE OR WARRANTY OUTSIDE THE REALM OF REAL ESTATE BROKERAGE. MAPS CREATED FOR REFERENCE PURPOSE ONLY. WHILE THIS INFORMATION IS BELIEVED TO BE CORRECT, IT IS REPRESENTED SUBJECT TO ERRORS, OMISSIONS, CHANGES OR WITHDRAWAL WITHOUT NOTICE. BASED ON DATA SOURCED FROM THE COMBINED LOS ANGELES WESTSIDE MULTIPLE LISTING SERVICE AND PUBLIC RECORDS. STATISTICS ARE SUBJECT TO CHANGE DUE TO INDIVIDUAL REAL ESTATE COMPANY REPORTING DISCIPLINES. BUYER ADVANTAGE OR SELLER ADVANTAGE IS STRICTLY OF THE OPINION OF LEHOA GACKI AND ACCURACY CANNOT BE GUARANTEED AND MAY NOT REFLECT ALL REAL ESTATE ACTIVITY ON THE MARKET. ALL PROPERTY INFORMATION, INCLUDING, BUT NOT LIMITED TO MAPS, GRAPHS, DEPICTIONS, SQUARE FOOTAGE, ROOM COUNT, NUMBER OF BEDROOMS AND THE SCHOOL DISTRICT IN PROPERTY LISTINGS SHOULD BE VERIFIED BY YOUR OWN ATTORNEY, ARCHITECT OR ZONING EXPERT. NEW CONSTRUCTION COUNT, SQUARE FOOTAGE AND YEAR BUILT IS BASED ON INDIVIDUAL REAL ESTATE COMPANY REPORTING AND MAY BE DIFFERENT THAN PUBLIC RECORDS. NEW CONSTRUCTION COUNT IS BASED ON LISTING BROKERAGE LISTING YEAR. THE BROKER/AGENT PROVIDING THE INFORMATION CONTAINED HEREIN MAY OR MAY HAVE NOT BEEN THE LISTING AND/OR SELLING AGENT. THIS IS NOT INTENDED TO SOLICIT PROPERTY ALREADY LISTED. EQUAL HOUSING OPPORTUNITY. NEIGHBORHOOD BOUNDARY SOURCE: PUBLIC RECORDS, COMBINED LOS ANGELES WESTSIDE MULTIPLE LISTING SERVICE AND LOS ANGELES TIMES MAPPING L.A. https://maps.latimes.com/neighborhoods/index.html
WESTLAKE VILLAGE
SOLD HOME PRICE PER SQUARE FOOT - PRE & POST MAR 2020 PANDEMIC
DAYS ON MARKET BEFORE SOLD- PRE & POST MAR 2020 PANDEMIC
MONTHS SUPPLY OF INVENTORY - BASED ON LAST FEW MONTHS OF HOME SALES
3.3 3.8 3.3 2.9 3.0 3.1 3.2 3.3 3.4 3.5 3.6 3.7 3.8 3.9 Jan 31, 2023 Feb 28, 2023 Mar 31, 2023 Number of months it would take to sell all properties listed for sale if no new listings entered the market. 43 48 54 36 30 30 18 2610 20 30 40 50 60 Jan 01 to Jun 30, 2019 Jul 01 to Dec 31, 2019 Jan 01 to Jun 30, 2020 Jul 01 to Dec 31, 2020 Jan 01 to Jun 30, 2021 Jul 01 to Dec 31, 2021 Jan 01 to Jun 30, 2022 Jul 01 to Dec 31, 2022 Number of Homes Sold 156 196 152 265 263 217 180 138 Days on Market before Sold $462 $470 $481 $496 $567 $604 $686 $664 $487 $508 $511 $526 $615 $644 $735 $701 $$100 $200 $300 $400 $500 $600 $700 $800 Jan 01 to Jun 30, 2019 Jul 01 to Dec 31, 2019 Jan 01 to Jun 30, 2020 Jul 01 to Dec 31, 2020 Jan 01 to Jun 30, 2021 Jul 01 to Dec 31, 2021 Jan 01 to Jun 30, 2022 Jul 01 to Dec 31, 2022 Median Price Per Square Foot Average Price per SquareFt END OF WESTLAKE VILLAGE 6 PAGE REPORT
WESTLAKE
WESTLAKE VILLAGE WESTLAKE VILLAGE 3 and Under Favors Seller 4-6 = Balanced Market 7 and over Favors Buyer
VILLAGE