
LeHoa Gacki Douglas Elliman Real Estate DRE #01422855
424.276.7587
All areas are based on neighborhoods mapped out by the
Angeles Times Mapping L.A. but with
Hills added.
Upon request, any data point can be supplied with links to view the properties.
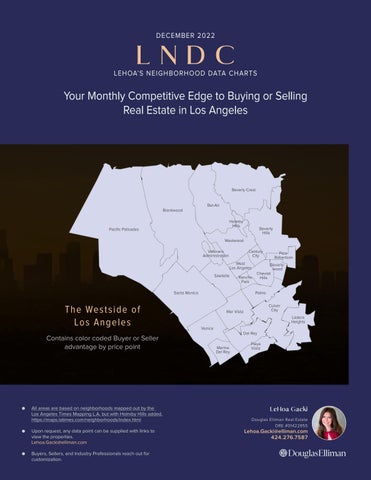
Buyers, Sellers, and Industry Professionals reach out for customization. The Westside of Los Angeles Brentwood Westwood Beverly Hills Beverlywood Beverly Crest Pacific Palisades Sawtelle Santa Monica Mar Vista Del Rey Marina Del Rey Palms Venice Cheviot Hills Culver City Playa Vista Ladera Heights Rancho Park PicoRobertson Century City West Los Angeles Veterans Administration Bel-Air Holmby Hills Your Monthly Competitive Edge to Buying or Selling Real Estate in Los Angeles Contains color coded Buyer or Seller advantage by price point LNDC LEHOA’S NEIGHBORHOOD DATA CHARTS DECEMBER 2022
Lehoa.Gacki@elliman.com
●
Los
Holmby
https://maps.latimes.com/neighborhoods/index.html ●
Lehoa.Gacki@elliman.com ●
About LNDC
LeHoa’s Neighborhood Data Charts (LNDC) helps any Buyer, Seller, Investor, or Industry Professional navigate Los Angeles Real Estate.

Each area is 6 pages and provides invaluable information for anyone interested in the intricate Los Angeles Real Estate market. LNDC instantly advises what neighboring areas are priced at, what your money buys you the past month, plus 4 year historical fluctuations. LNDC also provides a Buyer or Seller advantage based on price bracket. Including, a bonus “Realtors Digest” separating new construction from resale and showing properties under contract, past 3 months sold transactions, Days on Market (DOM) prior to sale all separated by price bracket.
For questions, comments, a tailor-made report for your home area, or a complimentary home valuation please contact LeHoa Gacki.
Westside

Contents → → → → → → → → → → → → → → → → → → → → → Bel-Air Beverly Crest Beverly Hills Beverlywood Brentwood Century City Cheviot Hills Culver City Del Rey Ladera Heights Mar Vista Pacific Palisades Palms Pico-Robertson Playa Vista Rancho Park Santa Monica Sawtelle Venice West Los Angeles Westwood Bel-Air Beverly Crest Beverly Hills Beverlywood Brentwood Century City Cheviot Hills Culver City Del Rey Ladera Heights Mar Vista Pacific Palisades Palms Pico-Robertson Playa Vista Rancho Park Santa Monica Sawtelle Venice West Los Angeles Westwood
Table of
About LeHoa
Is the market going up? Is the market going down? Are we in a housing bubble? Is the market going to crash! What news source has the accurate data? Do you find yourself listening, reading to numerous news sources wondering what to make of it? Well, mixing a bookkeeper with a business management & legal background, now currently a Realtor AND frustrated artist at heart; you get... a Data Geek. LeHoa breaks it down to Supply and Demand, it’s as basic and simple as it sounds. And she has created data to show you this simplified, yet grossly complicated subject.
LeHoa Gacki is a residential Realtor specializing in Luxury Home Sales throughout Los Angeles. Aside from simultaneously working with Buyers and Sellers, LeHoa also represents Real Estate Developers. Together they turn outdated homes to truly luxurious properties.

LeHoa, (also) a long time Brentwood resident, follows the market on a daily basis, knows instantly about every listing and has a detailed knowledge about various areas in Los Angeles County. In 2006, her accomplishments in Real Estate landed her a role as one of the first Realtors on the one and only “The Fabulous Life Presents: Really Rich Real Estate” VH1’s reality show.
LeHoa has extensive experience in business management, accounting, legal documentation, and above all, contract negotiation. Her charismatic and kind persona mixed with extensive knowledge about everything real estate makes her a force to be reckoned with. In addition, LeHoa is a data geek- and can tell anyone everything about the market through her custom data reports called LNDC(LeHoa’s Neighborhood Data Charts). LeHoa’s strong belief that knowledge is power reflects back on her success and is even furthered with her friendly and magnetic energy. Above all, LeHoa understands the importance of finding her clients their ideal home, where they would feel comfortable with their loved ones and will always be your Realtor before you need one.
Frequently Asked Questions
What is Month’s Supply Inventory based off of?
The number of months it would take to sell all the properties listed for sale at the current pace of sales and if no new listings entered the market based on the last 3 months of sales. Data is harvested from actual sales, not signed contracts or pending.
What is Buyer/Seller Advantage based off of?
It is based off of sold+signed, under contract, what’s for sale and pending.
What does DOM stand for?
Days on the market before entering contract.
What is median?
Median is the midpoint in price out of all of the homes sold. For example, in areas where all of the homes have the same lot home size, using an
average number will work, but, due to Los Angeles real state having lot sizes 3 times different than a house two blocks away or other influences like views or busy roads- taking the median is a better way to gage market value.
What is price per square foot?
Price per square foot is price of the home divided by square footage of the house. It does not take into consideration lot size, it is solely home size. To clarify, sometimes a guest house, basement, or pool house is included and sometimes it is not which affects price per square foot.
What is New Construction and Resale?
New construction means homes that are newly built and no one has lived in it prior. Resale means someone has lived in it prior. New car vs. used car.
Inventory
What’s for sale on the market.
Under Contract
There is a contingency that has not been removed and the buyer has the option to cancel.
Pending/Closing
All contingencies have been removed and ready to close.
What is a contingency?
A contingency are contractual terms negotiated at purchase that allow a Buyer or Seller the ability to cancel the Purchase Agreement.
What is Mid-Low and Mid-High Price?
Mid-Low is between the Actual Lowest Sold and the Median Price. Mid-high is between the Median and the Actual Highest Sold.

LeHoa’s Neighborhood Data Charts Los Angeles Real Estate LNDC DECEMBER 2022 For questions, comments, a tailor-made report for your home area, or a complimentary home valuation please contact LeHoa Gacki LeHoa Gacki Douglas Elliman Real Estate DRE #01422855 Lehoa.Gacki@elliman.com www.LeHoaGacki.com 424.276.7587 Bel-Air A neighborhood in the City of Los Angeles BEL-AIR Brentwood Encino Westwood Beverly Crest Beverly Hills Sherman Oaks Holmby Hills WHAT YOUR MONEY BUYS YOU THIS MONTH: Bel-Air Home Analysis from: December 01, 2022 to December 31, 2022 5 Sold Sold Price **Overbid/ Underbid Square Feet Price per/SqFt YB LotSqFt BD BA Days on Market Actual Lowest Sold $2,400,000 109 2,297 $1,045 1951 14,885 3 3 10 Mid-Low* $3,225,000 86 2,768 $935 1934 15,161 4 4 15 Typical Home Price (Median)* $4,125,000 92 4,399 $1,205 1951 17,433 4 5 43 Mid-High* $9,962,500 104 7,144 $1,412 1979 37,997 5 7 158 Actual Highest Sold $14,625,000 81 9,292 $1,574 1934 45,976 5 8 193 Average $6,100,000 94 4,844 $1,180 1955 24,750 4 5 78 **Overbid/Underbid: 100 is list price paid. Under 100 means sold for less than asking, over 100 sold probably in multiples and over asking. Note: Square Footage calculation could be more or less (+-) 20% difference. (Based on calculation.) * Middle Range Variance $6,737,500 Middle Range Variance is future range Typical Home Price (Median) Price will vary by. Never more, Never less. Source: TheMLS/CLAW (Combined Los Angeles Westside) Single Family Homes December 2022 $4,125,000 TYPICAL HOME PRICE (MEDIAN) $1,205 SOLD PRICE PER SQUARE FOOT 43 DAYS ON MARKET BEFORE SOLD (DOM) $3,225,000 MID-LOW $9,962,500 MID-HIGH NEIGHBORING AREAS: Area Typical Home Price (Median) Price per/SqFt Days on Market Mid-Low Mid-High Brentwood $4,449,512 $1,383 18 $2,550,000 $8,525,000 Encino $1,993,750 $718 20 $1,420,000 $3,200,000 Sherman Oaks $1,839,500 $796 29 $1,294,000 $2,721,250 Beverly Crest $2,725,000 $1,016 60 $2,200,000 $4,787,500 Beverly Hills $5,343,500 $1,557 54 $3,483,750 $8,250,000 Westwood $2,225,000 $1,136 22 $2,000,000 $2,431,550 Holmby Hills $49,500,000 $2,616 65
Buyer or Seller Advantage by Price Point for Bel-Air as of December 31, 2022
4-6 = BALANCED MARKET
Based on last 3 months of homes sales, Bel-Air has 8.0 months supply of inventory.
HOME PRICE RANGE
BUYER ADVANTAGE $100,000,000 $200,000,000 $80,000,000 $99,999,999 $60,000,000 $79,999,999
BUYER ADVANTAGE $50,000,000 $59,999,999
BUYER ADVANTAGE $40,000,000 $49,999,999
BUYER ADVANTAGE $35,000,000 $39,999,999 $30,000,000 $34,999,999
BUYER ADVANTAGE $25,000,000 $29,999,999
BUYER ADVANTAGE $20,000,000 $24,999,999
BUYER ADVANTAGE $15,000,000 $19,999,999 $12,500,000 $14,999,999 $10,000,000 $12,499,999
BUYER ADVANTAGE $9,000,000 $9,999,999
BUYER ADVANTAGE $8,000,000 $8,999,999
BUYER ADVANTAGE $7,000,000 $7,999,999 $6,500,000 $6,999,999
BUYER ADVANTAGE $6,000,000 $6,499,999
BUYER ADVANTAGE $5,500,000 $5,999,999 $5,000,000 $5,499,999 $4,500,000 $4,999,999
$4,000,000 $4,499,999
$3,500,000 $3,999,999
SELLER ADVANTAGE
SELLER
ADVANTAGE
SELLER ADVANTAGE
SELLER ADVANTAGE
BUYER ADVANTAGE
$3,000,000 $3,499,999 $2,500,000 $2,999,999
$2,000,000 $2,499,999
BUYER ADVANTAGE $1,000,000 $1,499,999 $500,000 $999,999
SELLER ADVANTAGE
SELLER ADVANTAGE $1,500,000 $1,999,999
3 and under FAVORS SELLER 7 and over FAVORS BUYER Months supply of Inventory =
Bel-Air Inventory for New Construction and Resale of Homes as of
For Sale
Source: TheMLS/CLAW (Combined Los Angeles Westside)
Under Contract Pending - Closing Soon
New Construction New Con DOM Resale Resale DOM Home Price Range Homes Resold
2 5 5 102 51 105 5
$500,000 $999,999 2 27 $1,000,000 $1,499,999 1 $1,500,000 $1,999,999 1 2 118 $2,000,000 $2,499,999 1 3 76 $2,500,000 $2,999,999 3 79 $3,000,000 $3,499,999 1 $3,500,000 $3,999,999 2 2 65 $4,000,000 $4,499,999 1 1 1 41 $4,500,000 $4,999,999 1 3 58 $5,000,000 $5,499,999 1 109 $5,500,000 $5,999,999 1 126 $6,000,000 $6,499,999 1 1 1 33 $6,500,000 $6,999,999 1 35 $7,000,000 $7,999,999 2 59 $8,000,000 $8,999,999 3 236 $9,000,000 $9,999,999 3 125 $10,000,000 $12,499,999 1 42 3 140 $12,500,000 $14,999,999 3 72 7 45 $15,000,000 $19,999,999 1 2 312 $20,000,000 $24,999,999 1 189 $25,000,000 $29,999,999 $30,000,000 $34,999,999 5 102 $35,000,000 $39,999,999 1 252 $40,000,000 $49,999,999 3 161 $50,000,000 $59,999,999 $60,000,000 $79,999,999 $80,000,000 $99,999,999 2 117 $100,000,000 $200,000,000
SELLER ADVANTAGE SUPPLY & DEMAND
REALTORS
of December 31, 2022
DEMAND BUYER / INVESTOR ADVANTAGE
DOM New Cons New DOM Homes Resold Resold DOM New Cons New DOM Homes
DOM New Cons New DOM 22 1 109 10 84 5 78 56 1 39 10 3 70 1 10 2 78 1 16 7 2 32 36 1 108 1 122 1 109 1 147 1 168 1 193 2 REALTORS DIGEST
Based on last 3 months of homes sales, Bel-Air has 7.9 months supply of inventory. Sold Homes Days on Market Before Sold = DOM October November December Resold
Resold Resold
$$1,000,000 $2,000,000 $3,000,000 $4,000,000 $5,000,000 $6,000,000 $7,000,000 $8,000,000 $9,000,000 $10,000,000
$8,637,500 BEL-AIR
OBSERVATION

OWN
ARCHITECT
Jan 01, 2019 to Dec 31, 2019 Jan 01, 2020 to Dec 31, 2020 Jan 01, 2021 to Dec 31, 2021 Jan 01, 2022 to Dec 31, 2022 Mid-Low Typical Home Price-Median Mid-High 4 YEAR TREND For questions, comments, a tailor-made report for your home area, or a complimentary home valuation please contact LeHoa Gacki LeHoa Gacki, DRE #01422855 Douglas Elliman Real Estate 11990 San Vicente Blvd., #100, L.A., Ca 90049 Email: Lehoa.Gacki@elliman.com Tel | Fax: (424) 276-7587 www.Lehoagacki.com | Lehoagacki.elliman.com 4 YEAR OBSERVATION Bel-Air Number of Homes Sold: 121 111 140 104 Jan 01, 2019 to Dec 31, 2019 Jan 01, 2020 to Dec 31, 2020 Jan 01, 2021 to Dec 31, 2021 Jan 01, 2022 to Dec 31, 2022 Actual Lowest Sold $655,000 $660,000 $999,000 $552,000 Mid-Low $2,000,000 $2,255,000 $2,635,500 $2,812,500 Typical Home Price-Median $3,000,000 $2,900,000 $3,625,000 $4,610,000 Mid-High $6,370,000 $5,770,000 $5,837,500 $8,637,500 Actual Highest Sold $150,000,000 $43,300,000 $36,000,000 $141,000,000 Average Price Sold $7,848,256 $5,717,432 $5,317,529 $9,435,309 12 MONTH
$2,000,000 $2,255,000 $2,635,500 $2,812,500 Bel-Air Cumulative 12 months sold home analysis from: January 01, 2022 to December 31, 2022 104 Sold Sold Price **Overbid / Underbid Square Feet Price per/SqFt YB LotSqFt BD BA Days on Market Actual Lowest Sold $552,000 79 1,087 $508 1937 8,549 2 1 9 Mid-Low* $2,812,500 92 2,743 $926 1949 12,818 4 3 15 Typical Home Price-Median* $4,610,000 97 3,842 $1,130 1960 20,867 4 5 36 Mid-High* $8,637,500 101 6,534 $1,383 1971 35,876 6 7 94 Actual Highest Sold $141,000,000 48 105,000 $1,343 2019 166,828 21 49 79 Average $9,435,309 96 6,063 $1,305 1965 28,489 5 6 65 **Overbid / Underbid: 100 is list price paid. Under 100 means sold for less than asking, over 100 sold probably in multiples and over asking. Note: Square Footage calculation could be more or less (+-) 20% difference. (Based on calculation.) * Middle Range Variance $5,825,000 Middle Range Variance is future range Typical Home Price (Median) Price will vary by. Never more, Never less. Source: TheMLS/CLAW (Combined Los Angeles Westside) © 2022 LEHOA GACKI. DRE# 01422855. ALL WORLDWIDE RIGHTS RESERVED. DOUGLAS ELLIMAN REAL ESTATE. 150 EL CAMINO DRIVE, BEVERLY HILLS, CA 90212. 310.595.3888. ALL MATERIAL PRESENTED HEREIN IS INTENDED FOR INFORMATION PURPOSES ONLY AND NOT INTENDED TO CONSTITUTE PROFESSIONAL ADVICE OR WARRANTY OUTSIDE THE REALM OF REAL ESTATE BROKERAGE. MAPS CREATED FOR REFERENCE PURPOSE ONLY. WHILE THIS INFORMATION IS BELIEVED TO BE CORRECT, IT IS REPRESENTED SUBJECT TO ERRORS, OMISSIONS, CHANGES OR WITHDRAWAL WITHOUT NOTICE. BASED ON DATA SOURCED FROM THE COMBINED LOS ANGELES WESTSIDE MULTIPLE LISTING SERVICE AND PUBLIC RECORDS. STATISTICS ARE SUBJECT TO CHANGE DUE TO INDIVIDUAL REAL ESTATE COMPANY REPORTING DISCIPLINES. BUYER ADVANTAGE OR SELLER ADVANTAGE IS STRICTLY OF THE OPINION OF LEHOA GACKI AND ACCURACY CANNOT BE GUARANTEED AND MAY NOT REFLECT ALL REAL ESTATE ACTIVITY ON THE MARKET. ALL PROPERTY INFORMATION, INCLUDING, BUT NOT LIMITED TO MAPS, GRAPHS, DEPICTIONS, SQUARE FOOTAGE, ROOM COUNT, NUMBER OF BEDROOMS AND THE SCHOOL DISTRICT IN PROPERTY LISTINGS SHOULD BE VERIFIED BY YOUR
$3,000,000 $2,900,000 $3,625,000 $4,610,000 ATTORNEY,
$6,370,000 $5,770,000 $5,837,500 OR ZONING EXPERT. NEW CONSTRUCTION COUNT, SQUARE FOOTAGE AND YEAR BUILT IS BASED ON INDIVIDUAL REAL ESTATE COMPANY REPORTING AND MAY BE DIFFERENT THAN PUBLIC RECORDS. NEW CONSTRUCTION COUNT IS BASED ON LISTING BROKERAGE LISTING YEAR. THE BROKER/AGENT PROVIDING THE INFORMATION CONTAINED HEREIN MAY OR MAY HAVE NOT BEEN THE LISTING AND/OR SELLING AGENT. THIS IS NOT INTENDED TO SOLICIT PROPERTY ALREADY LISTED. EQUAL HOUSING OPPORTUNITY. NEIGHBORHOOD BOUNDARY SOURCE: PUBLIC RECORDS, COMBINED LOS ANGELES WESTSIDE MULTIPLE LISTING SERVICE AND LOS ANGELES TIMES MAPPING L.A. https://maps.latimes.com/neighborhoods/index.html
51 53 57 29
26
10 20 30 40 50 60 70 Jan 01 to Jun 30, 2019 Jul 01 to Dec 31, 2019 Jan 01 to Jun 30, 2020 Jul
to Dec
54 67 34 77 68 72 55 49 Days
END OF BEL-AIR 6 PAGE REPORT
$827 $839 $808 $961 $946 $1,091 $1,202 $1,062 $969 $1,042 $988 $1,037 $1,053 $1,120 $1,396 $1,204 $$200 $400 $600 $800 $1,000 $1,200 $1,400 $1,600 Jan 01 to Jun 30, 2019 Jul 01 to Dec 31, 2019 Jan 01 to Jun 30, 2020 Jul 01 to Dec 31, 2020 Jan 01 to Jun 30, 2021 Jul 01 to Dec 31, 2021 Jan 01 to Jun 30, 2022 Jul 01 to Dec 31, 2022 Median Price Per Square Foot Average Price per SquareFt
65
35 36
01
31, 2020 Jan 01 to Jun 30, 2021 Jul 01 to Dec 31, 2021 Jan 01 to Jun 30, 2022 Jul 01 to Dec 31, 2022 Number of Homes Sold
on Market before Sold
SOLD HOME PRICE PER SQUARE FOOT - PRE & POST MAR 2020 PANDEMIC BEL-AIR DAYS ON MARKET BEFORE SOLD- PRE & POST MAR 2020 PANDEMIC BEL-AIR
WHAT YOUR MONEY BUYS YOU THIS MONTH: Beverly Crest Home Analysis from: December 01, 2022 to December 31, 2022 11 Sold Sold Price **Overbid/ Underbid Square Feet Price per/SqFt YB LotSqFt BD BA Days on Market Actual Lowest Sold $1,625,000 94 2,720 $597 1935 12,884 4 4 82 Mid-Low* $2,200,000 92 2,500 $803 1954 12,884 4 3 20 Typical Home Price (Median)* $2,725,000 96 2,720 $1,016 1966 15,717 4 4 60 Mid-High* $4,787,500 98 5,418 $1,090 1999 18,715 5 5 87 Actual Highest Sold $18,200,000 91 9,887 $1,840 2022 17,430 5 9 59 Average $4,848,636 94 4,287 $1,050 1972 23,733 4 5 61 **Overbid/Underbid: 100 is list price paid. Under 100 means sold for less than asking, over 100 sold probably in multiples and over asking. Note: Square Footage calculation could be more or less (+-) 20% difference. (Based on calculation.) * Middle Range Variance $2,587,500 Middle Range Variance is future range Typical Home Price (Median) Price will vary by. Never more, Never less. Source: TheMLS/CLAW (Combined Los Angeles Westside) Single Family Homes December 2022 $2,725,000 TYPICAL HOME PRICE (MEDIAN) $1,016 SOLD PRICE PER SQUARE FOOT 60 DAYS ON MARKET BEFORE SOLD (DOM) $2,200,000 MID-LOW $4,787,500 MID-HIGH NEIGHBORING AREAS: Area Typical Home Price (Median) Price per/SqFt Days on Market Mid-Low Mid-High Bel-Air $4,125,000 $1,205 43 $3,225,000 $9,962,500 Sherman Oaks $1,839,500 $796 29 $1,294,000 $2,721,250 Studio City $1,681,000 $945 10 $1,422,500 $2,916,250 Hollywood Hills West $2,550,000 $873 59 $2,051,000 $3,740,000 Beverly Hills $5,343,500 $1,557 54 $3,483,750 $8,250,000 Westwood $2,225,000 $1,136 22 $2,000,000 $2,431,550 Holmby Hills $49,500,000 $2,616 65 For questions, comments, a tailor-made report for your home area, or a complimentary home valuation please contact LeHoa Gacki LeHoa Gacki Douglas Elliman Real Estate DRE #01422855 Lehoa.Gacki@elliman.com www.LeHoaGacki.com 424.276.7587 LeHoa’s Neighborhood Data Charts Los Angeles Real Estate L.N.D.C. DECEMBER 2022 Beverly Crest A neighborhood in the City of Los Angeles BEVERLY CREST Bel Air Westwood Beverly Hills Sherman Oaks Studio City Hollywood Hills West Holmby Hills
Buyer or Seller Advantage by Price Point for Beverly Crest as of December 31, 2022
Based on last 3 months of homes sales, Beverly Crest has 6.2 months supply of inventory.
HOME PRICE RANGE
$100,000,000 $200,000,000
BUYER ADVANTAGE $80,000,000 $99,999,999
BUYER ADVANTAGE $60,000,000 $79,999,999
BUYER ADVANTAGE $50,000,000 $59,999,999 $40,000,000 $49,999,999 SELLER ADVANTAGE
BUYER ADVANTAGE $35,000,000 $39,999,999
BUYER ADVANTAGE $30,000,000 $34,999,999
BUYER ADVANTAGE $25,000,000 $29,999,999
BUYER ADVANTAGE $20,000,000 $24,999,999
BUYER ADVANTAGE $15,000,000 $19,999,999
BUYER ADVANTAGE $12,500,000 $14,999,999 $10,000,000 $12,499,999 $9,000,000 $9,999,999
BUYER ADVANTAGE $8,000,000 $8,999,999
BUYER ADVANTAGE $7,000,000 $7,999,999
BUYER ADVANTAGE $6,500,000 $6,999,999
BUYER ADVANTAGE $6,000,000 $6,499,999 $5,500,000 $5,999,999
SELLER ADVANTAGE
SELLER ADVANTAGE $5,000,000 $5,499,999
BUYER ADVANTAGE $4,500,000 $4,999,999 $4,000,000 $4,499,999
$3,500,000 $3,999,999 $3,000,000 $3,499,999
SELLER ADVANTAGE
SELLER ADVANTAGE
SELLER ADVANTAGE $2,500,000 $2,999,999
SELLER ADVANTAGE
SELLER ADVANTAGE $1,500,000 $1,999,999
$2,000,000 $2,499,999
SELLER ADVANTAGE $1,000,000 $1,499,999
SELLER ADVANTAGE $500,000 $999,999
4-6 = BALANCED MARKET 3 and under FAVORS SELLER 7 and over FAVORS BUYER Months supply of Inventory =
Beverly Crest Inventory for New Construction and Resale of Homes
For Sale
Source: TheMLS/CLAW (Combined Los Angeles Westside)
Under
8 5 6 162 60 135 12
$500,000 $999,999
1 1 2 150 $1,000,000 $1,499,999 3 1 1 31 $1,500,000 $1,999,999 1 1 3 162 $2,000,000 $2,499,999 3 3 78 $2,500,000 $2,999,999 3
1 3 151 $3,000,000 $3,499,999 2 3 117 $3,500,000 $3,999,999 2 81 $4,000,000 $4,499,999 1 1 54 $4,500,000 $4,999,999 1 2 68 $5,000,000 $5,499,999 1 1 1 227 $5,500,000 $5,999,999 1 3 91 $6,000,000 $6,499,999 5 100 $6,500,000 $6,999,999
1 164 2 118 $7,000,000 $7,999,999 1 2 220 $8,000,000 $8,999,999 $9,000,000 $9,999,999 1 3 204 $10,000,000 $12,499,999
1 207 3 150 $12,500,000 $14,999,999 3 178 3 89 $15,000,000 $19,999,999 5 174 $20,000,000 $24,999,999 6 110 $25,000,000 $29,999,999 1 208 $30,000,000 $34,999,999
1 67 1 146 $35,000,000 $39,999,999 1 $40,000,000 $49,999,999 1 126 $50,000,000 $59,999,999 2 144 $60,000,000 $79,999,999 2 289 $80,000,000 $99,999,999 $100,000,000 $200,000,000
SELLER ADVANTAGE SUPPLY & DEMAND
Contract Pending - Closing Soon New Construction New Con DOM Resale Resale DOM Home Price Range Homes Resold
REALTORS
Homes as of December 31, 2022
BUYER
Homes Days on Market Before Sold
DOM October November December Resold DOM New Cons New DOM Homes Resold Resold DOM New Cons New DOM Homes Resold Resold DOM New Cons New DOM 60 10 43 10 61 1 59 2 24 3 46 1 82 23 2 109 67 1 22 4 59 57 1 89 1 123 1 40 119 1 9 1 20 11 54 155 1 1 18 1 59 REALTORS DIGEST
DEMAND
/ INVESTOR ADVANTAGE Based on last 3 months of homes sales, Bel-Air has 7.9 months supply of inventory. Sold
=
BEVERLY CREST
$1,000,000 $2,000,000 $3,000,000 $4,000,000 $5,000,000 $6,000,000 4 YEAR TREND For questions, comments, a tailor-made report for your home area, or a complimentary home valuation please contact LeHoa Gacki LeHoa Gacki, DRE #01422855 Douglas Elliman Real Estate 11990 San Vicente Blvd., #100, L.A., Ca 90049
$5,012,222 Mid-Low Typical Home Price-Median Mid-High
Email: Lehoa.Gacki@elliman.com Tel | Fax: (424) 276-7587 www.Lehoagacki.com | Lehoagacki.elliman.com
4 YEAR OBSERVATION Beverly Crest Number of Homes Sold: 183 196 267 186 Jan 01, 2019 to Dec 31, 2019 Jan 01, 2020 to Dec 31, 2020 Jan 01, 2021 to Dec 31, 2021 Jan 01, 2022 to Dec 31, 2022 Actual Lowest Sold $681,000 $500,000 $500,000 $708,700 Mid-Low $1,462,000 $1,577,500 $1,786,000 $2,200,000 Typical Home Price-Median $2,235,000 $2,200,000 $2,705,000 $3,162,500 Mid-High $3,250,000 $3,736,250 $4,100,000 $5,012,222 Actual Highest Sold $42,750,000 $37,000,000 $64,900,000 $58,000,000 Average Price Sold $3,178,808 $3,974,613 $4,247,996 $5,118,403 12 MONTH OBSERVATION Beverly Crest Cumulative 12 months sold home analysis from: January 01, 2022 to December 31, 2022 186 Sold Sold Price **Overbid / Underbid Square Feet Price per/SqFt YB LotSqFt BD BA Days on Market Actual Lowest Sold $708,700 98 1,266 $560 1918 8,167 2 2 82 Mid-Low* $2,200,000 92 2,395 $807 1953 9,067 3 3 10 Typical Home Price-Median* $3,162,500 97 2,929 $1,012 1962 14,620 4 4 30 Mid-High* $5,012,222 100 4,362 $1,270 1978 27,017 5 6 74 Actual Highest Sold $58,000,000 73 - $0 1994 151,240 8 12 127 Average $5,118,403 97 3,819 $1,124 1968 59,823 4 5 51 **Overbid / Underbid: 100 is list price paid. Under 100 means sold for less than asking, over 100 sold probably in multiples and over asking. Note: Square Footage calculation could be more or less (+-) 20% difference. (Based on calculation.) * Middle Range Variance $2,812,222 Middle Range Variance is future range Typical Home Price (Median) Price will vary by. Never more, Never less. Source: TheMLS/CLAW (Combined Los Angeles Westside) © 2022 LEHOA GACKI. DRE# 01422855. ALL WORLDWIDE RIGHTS RESERVED. DOUGLAS ELLIMAN REAL ESTATE. 150 EL CAMINO DRIVE, BEVERLY HILLS, CA 90212. 310.595.3888. ALL MATERIAL PRESENTED HEREIN IS INTENDED FOR INFORMATION PURPOSES ONLY AND NOT INTENDED TO CONSTITUTE PROFESSIONAL ADVICE OR WARRANTY OUTSIDE THE REALM OF REAL ESTATE BROKERAGE. MAPS CREATED FOR REFERENCE PURPOSE ONLY. WHILE THIS INFORMATION IS BELIEVED TO BE CORRECT, IT IS REPRESENTED SUBJECT TO ERRORS, OMISSIONS, CHANGES OR WITHDRAWAL WITHOUT NOTICE. BASED ON DATA SOURCED FROM THE COMBINED LOS ANGELES WESTSIDE MULTIPLE LISTING SERVICE AND PUBLIC RECORDS. STATISTICS ARE SUBJECT TO CHANGE DUE TO INDIVIDUAL REAL ESTATE COMPANY REPORTING DISCIPLINES. BUYER ADVANTAGE OR SELLER ADVANTAGE IS STRICTLY OF THE OPINION OF LEHOA GACKI AND ACCURACY CANNOT BE GUARANTEED AND MAY NOT REFLECT ALL REAL ESTATE ACTIVITY ON THE MARKET. ALL PROPERTY INFORMATION, INCLUDING, BUT NOT LIMITED TO MAPS, GRAPHS, DEPICTIONS, SQUARE FOOTAGE, ROOM COUNT, NUMBER OF BEDROOMS AND THE SCHOOL DISTRICT IN PROPERTY LISTINGS SHOULD BE VERIFIED BY YOUR OWN ATTORNEY, ARCHITECT OR ZONING EXPERT. NEW CONSTRUCTION COUNT, SQUARE FOOTAGE AND YEAR BUILT IS BASED ON INDIVIDUAL REAL ESTATE COMPANY REPORTING AND MAY BE DIFFERENT THAN PUBLIC RECORDS. NEW CONSTRUCTION COUNT IS BASED ON LISTING BROKERAGE LISTING YEAR. THE BROKER/AGENT PROVIDING THE INFORMATION CONTAINED HEREIN MAY OR MAY HAVE NOT BEEN THE LISTING AND/OR SELLING AGENT. THIS IS NOT INTENDED TO SOLICIT PROPERTY ALREADY LISTED. EQUAL HOUSING OPPORTUNITY. NEIGHBORHOOD BOUNDARY SOURCE: PUBLIC RECORDS, COMBINED LOS ANGELES WESTSIDE MULTIPLE LISTING SERVICE AND LOS ANGELES TIMES MAPPING L.A. https://maps.latimes.com/neighborhoods/index.html
$1,462,000 $1,577,500 $1,786,000 $2,200,000 $-
$2,235,000 $2,200,000 $2,705,000 $3,162,500 $3,250,000 $3,736,250 $4,100,000 Jan 01, 2019 to Dec 31, 2019 Jan 01, 2020 to Dec 31, 2020 Jan 01, 2021 to Dec 31, 2021 Jan 01, 2022 to Dec 31, 2022
53 62 48 40 34 24 29 3510 20 30 40 50 60 70 Jan 01 to Jun 30, 2019 Jul 01 to Dec 31, 2019 Jan 01 to Jun 30, 2020 Jul 01 to Dec 31, 2020 Jan
to Jun
Jul
Dec
Jun
Jul
Number
Sold 82 101 68 128 148 119 115 71 Days
END OF BEVERLY CREST 6 PAGE REPORT
DAYS
SOLD-
$814 $788 $823 $772 $909 $973 $1,046 $968 $843 $815 $903 $873 $979 $1,806 $1,153 $1,078 $$200 $400 $600 $800 $1,000 $1,200 $1,400 $1,600 $1,800 $2,000 Jan 01 to Jun 30, 2019 Jul 01 to Dec 31, 2019 Jan 01 to Jun 30, 2020 Jul 01 to Dec 31, 2020 Jan 01 to Jun 30, 2021 Jul 01 to Dec 31, 2021 Jan 01 to Jun 30, 2022 Jul 01 to Dec 31, 2022 Median Price Per Square Foot Average Price per SquareFt
01
30, 2021
01 to
31, 2021 Jan 01 to
30, 2022
01 to Dec 31, 2022
of Homes
on Market before Sold
SOLD HOME PRICE PER SQUARE FOOT - PRE & POST MAR 2020 PANDEMIC BEVERLY CREST
ON MARKET BEFORE
PRE & POST MAR 2020 PANDEMIC BEVERLY CREST
WHAT YOUR MONEY BUYS YOU THIS MONTH: Beverly Hills Home Analysis from: December 01, 2022 to December 31, 2022 10 Sold Sold Price **Overbid/ Underbid Square Feet Price per/SqFt YB LotSqFt BD BA Days on Market Actual Lowest Sold $2,180,000 95 1,230 $1,772 1926 6,502 2 1 11 Mid-Low* $3,483,750 90 1,883 $1,325 1926 7,251 3 3 17 Typical Home Price (Median)* $5,343,500 95 3,748 $1,557 1953 14,408 5 4 54 Mid-High* $8,250,000 99 4,845 $1,787 1964 34,362 5 6 81 Actual Highest Sold $13,000,000 84 7,100 $1,831 2008 36,289 6 8 58 Average $6,121,700 94 3,997 $1,595 1951 20,425 4 4 81 **Overbid/Underbid: 100 is list price paid. Under 100 means sold for less than asking, over 100 sold probably in multiples and over asking. Note: Square Footage calculation could be more or less (+-) 20% difference. (Based on calculation.) * Middle Range Variance $4,766,250 Middle Range Variance is future range Typical Home Price (Median) Price will vary by. Never more, Never less. Source: TheMLS/CLAW (Combined Los Angeles Westside) Single Family Homes December 2022 $5,343,500 TYPICAL HOME PRICE (MEDIAN) $1,557 SOLD PRICE PER SQUARE FOOT 54 DAYS ON MARKET BEFORE SOLD (DOM) $3,483,750 MID-LOW $8,250,000 MID-HIGH Beverly Crest Hollywood Hills West West Hollywood Pico-Robertson Beverly Grove WestWood Century City BEVERLY HILLS Carthay For questions, comments, a tailor-made report for your home area, or a complimentary home valuation please contact LeHoa Gacki LeHoa Gacki Douglas Elliman Real Estate DRE #01422855 Lehoa.Gacki@elliman.com www.LeHoaGacki.com 424.276.7587 LeHoa’s Neighborhood Data Charts Los Angeles Real Estate L.N.D.C. DECEMBER 2022 Beverly Hills A City in Los Angeles County Bel-Air Holmby Hills NEIGHBORING AREAS: Area Typical Home Price( Median) Price per/SqFt Days on Market Mid-Low Mid-High Westwood $2,225,000 $1,136 22 $2,000,000 $2,431,550 Bel-Air $4,125,000 $1,205 43 $3,225,000 $9,962,500 Beverly Crest $2,725,000 $1,016 60 $2,200,000 $4,787,500 Hollywood Hills West $2,550,000 $873 59 $2,051,000
West Hollywood
16 $2,043,500
Beverly Grove $2,099,000 $1,316 24
Carthay
11
18
$3,740,000
$2,362,500 $1,254
$2,968,329
$2,025,000 $3,100,000
$2,425,500 $1,015
$2,267,320 $2,676,250 Pico-Robertson $2,512,500 $1,004
$1,575,000 $3,637,500
Buyer or Seller Advantage by Price Point for Beverly Hills as of December 31, 2022
Based on last 3 months of homes sales, Beverly Hills has 4.5 months supply of inventory.
HOME PRICE RANGE
BUYER ADVANTAGE $100,000,000 $200,000,000 $80,000,000 $99,999,999
BUYER ADVANTAGE $60,000,000 $79,999,999 $50,000,000 $59,999,999 SELLER ADVANTAGE $40,000,000 $49,999,999 $35,000,000 $39,999,999
BUYER ADVANTAGE $30,000,000 $34,999,999
BUYER ADVANTAGE $25,000,000 $29,999,999
BUYER ADVANTAGE $20,000,000 $24,999,999
BUYER ADVANTAGE $15,000,000 $19,999,999
BUYER ADVANTAGE $12,500,000 $14,999,999 $10,000,000 $12,499,999 SELLER ADVANTAGE $9,000,000 $9,999,999 SELLER ADVANTAGE $8,000,000 $8,999,999 $7,000,000 $7,999,999 SELLER ADVANTAGE
BUYER ADVANTAGE $6,500,000 $6,999,999
BUYER ADVANTAGE $6,000,000 $6,499,999 $5,500,000 $5,999,999
SELLER ADVANTAGE
$5,000,000 $5,499,999 SELLER ADVANTAGE $4,500,000 $4,999,999 SELLER ADVANTAGE $4,000,000 $4,499,999
SELLER ADVANTAGE
SELLER ADVANTAGE $3,000,000 $3,499,999 SELLER ADVANTAGE $2,500,000 $2,999,999 SELLER ADVANTAGE $2,000,000 $2,499,999
$3,500,000 $3,999,999
SELLER ADVANTAGE $1,500,000 $1,999,999 SELLER ADVANTAGE $1,000,000 $1,499,999 $500,000 $999,999
4-6 = BALANCED MARKET 3 and under FAVORS SELLER 7 and over FAVORS BUYER Months supply of Inventory =
Beverly Hills Inventory for New Construction and Resale of Homes
For Sale
Source: TheMLS/CLAW (Combined Los Angeles Westside)
Under Contract Pending - Closing Soon
New Construction New Con DOM Resale Resale DOM Home Price Range Homes Resold
5 3 3 75 53 110 13
$500,000 $999,999 $1,000,000 $1,499,999 1 79 $1,500,000 $1,999,999 1
1 1 131 $2,000,000 $2,499,999 1 1 2 96 $2,500,000 $2,999,999 1 2 131 $3,000,000 $3,499,999 1 2 123 $3,500,000 $3,999,999 $4,000,000 $4,499,999 1 82 $4,500,000 $4,999,999 1 1 199 $5,000,000 $5,499,999 $5,500,000 $5,999,999 2 126 $6,000,000 $6,499,999 2 135 $6,500,000 $6,999,999 1 1 21 $7,000,000 $7,999,999 2 1 6 97 $8,000,000 $8,999,999 2 2 3 83 $9,000,000 $9,999,999 1 1 3 101 $10,000,000 $12,499,999 5 55 $12,500,000 $14,999,999 1 81 9 124 $15,000,000 $19,999,999 2 4 112 $20,000,000 $24,999,999 5 96 $25,000,000 $29,999,999 1 1 63 $30,000,000 $34,999,999 2 72 $35,000,000 $39,999,999 1 $40,000,000 $49,999,999 $50,000,000 $59,999,999 1 101 $60,000,000 $79,999,999 $80,000,000 $99,999,999 1 454 $100,000,000 $200,000,000
SELLER ADVANTAGE SUPPLY & DEMAND
REALTORS
Homes as of December 31, 2022
BUYER
November December
DOM New Cons New DOM Homes Resold Resold DOM New Cons New
DOM New Cons New DOM
13
47
11 1 57 33 2
2
1
1
27 107 1
REALTORS DIGEST
DEMAND
/ INVESTOR ADVANTAGE Based on last 3 months of homes sales, Bel-Air has 7.9 months supply of inventory. Sold Homes Days on Market Before Sold = DOM October
Resold
DOM Homes Resold Resold
49
126 1 95 10 81 86 21 1 11
1 84 40 1 226 1 19 2 205 1 11 1 28 1 52 1 25 2 87 66 1 58
98
90 1 49 1 95 1 58 64
119
423
270
$10,285,000 $11,600,000 $12,400,000
$6,200,000 $6,487,500 $7,300,000 $7,495,000
$10,028,849
$-
$4,000,000
Jan 01, 2019 to Dec 31, 2019 Jan 01, 2020 to Dec 31, 2020 Jan 01, 2021 to Dec 31, 2021 Jan 01, 2022 to Dec 31, 2022 Mid-Low Typical Home Price-Median Mid-High 4 YEAR TREND For questions, comments, a tailor-made report for your home area, or a complimentary home valuation please contact LeHoa Gacki LeHoa Gacki, DRE #01422855 Douglas Elliman Real Estate 11990 San Vicente Blvd., #100, L.A., Ca 90049 Email: Lehoa.Gacki@elliman.com Tel | Fax: (424) 276-7587 www.Lehoagacki.com | Lehoagacki.elliman.com 4 YEAR OBSERVATION Beverly Hills Number of Homes Sold: 134 122 219 147 Jan 01, 2019 to Dec 31, 2019 Jan 01, 2020 to Dec 31, 2020 Jan 01, 2021 to Dec 31, 2021 Jan 01, 2022 to Dec 31, 2022 Actual Lowest Sold $1,650,000 $1,020,000 $1,400,000 $1,825,000 Mid-Low $3,200,496 $3,000,000 $3,500,000 $3,600,000 Typical Home Price-Median $6,200,000 $6,487,500 $7,300,000 $7,495,000 Mid-High $10,028,849 $10,285,000 $11,600,000 $12,400,000 Actual Highest Sold $45,000,000 $68,000,000 $63,100,000 $51,000,000 Average Price Sold $8,132,279 $7,978,644 $8,968,696 $9,607,714 12 MONTH
Beverly Hills Cumulative 12 months sold home analysis from: January 01, 2022 to December 31, 2022 147 Sold Sold Price **Overbid / Underbid Square Feet Price per/SqFt YB LotSqFt BD BA Days on Market Actual Lowest Sold $1,825,000 80 2,060 $886 1927 6,573 4 3 86 Mid-Low* $3,600,000 93 2,355 $1,242 1926 6,502 4 4 11 Typical Home Price-Median* $7,495,000 96 3,894 $1,538 1938 13,496 5 5 27 Mid-High* $12,400,000 101 6,293 $2,014 1967 23,545 6 7 60 Actual Highest Sold $51,000,000 86 - $0 1963 125,580 7 10 270 Average $9,607,714 98 4,828 $1,739 1953 17,270 5 6 59 **Overbid / Underbid: 100 is list price paid. Under 100 means sold for less than asking, over 100 sold probably in multiples and over asking. Note: Square Footage calculation could be more or less (+-) 20% difference. (Based on calculation.) * Middle Range Variance $8,800,000 Middle Range Variance is future range Typical Home Price (Median) Price will vary by. Never more, Never less. Source: TheMLS/CLAW (Combined Los Angeles Westside) © 2022 LEHOA GACKI. DRE# 01422855. ALL WORLDWIDE RIGHTS RESERVED. DOUGLAS ELLIMAN REAL ESTATE. 150 EL CAMINO DRIVE, BEVERLY HILLS, CA 90212. 310.595.3888. ALL MATERIAL PRESENTED HEREIN IS INTENDED FOR INFORMATION PURPOSES ONLY AND NOT INTENDED TO CONSTITUTE PROFESSIONAL ADVICE OR WARRANTY OUTSIDE THE REALM OF REAL ESTATE BROKERAGE. MAPS CREATED FOR REFERENCE PURPOSE ONLY. WHILE THIS INFORMATION IS BELIEVED TO BE CORRECT, IT IS REPRESENTED SUBJECT TO ERRORS, OMISSIONS, CHANGES OR WITHDRAWAL WITHOUT NOTICE. BASED ON DATA SOURCED FROM THE COMBINED LOS ANGELES WESTSIDE MULTIPLE LISTING SERVICE AND PUBLIC RECORDS. STATISTICS ARE SUBJECT TO CHANGE DUE TO INDIVIDUAL REAL ESTATE COMPANY REPORTING DISCIPLINES. BUYER ADVANTAGE OR SELLER ADVANTAGE IS STRICTLY OF THE OPINION OF LEHOA GACKI AND ACCURACY CANNOT BE GUARANTEED AND MAY NOT REFLECT ALL REAL ESTATE ACTIVITY ON THE MARKET. ALL PROPERTY INFORMATION, INCLUDING, BUT NOT LIMITED TO MAPS, GRAPHS, DEPICTIONS, SQUARE FOOTAGE, ROOM COUNT, NUMBER OF BEDROOMS AND THE SCHOOL DISTRICT IN PROPERTY LISTINGS SHOULD BE VERIFIED BY YOUR OWN ATTORNEY, ARCHITECT OR ZONING EXPERT. NEW CONSTRUCTION COUNT, SQUARE FOOTAGE AND YEAR BUILT IS BASED ON INDIVIDUAL REAL ESTATE COMPANY REPORTING AND MAY BE DIFFERENT THAN PUBLIC RECORDS. NEW CONSTRUCTION COUNT IS BASED ON LISTING BROKERAGE LISTING YEAR. THE BROKER/AGENT PROVIDING THE INFORMATION CONTAINED
MAY OR MAY HAVE NOT BEEN THE
SOLICIT
$3,200,496 $3,000,000 $3,500,000 $3,600,000 BEVERLY HILLS
$2,000,000
$6,000,000 $8,000,000 $10,000,000 $12,000,000 $14,000,000
OBSERVATION
HEREIN
LISTING AND/OR SELLING AGENT. THIS IS NOT INTENDED TO
PROPERTY ALREADY LISTED. EQUAL HOUSING OPPORTUNITY. NEIGHBORHOOD BOUNDARY SOURCE: PUBLIC RECORDS, COMBINED LOS ANGELES WESTSIDE MULTIPLE LISTING SERVICE AND LOS ANGELES TIMES MAPPING L.A. https://maps.latimes.com/neighborhoods/index.html
54 66 57 38 48 32 21 4310 20 30 40 50 60 70 Jan 01 to Jun
Jul 01 to Dec
Jan
to Jun
Jul
Dec
63 71 63 59 108
79
6 PAGE REPORT
$1,321 $1,313 $1,275 $1,452 $1,385 $1,516 $1,668 $1,412 $1,478 $1,469 $1,495 $1,504 $1,551 $1,829 $1,831 $1,631 $$200 $400 $600 $800 $1,000 $1,200 $1,400 $1,600 $1,800 $2,000 Jan 01 to Jun 30, 2019 Jul 01 to Dec 31, 2019 Jan 01 to Jun 30, 2020 Jul 01 to Dec 31, 2020 Jan 01 to Jun 30, 2021 Jul 01 to Dec 31, 2021 Jan 01 to Jun 30, 2022 Jul 01 to Dec 31, 2022 Median Price Per Square Foot Average Price per SquareFt
30, 2019
31, 2019
01
30, 2020
01 to
31, 2020 Jan 01 to Jun 30, 2021 Jul 01 to Dec 31, 2021 Jan 01 to Jun 30, 2022 Jul 01 to Dec 31, 2022 Number of Homes Sold
111
68 Days on Market before Sold END OF BEVERLY HILLS
SOLD HOME PRICE PER SQUARE FOOT - PRE & POST MAR 2020 PANDEMIC BEVERLY HILLS DAYS ON MARKET BEFORE SOLD- PRE & POST MAR 2020 PANDEMIC BEVERLY HILLS
WHAT YOUR MONEY BUYS YOU THIS MONTH: Beverlywood Home Analysis from: December 01, 2022 to December 31, 2022 2 Sold Sold Price **Overbid/ Underbid Square Feet Price per/SqFt YB LotSqFt BD BA Days on Market Actual Lowest Sold $1,950,000 93 2,224 $877 1950 7,638 3 2 82 Typical Home Price (Median)* $2,725,000 91 2,590 $1,030 1949 8,449 4 3 47 Actual Highest Sold $3,500,000 90 2,956 $1,184 1948 9,260 4 3 12 Average $3,363,333 100 3,270 $1,028 1974 7,119 4 4 26 **Overbid/Underbid: 100 is list price paid. Under 100 means sold for less than asking, over 100 sold probably in multiples and over asking. Note: Square Footage calculation could be more or less (+-) 20% difference. (Based on calculation.) Source: TheMLS/CLAW (Combined Los Angeles Westside) Single Family Homes December 2022 $2,725,000 TYPICAL HOME PRICE (MEDIAN) $1,030 SOLD PRICE PER SQUARE FOOT 47 DAYS ON MARKET BEFORE SOLD (DOM) NEIGHBORING AREAS: Area Typical Home Price (Median) Price per/SqFt Days on Market Mid-Low Mid-High Cheviot Hills $3,235,000 $1,048 8 $2,535,000 $4,787,500 Century City $2,781,750 $2,170 12 $1,948,125 $4,168,103 Pico-Robertson $2,512,500 $1,004 18 $1,575,000 $3,637,500 Mid-City $1,326,000 $808 20 $1,096,250 $1,629,625 Palms $1,515,000 $951 52 $1,175,000 $2,195,000 BEVERLYWOOD Pico-Robertson Mid-City Century City Cheviot Hills Palms For questions, comments, a tailor-made report for your home area, or a complimentary home valuation please contact LeHoa Gacki LeHoa Gacki Douglas Elliman Real Estate DRE #01422855 Lehoa.Gacki@elliman.com www.LeHoaGacki.com 424.276.7587 LeHoa’s Neighborhood Data Charts Los Angeles Real Estate L.N.D.C. DECEMBER 2022 Beverlywood A neighborhood in the City of Los Angeles
Buyer or Seller Advantage by Price Point for Beverlywood as of December 31, 2022
Months supply of Inventory =
4-6 = BALANCED MARKET
Based on last 3 months of homes sales, Beverlywood has 3.5 months supply of inventory.
HOME PRICE RANGE
$15,000,000 $20,000,000 $11,000,000 $14,999,999 $7,000,000 $10,999,999 $6,750,000 $6,999,999 $6,500,000 $6,749,999 $6,250,000 $6,499,999 $6,000,000 $6,249,999 $5,750,000 $5,999,999
BUYER ADVANTAGE $5,500,000 $5,749,999
BUYER ADVANTAGE $5,250,000 $5,499,999
BUYER ADVANTAGE $5,000,000 $5,249,999 $4,750,000 $4,999,999
BUYER ADVANTAGE $4,500,000 $4,749,999 $4,250,000 $4,499,999 $4,000,000 $4,249,999
$3,750,000 $3,999,999
$3,500,000 $3,749,999
$3,250,000 $3,499,999 $3,000,000 $3,249,999
SELLER
SELLER
SELLER
3 and under FAVORS SELLER 7 and over FAVORS BUYER
ADVANTAGE
ADVANTAGE
ADVANTAGE
SELLER ADVANTAGE
BUYER ADVANTAGE
$2,750,000 $2,999,999
BUYER ADVANTAGE $2,500,000 $2,749,999 $2,250,000 $2,499,999 $2,000,000 $2,249,999 $1,750,000 $1,999,999
$1,500,000 $1,749,999
$1,250,000 $1,499,999 $1,000,000 $1,249,999 $500,000 $999,999
SELLER ADVANTAGE
SELLER ADVANTAGE
Beverlywood Inventory for New Construction and Resale of Homes
SELLER ADVANTAGE SUPPLY & DEMAND
For Sale
Source: TheMLS/CLAW (Combined Los Angeles Westside)
Under Contract Pending - Closing Soon
New Construction New Con DOM Resale Resale DOM Home Price Range Homes Resold
1 1 2 42 5 111 1
$500,000 $999,999
$1,000,000 $1,249,999 $1,250,000 $1,499,999
1 $1,500,000 $1,749,999 1 $1,750,000 $1,999,999
$2,000,000 $2,249,999 $2,250,000 $2,499,999 2 142 $2,500,000 $2,749,999 1 53 $2,750,000 $2,999,999 $3,000,000 $3,249,999 $3,250,000 $3,499,999 $3,500,000 $3,749,999 $3,750,000 $3,999,999
$4,000,000 $4,249,999 1 $4,250,000 $4,499,999
1 52
$4,500,000 $4,749,999
$4,750,000 $4,999,999
1 32
$5,000,000 $5,249,999 1 188 $5,250,000 $5,499,999 1 31 $5,500,000 $5,749,999
$5,750,000 $5,999,999
$6,000,000 $6,249,999
$6,250,000 $6,499,999 $6,500,000 $6,749,999
$6,750,000 $6,999,999
$7,000,000 $10,999,999
$11,000,000 $14,999,999 $15,000,000 $20,000,000
REALTORS
Homes as of December 31, 2022
BUYER
INVESTOR
Sold Homes Days on Market Before Sold
DOM October November December Resold DOM New Cons New DOM Homes Resold Resold DOM New Cons New DOM Homes Resold Resold DOM New Cons New DOM 43 2 30 1 19 2 47 1 82 2 30 1 12 1 19 43 REALTORS DIGEST
DEMAND
/
ADVANTAGE Based on last 3 months of homes sales, Bel-Air has 7.9 months supply of inventory.
=
$1,700,500 $1,622,583 $1,904,000 $1,977,500
OBSERVATION
Jan 01, 2019 to Dec 31, 2019 Jan 01, 2020 to Dec 31, 2020 Jan 01, 2021 to Dec 31, 2021 Jan 01, 2022 to Dec 31, 2022 Mid-Low Typical Home Price-Median Mid-High 4 YEAR TREND For questions, comments, a tailor-made report for your home area, or a complimentary home valuation please contact LeHoa Gacki LeHoa Gacki, DRE #01422855 Douglas Elliman Real Estate 11990 San Vicente Blvd., #100, L.A., Ca 90049 Email: Lehoa.Gacki@elliman.com Tel | Fax: (424) 276-7587 www.Lehoagacki.com | Lehoagacki.elliman.com 4 YEAR OBSERVATION Beverlywood Number of Homes Sold: 56 45 66 41 Jan 01, 2019 to Dec 31, 2019 Jan 01, 2020 to Dec 31, 2020 Jan 01, 2021 to Dec 31, 2021 Jan 01, 2022 to Dec 31, 2022 Actual Lowest Sold $1,010,000 $1,150,000 $1,425,000 $1,525,000 Mid-Low $1,700,500 $1,622,583 $1,904,000 $1,977,500 Typical Home Price-Median $2,000,000 $2,319,000 $2,497,500 $2,665,000 Mid-High $2,671,625 $3,410,000 $3,677,363 $3,532,500 Actual Highest Sold $5,500,000 $5,550,000 $5,930,000 $6,800,000 Average Price Sold $2,292,032 $2,532,637 $2,858,663 $2,959,544 12 MONTH
Beverlywood Cumulative 12 months sold home analysis from: January 01, 2022 to December 31, 2022 41 Sold Sold Price **Overbid / Underbid Square Feet Price per/SqFt YB LotSqFt BD BA Days on Market Actual Lowest Sold $1,525,000 102 1,277 $1,194 1949 6,292 3 2 0 Mid-Low* $1,977,500 96 1,812 $930 1947 6,178 3 2 9 Typical Home Price-Median* $2,665,000 100 2,434 $1,150 1949 6,854 3 3 13 Mid-High* $3,532,500 107 3,250 $1,294 1951 7,772 5 4 28 Actual Highest Sold $6,800,000 97 6,872 $990 2018 7,689 6 7 72 Average $2,959,544 103 2,732 $1,134 1959 7,056 4 3 26 **Overbid / Underbid: 100 is list price paid. Under 100 means sold for less than asking, over 100 sold probably in multiples and over asking. Note: Square Footage calculation could be more or less (+-) 20% difference. (Based on calculation.) * Middle Range Variance $1,555,000 Middle Range Variance is future range Typical Home Price (Median) Price will vary by. Never more, Never less. Source: TheMLS/CLAW (Combined Los Angeles Westside) © 2022 LEHOA GACKI. DRE# 01422855. ALL WORLDWIDE RIGHTS RESERVED. DOUGLAS ELLIMAN REAL ESTATE. 150 EL CAMINO DRIVE, BEVERLY HILLS, CA 90212. 310.595.3888. ALL MATERIAL PRESENTED HEREIN IS INTENDED FOR INFORMATION PURPOSES ONLY AND NOT INTENDED TO CONSTITUTE PROFESSIONAL ADVICE OR WARRANTY OUTSIDE THE REALM OF REAL ESTATE BROKERAGE. MAPS CREATED FOR REFERENCE PURPOSE ONLY. WHILE THIS INFORMATION IS BELIEVED TO BE CORRECT, IT IS REPRESENTED SUBJECT TO ERRORS, OMISSIONS, CHANGES OR WITHDRAWAL WITHOUT NOTICE. BASED ON DATA SOURCED FROM THE COMBINED LOS ANGELES WESTSIDE MULTIPLE LISTING SERVICE AND PUBLIC RECORDS. STATISTICS ARE SUBJECT TO CHANGE DUE TO INDIVIDUAL REAL ESTATE COMPANY REPORTING DISCIPLINES. BUYER ADVANTAGE OR SELLER ADVANTAGE IS STRICTLY OF THE OPINION OF LEHOA GACKI AND ACCURACY CANNOT BE GUARANTEED AND MAY NOT REFLECT ALL REAL ESTATE ACTIVITY ON THE MARKET. ALL PROPERTY INFORMATION, INCLUDING, BUT NOT LIMITED TO MAPS, GRAPHS, DEPICTIONS, SQUARE FOOTAGE, ROOM COUNT, NUMBER OF BEDROOMS AND THE SCHOOL DISTRICT IN PROPERTY LISTINGS SHOULD BE VERIFIED BY YOUR OWN ATTORNEY, ARCHITECT OR ZONING EXPERT. NEW CONSTRUCTION COUNT, SQUARE FOOTAGE AND YEAR BUILT IS BASED ON INDIVIDUAL REAL ESTATE COMPANY REPORTING AND MAY BE DIFFERENT THAN PUBLIC RECORDS. NEW CONSTRUCTION COUNT IS BASED ON LISTING BROKERAGE LISTING YEAR. THE BROKER/AGENT PROVIDING THE INFORMATION CONTAINED HEREIN MAY OR MAY HAVE NOT BEEN THE LISTING AND/OR SELLING AGENT. THIS IS NOT INTENDED TO SOLICIT PROPERTY ALREADY LISTED. EQUAL HOUSING OPPORTUNITY. NEIGHBORHOOD
PUBLIC RECORDS, COMBINED LOS ANGELES WESTSIDE MULTIPLE LISTING SERVICE AND LOS ANGELES TIMES
BEVERLYWOOD
$2,000,000 $2,319,000 $2,497,500 $2,665,000 $2,671,625 $3,410,000 $3,677,363 $3,532,500 $$500,000 $1,000,000 $1,500,000 $2,000,000 $2,500,000 $3,000,000 $3,500,000 $4,000,000
BOUNDARY SOURCE:
MAPPING L.A. https://maps.latimes.com/neighborhoods/index.html
40 41 14 11 20 20 11 295 10 15 20 25 30 35 40 45 Jan 01 to Jun 30, 2019 Jul 01 to Dec 31, 2019 Jan 01 to Jun 30, 2020 Jul 01 to Dec 31, 2020 Jan
to Jun
Jul
Sold 20 36 14 31 40
26 15 Days
END OF BEVERLYWOOD 6 PAGE REPORT
$832 $892 $952 $914 $962 $939 $1,187 $982 $872 $942 $1,007 $933 $977 $969 $1,200 $1,020 $$200 $400 $600 $800 $1,000 $1,200 $1,400 Jan 01 to Jun 30, 2019 Jul 01 to Dec 31, 2019 Jan 01 to Jun 30, 2020 Jul 01 to Dec 31, 2020 Jan 01 to Jun 30, 2021 Jul 01 to Dec 31, 2021 Jan 01 to Jun 30, 2022 Jul 01 to Dec 31, 2022 Median Price Per Square Foot Average Price per SquareFt
01
30, 2021
01 to Dec 31, 2021 Jan 01 to Jun 30, 2022 Jul 01 to Dec 31, 2022 Number of Homes
26
on Market before Sold
SOLD HOME PRICE PER SQUARE FOOT - PRE & POST MAR 2020 PANDEMIC BEVERLYWOOD DAYS ON MARKET BEFORE SOLD- PRE & POST MAR 2020 PANDEMIC BEVERLYWOOD
WHAT YOUR MONEY BUYS YOU THIS MONTH: Brentwood Home Analysis from: December 01, 2022 to December 31, 2022 13 Sold Sold Price **Overbid/ Underbid Square Feet Price per/SqFt YB LotSqFt BD BA Days on Market Actual Lowest Sold $2,075,000 95 1,961 $1,058 2014 3,418 3 4 18 Mid-Low* $2,550,000 93 2,480 $1,041 1962 9,156 4 4 9 Typical Home Price (Median)* $4,449,512 95 3,150 $1,383 1967 15,050 4 4 18 Mid-High* $8,525,000 101 6,382 $1,532 2007 20,165 6 8 58 Actual Highest Sold $25,000,000 93 13,425 $1,862 2018 21,646 6 8 58 Average $7,034,578 98 4,780 $1,330 1979 14,735 5 5 41 **Overbid/Underbid: 100 is list price paid. Under 100 means sold for less than asking, over 100 sold probably in multiples and over asking. Note: Square Footage calculation could be more or less (+-) 20% difference. (Based on calculation.) * Middle Range Variance $5,975,000 Middle Range Variance is future range Typical Home Price (Median) Price will vary by. Never more, Never less. Source: TheMLS/CLAW (Combined Los Angeles Westside) Single Family Homes December 2022 $4,449,512 TYPICAL HOME PRICE (MEDIAN) $1,383 SOLD PRICE PER SQUARE FOOT 18 DAYS ON MARKET BEFORE SOLD (DOM) $2,550,000 MID-LOW $8,525,000 MID-HIGH NEIGHBORING AREAS: Area Typical Home Price( Median) Price per/SqFt Days on Market Mid-Low Mid-High Pafic Palisades $3,917,500 $1,312 31 $2,933,750 $5,712,500 Encino $1,993,750 $718 20 $1,420,000 $3,200,000 Bel-Air $4,125,000 $1,205 43 $3,225,000 $9,962,500 Westwood $2,225,000 $1,136 22 $2,000,000 $2,431,550 Sawtelle $1,636,000 $824 38 $1,070,000 $1,748,000 Santa Monica $2,997,500 $1,525 16 $2,192,500 $4,200,000 LeHoa’s Neighborhood Data Charts Los Angeles Real Estate L.N.D.C. DECEMBER 2022 For questions, comments, a tailor-made report for your home area, or a complimentary home valuation please contact LeHoa Gacki LeHoa Gacki Douglas Elliman Real Estate DRE #01422855 Lehoa.Gacki@elliman.com www.LeHoaGacki.com 424.276.7587 Brentwood A neighborhood in the City of Los Angeles BRENTWOOD Santa Monica Encino Bel-Air Westwood Sawtelle Pacific Palicades
Buyer or Seller Advantage by Price Point for Brentwood as of December 31, 2022
Based on last 3 months of homes sales, Brentwood has 2.5 months supply of inventory.
HOME PRICE RANGE
$100,000,000 $200,000,000 $80,000,000 $99,999,999 $60,000,000 $79,999,999
BUYER ADVANTAGE $50,000,000 $59,999,999
BUYER ADVANTAGE $40,000,000 $49,999,999 $35,000,000 $39,999,999 $30,000,000 $34,999,999 $25,000,000 $29,999,999
BUYER ADVANTAGE $20,000,000 $24,999,999
BUYER ADVANTAGE $16,000,000 $19,999,999
BUYER ADVANTAGE $14,500,000 $15,999,999
BUYER ADVANTAGE $13,000,000 $14,499,999 $11,500,000 $12,999,999 $10,000,000 $11,499,999
BUYER ADVANTAGE
$9,000,000 $9,999,999 $8,000,000 $8,999,999
SELLER ADVANTAGE
SELLER ADVANTAGE
SELLER ADVANTAGE $7,000,000 $7,999,999 $6,500,000 $6,999,999
BUYER ADVANTAGE $6,000,000 $6,499,999 $5,500,000 $5,999,999
SELLER ADVANTAGE
SELLER ADVANTAGE $5,000,000 $5,499,999
SELLER ADVANTAGE $4,500,000 $4,999,999
SELLER ADVANTAGE $4,000,000 $4,499,999
SELLER ADVANTAGE $3,500,000 $3,999,999
SELLER ADVANTAGE
SELLER ADVANTAGE $2,500,000 $2,999,999
$3,000,000 $3,499,999
SELLER ADVANTAGE $2,000,000 $2,499,999 SELLER ADVANTAGE $1,500,000 $1,999,999
SELLER ADVANTAGE
4-6 = BALANCED MARKET 3 and under FAVORS
7
SELLER
and over FAVORS BUYER Months supply of Inventory =
Brentwood Inventory for New Construction and Resale of Homes
For Sale
Source: TheMLS/CLAW (Combined Los Angeles Westside)
Under Contract Pending - Closing Soon
New Construction New Con DOM Resale Resale DOM Home Price Range Homes Resold
5 6 4 115 28 136 10 1 116 $1,500,000 $1,999,999 1 1 1 70 $2,000,000 $2,499,999 1 2 1 2 117 $2,500,000 $2,999,999 3 4 170 $3,000,000 $3,499,999 2 1 2 166 $3,500,000 $3,999,999 1 1 $4,000,000 $4,499,999 2 1 21 $4,500,000 $4,999,999 1 $5,000,000 $5,499,999 1 $5,500,000 $5,999,999 1 45 $6,000,000 $6,499,999 1 150 $6,500,000 $6,999,999 1 3 72 $7,000,000 $7,999,999 2 88 $8,000,000 $8,999,999 1 1 349 $9,000,000 $9,999,999 1 1 158 $10,000,000 $11,499,999 2 95 $11,500,000 $12,999,999 1 71 2 208 $13,000,000 $14,499,999 1 164 $14,500,000 $15,999,999 2 119 1 78 $16,000,000 $19,999,999 1 408 $20,000,000 $24,999,999 $25,000,000 $29,999,999 $30,000,000 $34,999,999 $35,000,000 $39,999,999 1 34 $40,000,000 $49,999,999 1 126 $50,000,000 $59,999,999 $60,000,000 $79,999,999 $80,000,000 $99,999,999 $100,000,000 $200,000,000
SELLER ADVANTAGE SUPPLY & DEMAND
REALTORS
Homes as of December 31, 2022
DEMAND BUYER / INVESTOR ADVANTAGE
DOM New Cons New DOM Homes Resold Resold DOM New Cons New
New Cons
REALTORS DIGEST
Based on last 3 months of homes sales, Bel-Air has 7.9 months supply of inventory. Sold Homes Days on Market Before Sold = DOM October November December Resold
DOM Homes Resold Resold DOM
New DOM 34 14 29 1 39 13 41 9 1 42 9 2 18 17 2 20 27 4 57 67 2 5 1 4 2 36 2 82 145 1 13 1 20 1 15 1 1 10 9 2 5 1 39 1 1 1 12 1 194 1 58
$3,725,000
$2,714,500
Jan 01, 2019 to Dec 31, 2019 Jan 01, 2020 to Dec 31, 2020 Jan 01, 2021 to Dec 31, 2021 Jan 01, 2022 to Dec 31, 2022 Mid-Low Typical Home Price-Median Mid-High 4 YEAR TREND For questions, comments, a tailor-made report for your home area, or a complimentary home valuation please contact LeHoa Gacki LeHoa Gacki, DRE #01422855 Douglas Elliman Real Estate 11990 San Vicente Blvd., #100, L.A., Ca 90049 Email: Lehoa.Gacki@elliman.com Tel | Fax: (424) 276-7587 www.Lehoagacki.com | Lehoagacki.elliman.com 4 YEAR OBSERVATION Brentwood Number of Homes Sold: 230 242 319 216 Jan 01, 2019 to Dec 31, 2019 Jan 01, 2020 to Dec 31, 2020 Jan 01, 2021 to Dec 31, 2021 Jan 01, 2022 to Dec 31, 2022 Actual Lowest Sold $904,000 $1,250,000 $1,425,000 $1,280,000 Mid-Low $2,298,056 $2,378,000 $2,780,000 $2,714,500 Typical Home Price-Median $3,142,500 $3,180,000 $3,800,000 $3,725,000 Mid-High $5,500,000 $5,121,250 $6,125,000 $6,991,250 Actual Highest Sold $33,500,000 $25,800,000 $65,000,000 $26,900,000 Average Price Sold $4,683,032 $4,690,931 $5,669,383 $5,406,768 12 MONTH
Brentwood Cumulative 12 months sold home analysis from: January 01, 2022 to December 31, 2022 216 Sold Sold Price **Overbid / Underbid Square Feet Price per/SqFt YB LotSqFt BD BA Days on Market Actual Lowest Sold $1,280,000 95 1,167 $1,097 2003 1,419 2 2 115 Mid-Low* $2,714,500 95 2,135 $1,058 1946 7,655 3 3 8 Typical Home Price-Median* $3,725,000 100 3,056 $1,241 1959 12,531 4 4 15 Mid-High* $6,991,250 104 4,737 $1,549 1981 20,710 5 6 37 Actual Highest Sold $26,900,000 100 10,779 $2,496 2003 32,230 6 10 21 Average $5,406,768 101 3,914 $1,362 1965 33,413 4 5 34 **Overbid / Underbid: 100 is list price paid. Under 100 means sold for less than asking, over 100 sold probably in multiples and over asking. Note: Square Footage calculation could be more or less (+-) 20% difference. (Based on calculation.) * Middle Range Variance $4,276,750 Middle Range Variance is future range Typical Home Price (Median) Price will vary by. Never more, Never less. Source: TheMLS/CLAW (Combined Los Angeles Westside) © 2022 LEHOA GACKI. DRE# 01422855. ALL WORLDWIDE RIGHTS RESERVED. DOUGLAS ELLIMAN REAL ESTATE. 150 EL CAMINO DRIVE, BEVERLY HILLS, CA 90212. 310.595.3888. ALL MATERIAL PRESENTED HEREIN IS INTENDED FOR INFORMATION PURPOSES ONLY AND NOT INTENDED TO CONSTITUTE PROFESSIONAL ADVICE OR WARRANTY OUTSIDE THE REALM OF REAL ESTATE BROKERAGE. MAPS CREATED FOR REFERENCE PURPOSE ONLY. WHILE THIS INFORMATION IS BELIEVED TO BE CORRECT, IT IS REPRESENTED SUBJECT TO ERRORS, OMISSIONS, CHANGES OR WITHDRAWAL WITHOUT NOTICE. BASED ON DATA SOURCED FROM THE COMBINED LOS ANGELES WESTSIDE MULTIPLE LISTING SERVICE AND PUBLIC RECORDS. STATISTICS ARE SUBJECT TO CHANGE DUE TO INDIVIDUAL REAL ESTATE COMPANY REPORTING DISCIPLINES. BUYER ADVANTAGE OR SELLER ADVANTAGE IS STRICTLY OF THE OPINION OF LEHOA GACKI AND ACCURACY CANNOT BE GUARANTEED AND MAY NOT REFLECT ALL REAL ESTATE ACTIVITY ON THE MARKET. ALL PROPERTY INFORMATION, INCLUDING, BUT NOT LIMITED TO MAPS, GRAPHS, DEPICTIONS, SQUARE FOOTAGE, ROOM COUNT, NUMBER OF BEDROOMS AND THE SCHOOL DISTRICT IN PROPERTY LISTINGS SHOULD BE VERIFIED BY YOUR OWN ATTORNEY, ARCHITECT OR ZONING EXPERT. NEW CONSTRUCTION COUNT, SQUARE FOOTAGE AND YEAR BUILT IS BASED ON INDIVIDUAL REAL ESTATE COMPANY REPORTING AND MAY BE DIFFERENT THAN PUBLIC RECORDS. NEW CONSTRUCTION COUNT IS BASED ON LISTING BROKERAGE LISTING YEAR. THE BROKER/AGENT PROVIDING THE INFORMATION CONTAINED HEREIN MAY OR MAY HAVE NOT BEEN THE LISTING AND/OR SELLING AGENT. THIS IS NOT INTENDED TO SOLICIT PROPERTY ALREADY LISTED. EQUAL HOUSING OPPORTUNITY. NEIGHBORHOOD
PUBLIC RECORDS, COMBINED LOS ANGELES WESTSIDE MULTIPLE LISTING SERVICE AND LOS ANGELES TIMES MAPPING L.A. https://maps.latimes.com/neighborhoods/index.html BRENTWOOD
$2,298,056 $2,378,000 $2,780,000
$3,142,500 $3,180,000 $3,800,000
$5,500,000 $5,121,250 $6,125,000 $6,991,250 $$1,000,000 $2,000,000 $3,000,000 $4,000,000 $5,000,000 $6,000,000 $7,000,000 $8,000,000
OBSERVATION
BOUNDARY SOURCE:
$1,016 $958 $955 $1,008
58 62 45 31 30 24 14 1710 20 30 40 50 60 70 Jan 01 to Jun 30, 2019 Jul 01 to Dec 31, 2019 Jan 01 to Jun 30, 2020 Jul 01 to Dec 31,
Jan
Jun
Jul
Dec
Number of Homes Sold 117 113 77 165 164 155 137 79 Days
END OF BRENTWOOD 6 PAGE REPORT
PER
DAYS
$1,109 $1,132 $1,252 $1,230 $1,067 $1,057 $1,030 $1,103 $1,191 $1,237 $1,358 $1,369 $$200 $400 $600 $800 $1,000 $1,200 $1,400 $1,600 Jan 01 to Jun 30, 2019 Jul 01 to Dec 31, 2019 Jan 01 to Jun 30, 2020 Jul 01 to Dec 31, 2020 Jan 01 to Jun 30, 2021 Jul 01 to Dec 31, 2021 Jan 01 to Jun 30, 2022 Jul 01 to Dec 31, 2022 Median Price Per Square Foot Average Price per SquareFt
2020
01 to
30, 2021
01 to
31, 2021 Jan 01 to Jun 30, 2022 Jul 01 to Dec 31, 2022
on Market before Sold
SOLD HOME PRICE
SQUARE FOOT - PRE & POST MAR 2020 PANDEMIC BRENTWOOD
ON MARKET BEFORE SOLD- PRE & POST MAR 2020 PANDEMIC BRENTWOOD
Single Family Homes December 2022 12 MO STATISTICS TAKEN $4,687,351 TYPICAL HOME PRICE (MEDIAN) $1,139 SOLD PRICE PER SQUARE FOOT 19 DAYS ON MARKET BEFORE SOLD (DOM) NEIGHBORING AREAS: Area Typical Home Price (Median) Price per/SqFt Days on Market Mid-Low Mid-High Westwood $2,225,000 $1,136 22 $2,000,000 $2,431,550 Beverly Hills $5,343,500 $1,557 54 $3,483,750 $8,250,000 Pico-Robertson $2,512,500 $1,004 18 $1,575,000 $3,637,500 Cheviot Hills $3,235,000 $1,048 8 $2,535,000 $4,787,500 West Los Angeles $1,925,000 $1,303 20 $1,711,250 $2,545,375 CENTURY CITY Westwood West Los Angeles Beverly Hills Pico-Robertson Cheviot Hills For questions, comments, a tailor-made report for your home area, or a complimentary home valuation please contact LeHoa Gacki LeHoa Gacki Douglas Elliman Real Estate DRE #01422855 Lehoa.Gacki@elliman.com www.LeHoaGacki.com 424.276.7587 LeHoa’s Neighborhood Data Charts Los Angeles Real Estate L.N.D.C. DECEMBER 2022 Century City A neighborhood in the city of Los Angeles WHAT YOUR MONEY BUYS YOU THIS MONTH: Century City Home Analysis from: December 01, 2022 to December 31, 2022 2 Sold Sold Price **Overbid/ Underbid Square Feet Price per/SqFt YB LotSqFt BD BA Days on Market Actual Lowest Sold $3,307,290 104 3,000 $1,102 1940 5,888 5 3 12 Typical Home Price (Median)* $4,687,351 101 4,079 $1,139 1965 158,131 4 4 19 Actual Highest Sold $6,067,412 98 5,157 $1,177 1990 310,374 3 4 26 Average $4,687,351 101 4,079 $1,139 1965 158,131 4 4 19 **Overbid/Underbid: 100 is list price paid. Under 100 means sold for less than asking, over 100 sold probably in multiples and over asking. Note: Square Footage calculation could be more or less (+-) 20% difference. (Based on calculation.) * Middle Range Variance $5,035,000 Middle Range Variance is future range Typical Home Price (Median) Price will vary by. Never more, Never less. Source: TheMLS/CLAW (Combined Los Angeles Westside)
Buyer or Seller Advantage by Price Point for Century City as of December 31, 2022
Months supply of Inventory =
4-6 = BALANCED MARKET
Based on last 3 months of homes sales, Century City has 3.0 months supply of inventory.
HOME PRICE RANGE
$15,000,000 $20,000,000 $11,000,000 $14,999,999 $7,000,000 $10,999,999
BUYER ADVANTAGE
$6,750,000 $6,999,999
$6,500,000 $6,749,999 $6,250,000 $6,499,999 $6,000,000 $6,249,999
$5,750,000 $5,999,999
$5,500,000 $5,749,999 $5,250,000 $5,499,999
$5,000,000 $5,249,999 $4,750,000 $4,999,999 $4,500,000 $4,749,999 $4,250,000 $4,499,999 $4,000,000 $4,249,999 $3,750,000 $3,999,999 $3,500,000 $3,749,999 $3,250,000 $3,499,999
$3,000,000 $3,249,999 $2,750,000 $2,999,999 $2,500,000 $2,749,999
3 and under FAVORS SELLER 7 and over FAVORS BUYER
SELLER ADVANTAGE
BUYER ADVANTAGE
$2,250,000 $2,499,999 $2,000,000 $2,249,999 $1,750,000 $1,999,999 $1,500,000 $1,749,999 $1,250,000 $1,499,999 $1,000,000 $1,249,999 $500,000 $999,999
SELLER ADVANTAGE
Century City Inventory for New Construction and Resale of Homes
SELLER ADVANTAGE SUPPLY & DEMAND
For Sale
Source: TheMLS/CLAW (Combined Los Angeles Westside)
Under Contract Pending - Closing Soon
New Construction New Con DOM Resale Resale DOM Home Price Range Homes Resold
2 160
$500,000 $999,999
$1,000,000 $1,249,999
$1,250,000 $1,499,999 $1,500,000 $1,749,999 $1,750,000 $1,999,999
$2,000,000 $2,249,999
1 74 $2,250,000 $2,499,999
$2,500,000 $2,749,999
$2,750,000 $2,999,999
$3,000,000 $3,249,999 $3,250,000 $3,499,999 $3,500,000 $3,749,999 $3,750,000 $3,999,999
$4,000,000 $4,249,999
$4,250,000 $4,499,999
$4,500,000 $4,749,999
$4,750,000 $4,999,999
$5,000,000 $5,249,999
$5,250,000 $5,499,999
$5,500,000 $5,749,999
$5,750,000 $5,999,999 $6,000,000 $6,249,999
$6,250,000 $6,499,999 $6,500,000 $6,749,999
1 245 $6,750,000 $6,999,999
$7,000,000 $10,999,999
$11,000,000 $14,999,999
$15,000,000 $20,000,000
REALTORS
Homes as of December 31, 2022
Sold
November December Resold DOM New Cons New DOM Homes Resold Resold DOM New Cons New DOM Homes Resold Resold DOM New Cons New DOM 2 19
12 1 26 REALTORS DIGEST
DEMAND BUYER / INVESTOR ADVANTAGE Based on last 3 months of homes sales, Bel-Air has 7.9 months supply of inventory. Sold Homes Days on Market Before
= DOM October
1
CENTURY CITY
$3,339,000 Mid-Low Typical Home Price-Median Mid-High
$2,470,000 $2,781,750 $2,522,500 $2,243,292 Jan 01, 2019 to Dec 31, 2019 Jan 01, 2020 to Dec 31, 2020 Jan 01, 2021 to Dec 31, 2021 Jan 01, 2022 to Dec 31, 2022
4 YEAR OBSERVATION Century City Number of Homes Sold: 12 20 23 14 Jan 01, 2019 to Dec 31, 2019 Jan 01, 2020 to Dec 31, 2020 Jan 01, 2021 to Dec 31, 2021 Jan 01, 2022 to Dec 31, 2022 Actual Lowest Sold $1,450,000 $1,245,000 $1,550,000 $1,560,000 Mid-Low $1,819,000 $1,557,191 $1,811,194 $1,948,125 Typical Home Price-Median $2,231,250 $1,906,250 $2,470,000 $2,781,750 Mid-High $2,522,500 $2,243,292 $3,339,000 $4,168,103 Actual Highest Sold $3,050,000 $2,760,000 $7,100,000 $9,350,000 Average Price Sold $2,199,125 $1,905,644 $2,976,421 $3,505,054 12 MONTH
$4,168,103 4 YEAR TREND For questions, comments, a tailor-made report for your home area, or a complimentary home valuation please contact LeHoa Gacki LeHoa Gacki, DRE #01422855 Douglas Elliman Real Estate 11990 San Vicente Blvd., #100, L.A., Ca 90049

$$500,000 $1,000,000 $1,500,000 $2,000,000 $2,500,000 $3,000,000 $3,500,000 $4,000,000 $4,500,000 Email: Lehoa.Gacki@elliman.com Tel | Fax: (424) 276-7587 www.Lehoagacki.com | Lehoagacki.elliman.com
OBSERVATION
Century City Cumulative 12 months sold home analysis from: January 01, 2022 to December 31, 2022 14 Sold Sold Price **Overbid / Underbid Square Feet Price per/SqFt YB LotSqFt BD BA Days on Market Actual Lowest Sold $1,560,000 93 1,108 $1,408 1931 4,938 2 1 6 Mid-Low* $1,948,125 97 1,497 $1,111 1929 5,639 3 2 9 Typical Home Price-Median* $2,781,750 103 2,170 $1,260 1938 6,055 3 3 12 Mid-High* $4,168,103 111 3,621 $1,417 1990 22,832 4 4 20 Actual Highest Sold $9,350,000 94 6,471 $1,445 2016 70,698 5 7 13 Average $3,505,054 103 2,761 $1,285 1954 54,005 3 3 23 **Overbid / Underbid: 100 is list price paid. Under 100 means sold for less than asking, over 100 sold probably in multiples and over asking. Note: Square Footage calculation could be more or less (+-) 20% difference. (Based on calculation.) * Middle Range Variance $2,219,978 Middle Range Variance is future range Typical Home Price (Median) Price will vary by. Never more, Never less. Source: TheMLS/CLAW (Combined Los Angeles Westside) © 2022 LEHOA GACKI. DRE# 01422855. ALL WORLDWIDE RIGHTS RESERVED. DOUGLAS ELLIMAN REAL ESTATE. 150 EL CAMINO DRIVE, BEVERLY HILLS, CA 90212. 310.595.3888. ALL MATERIAL PRESENTED HEREIN IS INTENDED FOR INFORMATION PURPOSES ONLY AND NOT INTENDED TO CONSTITUTE PROFESSIONAL ADVICE OR WARRANTY OUTSIDE THE REALM OF REAL ESTATE BROKERAGE. MAPS CREATED FOR REFERENCE PURPOSE ONLY. WHILE THIS INFORMATION IS BELIEVED TO BE CORRECT, IT IS REPRESENTED SUBJECT TO ERRORS, OMISSIONS, CHANGES OR WITHDRAWAL WITHOUT NOTICE. BASED ON DATA SOURCED FROM THE COMBINED LOS ANGELES WESTSIDE MULTIPLE LISTING SERVICE AND PUBLIC RECORDS. STATISTICS ARE SUBJECT TO CHANGE DUE TO INDIVIDUAL REAL ESTATE COMPANY REPORTING DISCIPLINES. BUYER ADVANTAGE OR SELLER ADVANTAGE IS STRICTLY OF THE OPINION OF LEHOA GACKI AND ACCURACY CANNOT BE GUARANTEED AND MAY NOT REFLECT ALL REAL ESTATE ACTIVITY ON THE MARKET. ALL PROPERTY INFORMATION, INCLUDING, BUT NOT LIMITED TO MAPS, GRAPHS, DEPICTIONS, SQUARE FOOTAGE, ROOM COUNT, NUMBER OF BEDROOMS AND THE SCHOOL DISTRICT IN PROPERTY LISTINGS SHOULD BE VERIFIED BY YOUR OWN ATTORNEY, ARCHITECT OR ZONING EXPERT. NEW CONSTRUCTION COUNT, SQUARE FOOTAGE AND YEAR BUILT IS BASED ON INDIVIDUAL REAL ESTATE COMPANY REPORTING AND MAY BE DIFFERENT THAN PUBLIC RECORDS. NEW CONSTRUCTION COUNT IS BASED ON LISTING BROKERAGE LISTING YEAR. THE BROKER/AGENT PROVIDING THE INFORMATION CONTAINED HEREIN MAY OR MAY HAVE NOT BEEN THE LISTING AND/OR SELLING AGENT. THIS IS NOT INTENDED TO SOLICIT PROPERTY ALREADY LISTED. EQUAL HOUSING OPPORTUNITY. NEIGHBORHOOD BOUNDARY SOURCE: PUBLIC RECORDS, COMBINED LOS ANGELES WESTSIDE MULTIPLE LISTING SERVICE AND LOS ANGELES TIMES MAPPING L.A. https://maps.latimes.com/neighborhoods/index.html
$1,819,000 $1,557,191 $1,811,194 $1,948,125
$2,231,250 $1,906,250
18 15 21 34 15 57 10 1610 20 30 40 50 60 Jan 01 to Jun 30, 2019 Jul 01 to Dec 31, 2019 Jan 01 to Jun 30, 2020 Jul 01 to Dec 31,
5 7 2 18 14 9 6 8
END OF CENTURY CITY 6 PAGE REPORT
$873 $849 $932 $980 $1,032 $1,132 $1,347 $1,204 $800 $878 $932 $995 $1,011 $1,065 $1,337 $1,247 $$200 $400 $600 $800 $1,000 $1,200 $1,400 $1,600 Jan 01 to Jun 30, 2019 Jul 01 to Dec 31, 2019 Jan 01 to Jun 30, 2020 Jul 01 to Dec 31, 2020 Jan 01 to Jun 30, 2021 Jul 01 to Dec 31, 2021 Jan 01 to Jun 30, 2022 Jul 01 to Dec 31, 2022 Median Price Per Square Foot Average Price per SquareFt
2020 Jan 01 to Jun 30, 2021 Jul 01 to Dec 31, 2021 Jan 01 to Jun 30, 2022 Jul 01 to Dec 31, 2022 Number of Homes Sold
Days on Market before Sold
SOLD HOME PRICE PER SQUARE FOOT - PRE & POST MAR 2020 PANDEMIC CENTURY CITY DAYS ON MARKET BEFORE SOLD- PRE & POST MAR 2020 PANDEMIC CENTURY CITY
Single Family Homes December 2022 $3,235,000 TYPICAL HOME PRICE (MEDIAN) $1,048 SOLD PRICE PER SQUARE FOOT 8 DAYS ON MARKET BEFORE SOLD (DOM) $2,535,000 LOWEST SOLD $4,787,500 HIGHEST SOLD NEIGHBORING AREAS: Area Typical Home Price (Median) Price per/SqFt Days on Market Mid-Low Mid-High Rancho Park $1,655,000 $1,083 12 $1,521,750 $2,115,000 West Los Angeles $1,925,000 $1,303 20 $1,711,250 $2,545,375 Century City $2,781,750 $2,170 12 $1,948,125 $4,168,103 Pico-Robertson $2,512,500 $1,004 18 $1,575,000 $3,637,500 Beverlywood $2,665,000 $2,434 13 $1,977,500 $3,532,500 Palms $1,515,000 $951 52 $1,175,000 $2,195,000 For questions, comments, a tailor-made report for your home area, or a complimentary home valuation please contact LeHoa Gacki LeHoa Gacki Douglas Elliman Real Estate DRE #01422855 Lehoa.Gacki@elliman.com www.LeHoaGacki.com 424.276.7587 LeHoa’s Neighborhood Data Charts Los Angeles Real Estate L.N.D.C. DECEMBER 2022 Cheviot Hills A neighborhood in the City of Los Angeles CHEVIOT HILLS Pico-Robertson Century City Beverlywood West Los Angeles Palms Rancho Park WHAT YOUR MONEY BUYS YOU THIS MONTH: Cheviot Hills Home Analysis from: December 01, 2022 to December 31, 2022 5 Sold Sold Price **Overbid/ Underbid Square Feet Price per/SqFt YB LotSqFt BD BA Days on Market Actual Lowest Sold $2,070,000 94 1,923 $1,076 1949 7,510 3 3 8 Mid-Low* $2,535,000 93 2,393 $1,008 1951 6,924 3 3 0 Typical Home Price (Median)* $3,235,000 98 3,266 $1,048 1959 7,592 4 5 8 Mid-High* $4,787,500 100 4,329 $1,118 2022 11,410 5 6 45 Actual Highest Sold $6,000,000 100 5,175 $1,159 2022 7,592 5 6 0 Average $3,576,000 97 3,342 $1,060 1981 8,852 4 5 20 **Overbid/Underbid: 100 is list price paid. Under 100 means sold for less than asking, over 100 sold probably in multiples and over asking. Note: Square Footage calculation could be more or less (+-) 20% difference. (Based on calculation.) * Middle Range Variance $2,252,500 Middle Range Variance is future range Typical Home Price (Median) Price will vary by. Never more, Never less. Source: TheMLS/CLAW (Combined Los Angeles Westside)
Buyer or Seller Advantage by Price Point for Cheviot Hills as of December 31, 2022
Months supply of Inventory =
Based on last 3 months of homes sales, Cheviot Hills has 1.1 months supply of inventory.
HOME PRICE RANGE
$15,000,000 $20,000,000 $12,000,000 $14,999,999 $11,000,000 $11,999,999 $10,000,000 $10,999,999 $9,000,000 $9,999,999
BUYER ADVANTAGE $8,000,000 $8,999,999
BUYER ADVANTAGE $7,500,000 $7,999,999 $7,000,000 $7,499,999 $6,500,000 $6,999,999 $6,000,000 $6,499,999
$5,500,000 $5,999,999
BUYER ADVANTAGE $5,000,000 $5,499,999 $4,750,000 $4,999,999
4-6 = BALANCED MARKET 3 and under FAVORS SELLER 7 and over FAVORS BUYER
SELLER ADVANTAGE
SELLER ADVANTAGE $4,500,000 $4,749,999
BUYER ADVANTAGE $4,250,000 $4,499,999 $4,000,000 $4,249,999
$3,750,000 $3,999,999 $3,500,000 $3,749,999
$3,250,000 $3,499,999 $3,000,000 $3,249,999
SELLER ADVANTAGE
SELLER ADVANTAGE
SELLER ADVANTAGE $2,750,000 $2,999,999
$2,500,000 $2,749,999 $2,250,000 $2,499,999
SELLER ADVANTAGE
SELLER ADVANTAGE $2,000,000 $2,249,999
$1,750,000 $1,999,999
$1,500,000 $1,749,999 $1,250,000 $1,499,999 $1,000,000 $1,249,999
SELLER ADVANTAGE
SELLER ADVANTAGE
Cheviot Hills Inventory for New Construction and Resale of Homes
SELLER ADVANTAGE SUPPLY & DEMAND
For Sale
Source: TheMLS/CLAW (Combined Los Angeles Westside)
Under Contract Pending - Closing Soon
New Construction New Con DOM Resale Resale DOM Home Price Range Homes Resold
1 2 3 54 3 61 8
$1,000,000 $1,249,999
$1,250,000 $1,499,999 $1,500,000 $1,749,999
1
1 77
$1,750,000 $1,999,999 1 $2,000,000 $2,249,999
$2,250,000 $2,499,999 2 $2,500,000 $2,749,999
1 1 96 $2,750,000 $2,999,999 1 $3,000,000 $3,249,999 1 $3,250,000 $3,499,999 $3,500,000 $3,749,999 1 $3,750,000 $3,999,999 $4,000,000 $4,249,999 1 1 57 $4,250,000 $4,499,999 $4,500,000 $4,749,999
1 $4,750,000 $4,999,999 1
1 32
$5,000,000 $5,499,999
$5,500,000 $5,999,999 $6,000,000 $6,499,999
$6,500,000 $6,999,999 $7,000,000 $7,499,999 1 31 $7,500,000 $7,999,999
1 53
$8,000,000 $8,999,999
$9,000,000 $9,999,999
$10,000,000 $10,999,999
$11,000,000 $11,999,999
$12,000,000 $14,999,999 $15,000,000 $20,000,000
REALTORS
Homes as of December 31, 2022 DEMAND BUYER / INVESTOR ADVANTAGE
Sold Homes Days on Market Before Sold = DOM October November December Resold DOM New Cons New DOM Homes Resold Resold DOM New Cons New DOM Homes Resold Resold DOM New Cons New DOM 52 2 17 1 6 3 15 2 27 13 1 1 6 1 8 37 1 33 54 48 2 19 144 1 53 9 74 1 0 REALTORS DIGEST
Based on last 3 months of homes sales, Bel-Air has 7.9 months supply of inventory.
OBSERVATION
Jan 01, 2019 to Dec 31, 2019 Jan 01, 2020 to Dec 31, 2020 Jan 01, 2021 to Dec 31, 2021 Jan 01, 2022 to Dec 31, 2022 Mid-Low Typical Home Price-Median Mid-High 4 YEAR TREND For questions, comments, a tailor-made report for your home area, or a complimentary home valuation please contact LeHoa Gacki LeHoa Gacki, DRE #01422855 Douglas Elliman Real Estate 11990 San Vicente Blvd., #100, L.A., Ca 90049 Email: Lehoa.Gacki@elliman.com Tel | Fax: (424) 276-7587 www.Lehoagacki.com | Lehoagacki.elliman.com 4 YEAR OBSERVATION Cheviot Hills Number of Homes Sold: 61 56 62 62 Jan 01, 2019 to Dec 31, 2019 Jan 01, 2020 to Dec 31, 2020 Jan 01, 2021 to Dec 31, 2021 Jan 01, 2022 to Dec 31, 2022 Actual Lowest Sold $1,095,000 $1,420,000 $1,400,000 $1,715,000 Mid-Low $1,777,500 $2,462,500 $2,037,500 $2,300,000 Typical Home Price-Median $2,325,500 $2,853,500 $2,585,000 $3,035,000 Mid-High $2,966,700 $3,393,750 $3,626,250 $3,762,500 Actual Highest Sold $5,600,000 $6,800,000 $7,499,000 $11,000,000 Average Price Sold $2,471,576 $3,034,258 $3,094,921 $3,384,557 12 MONTH
Cheviot Hills Cumulative 12 months sold home analysis from: January 01, 2022 to December 31, 2022 62 Sold Sold Price **Overbid / Underbid Square Feet Price per/SqFt YB LotSqFt BD BA Days on Market Actual Lowest Sold $1,715,000 96 1,735 $988 1928 5,637 4 3 7 Mid-Low* $2,300,000 95 2,055 $985 1931 6,250 3 3 7 Typical Home Price-Median* $3,035,000 100 2,896 $1,074 1941 6,991 4 3 14 Mid-High* $3,762,500 103 3,819 $1,185 2002 8,557 5 5 37 Actual Highest Sold $11,000,000 100 5,436 $2,024 1926 26,903 7 7 0 Average $3,384,557 100 3,089 $1,094 1960 7,917 4 4 32 **Overbid / Underbid: 100 is list price paid. Under 100 means sold for less than asking, over 100 sold probably in multiples and over asking. Note: Square Footage calculation could be more or less (+-) 20% difference. (Based on calculation.) * Middle Range Variance $1,462,500 Middle Range Variance is future range Typical Home Price (Median) Price will vary by. Never more, Never less. Source: TheMLS/CLAW (Combined Los Angeles Westside) © 2022 LEHOA GACKI. DRE# 01422855. ALL WORLDWIDE RIGHTS RESERVED. DOUGLAS ELLIMAN REAL ESTATE. 150 EL CAMINO DRIVE, BEVERLY HILLS, CA 90212. 310.595.3888. ALL MATERIAL PRESENTED HEREIN IS INTENDED FOR INFORMATION PURPOSES ONLY AND NOT INTENDED TO CONSTITUTE PROFESSIONAL ADVICE OR WARRANTY OUTSIDE THE REALM OF REAL ESTATE BROKERAGE. MAPS CREATED FOR REFERENCE PURPOSE ONLY. WHILE THIS INFORMATION IS BELIEVED TO BE CORRECT, IT IS REPRESENTED SUBJECT TO ERRORS, OMISSIONS, CHANGES OR WITHDRAWAL WITHOUT NOTICE. BASED ON DATA SOURCED FROM THE COMBINED LOS ANGELES WESTSIDE MULTIPLE LISTING SERVICE AND PUBLIC RECORDS. STATISTICS ARE SUBJECT TO CHANGE DUE TO INDIVIDUAL REAL ESTATE COMPANY REPORTING DISCIPLINES. BUYER ADVANTAGE OR SELLER ADVANTAGE IS STRICTLY OF THE OPINION OF LEHOA GACKI AND ACCURACY CANNOT BE GUARANTEED AND MAY NOT REFLECT ALL REAL ESTATE ACTIVITY ON THE MARKET. ALL PROPERTY INFORMATION, INCLUDING, BUT NOT LIMITED TO MAPS, GRAPHS, DEPICTIONS, SQUARE FOOTAGE, ROOM COUNT, NUMBER OF BEDROOMS AND THE SCHOOL DISTRICT IN PROPERTY LISTINGS SHOULD BE VERIFIED BY YOUR OWN ATTORNEY, ARCHITECT OR ZONING EXPERT. NEW CONSTRUCTION COUNT, SQUARE FOOTAGE AND YEAR BUILT IS BASED ON INDIVIDUAL REAL ESTATE COMPANY REPORTING AND MAY BE DIFFERENT THAN PUBLIC RECORDS. NEW CONSTRUCTION COUNT IS BASED ON LISTING BROKERAGE LISTING YEAR. THE BROKER/AGENT PROVIDING THE INFORMATION CONTAINED HEREIN MAY OR MAY HAVE NOT BEEN THE LISTING AND/OR SELLING AGENT. THIS IS NOT INTENDED TO SOLICIT PROPERTY ALREADY LISTED. EQUAL HOUSING OPPORTUNITY. NEIGHBORHOOD BOUNDARY SOURCE: PUBLIC RECORDS, COMBINED LOS ANGELES WESTSIDE MULTIPLE LISTING SERVICE AND LOS ANGELES TIMES MAPPING L.A. https://maps.latimes.com/neighborhoods/index.html CHEVIOT HILLS
$1,777,500 $2,462,500 $2,037,500 $2,300,000 $2,325,500 $2,853,500 $2,585,000 $3,035,000 $2,966,700 $3,393,750 $3,626,250 $3,762,500 $$500,000 $1,000,000 $1,500,000 $2,000,000 $2,500,000 $3,000,000 $3,500,000 $4,000,000
$-
Jan 01 to Jun
Jul 01 to Dec 31,
Jan 01 to Jun
Jul
Dec
Jul
Price Per
Price
34 24 33 25 35 13 12 185 10 15 20 25 30 35 40 Jan 01 to Jun 30, 2019 Jul 01 to Dec 31, 2019 Jan 01 to Jun 30, 2020 Jul 01 to Dec 31, 2020 Jan 01 to Jun 30, 2021 Jul 01 to Dec 31, 2021 Jan 01 to Jun 30, 2022 Jul 01 to Dec 31, 2022 Number of Homes Sold 33 28 22 34 32 30 27 35 Days on
Sold END OF CHEVIOT HILLS 6 PAGE REPORT SOLD HOME PRICE PER SQUARE FOOT - PRE & POST MAR 2020
CHEVIOT
DAYS ON MARKET BEFORE SOLD-
POST
$917 $809 $921 $926 $961 $969 $1,071 $1,076 $948 $851 $913 $930 $984 $1,011 $1,116 $1,077
$200 $400 $600 $800 $1,000 $1,200
30, 2019
2019
30, 2020
01 to
31, 2020 Jan 01 to Jun 30, 2021
01 to Dec 31, 2021 Jan 01 to Jun 30, 2022 Jul 01 to Dec 31, 2022 Median
Square Foot Average
per SquareFt
Market before
PANDEMIC
HILLS
PRE &
MAR 2020 PANDEMIC CHEVIOT HILLS
WHAT YOUR MONEY BUYS YOU THIS MONTH: Culver City Home Analysis from: December 01, 2022 to December 31, 2022 8 Sold Sold Price **Overbid/ Underbid Square Feet Price per/SqFt YB LotSqFt BD BA Days on Market Actual Lowest Sold $1,550,000 97 1,899 $816 1952 6,247 5 2 18 Mid-Low* $1,571,500 96 1,393 $950 1941 5,095 3 2 6 Typical Home Price (Median)* $1,870,000 100 1,769 $1,044 1952 5,861 4 3 11 Mid-High* $2,041,250 103 1,969 $1,181 1958 6,690 4 3 17 Actual Highest Sold $2,395,900 100 2,554 $938 1989 4,994 4 3 0 Average $1,860,863 100 1,770 $1,079 1953 5,890 4 3 11 **Overbid/Underbid: 100 is list price paid. Under 100 means sold for less than asking, over 100 sold probably in multiples and over asking. Note: Square Footage calculation could be more or less (+-) 20% difference. (Based on calculation.) * Middle Range Variance $469,750 Middle Range Variance is future range Typical Home Price (Median) Price will vary by. Never more, Never less. Source: TheMLS/CLAW (Combined Los Angeles Westside) Single Family Homes December 2022 $1,870,000 TYPICAL HOME PRICE (MEDIAN) $1,044 SOLD PRICE PER SQUARE FOOT 11 DAYS ON MARKET BEFORE SOLD (DOM) $1,571,500 MID-LOW $2,041,250 MID-HIGH For questions, comments, a tailor-made report for your home area, or a complimentary home valuation please contact LeHoa Gacki LeHoa Gacki Douglas Elliman Real Estate DRE #01422855 Lehoa.Gacki@elliman.com www.LeHoaGacki.com 424.276.7587 LeHoa’s Neighborhood Data Charts Los Angeles Real Estate L.N.D.C. DECEMBER 2022 Culver City A City in Los Angeles County CULVER CITY Palms Mid-city Mar Vista Playa Vista Venice Ladera Heights Del Rey West Adams Baldwin Hills/ Crenshaw NEIGHBORING AREAS: Area Typical Home Price (Median) Price per/SqFt Days on Market Mid-Low Mid-High Del Rey $1,870,000 $1,044 11 $1,571,500 $2,041,250 Venice $2,162,500 $1,375 27 $1,555,000 $3,487,500 Mar Vista $2,610,578 $1,162 14 $1,607,500 $3,731,250 Palms $1,515,000 $951 52 $1,175,000 $2,195,000 Mid-City $1,326,000 $808 20 $1,096,250 $1,629,625 West Adams $1,003,420 $787 13 $801,250 $1,178,625 Ladera Heights $1,680,000 $3,325 12 $1,425,000 $2,175,000 Playa Vista $1,910,000 $845 6 $1,125,000 $2,653,250
Buyer or Seller Advantage by Price Point for Culver City as of December 31, 2022
Months supply of Inventory =
4-6 = BALANCED MARKET
Based on last 3 months of homes sales, Culver City has 1.6 months supply of inventory.
HOME PRICE RANGE
$6,000,000 $10,000,000 $5,000,000 $5,999,999 $4,450,000 $4,999,999 $4,300,000 $4,449,999 $4,150,000 $4,299,999 $4,000,000 $4,149,999 $3,850,000 $3,999,999 $3,700,000 $3,849,999 $3,550,000 $3,699,999 $3,400,000 $3,549,999 $3,250,000 $3,399,999 $3,100,000 $3,249,999 $2,950,000 $3,099,999
3 and under FAVORS SELLER 7 and over FAVORS BUYER
SELLER ADVANTAGE
BUYER ADVANTAGE
$2,800,000 $2,949,999 $2,650,000 $2,799,999 $2,500,000 $2,649,999 $2,350,000 $2,499,999
SELLER ADVANTAGE $2,200,000 $2,349,999
SELLER ADVANTAGE
SELLER ADVANTAGE $1,900,000 $2,049,999
$2,050,000 $2,199,999
SELLER ADVANTAGE $1,750,000 $1,899,999
SELLER ADVANTAGE
SELLER ADVANTAGE $1,450,000 $1,599,999
$1,600,000 $1,749,999
SELLER ADVANTAGE $1,300,000 $1,449,999
SELLER ADVANTAGE $1,150,000 $1,299,999
SELLER ADVANTAGE $1,000,000 $1,149,999
SELLER ADVANTAGE $750,000 $999,999 $500,000 $749,999
Culver City Inventory for New Construction and Resale of Homes
SELLER
For Sale
Source: TheMLS/CLAW (Combined Los Angeles Westside)
Under Contract Pending - Closing Soon
New Construction New Con DOM Resale Resale DOM Home Price Range Homes Resold
5 2 2 94 14 54 12
$500,000 $749,999 $750,000 $999,999
1 $1,000,000 $1,149,999
1 $1,150,000 $1,299,999 2 1 1 30 $1,300,000 $1,449,999 1 4 43 $1,450,000 $1,599,999 1 1 26 $1,600,000 $1,749,999 1
1 1 4 89 $1,750,000 $1,899,999 2 $1,900,000 $2,049,999 1 2 27 $2,050,000 $2,199,999 1 1 77 $2,200,000 $2,349,999 3 1 $2,350,000 $2,499,999
$2,500,000 $2,649,999 $2,650,000 $2,799,999 1 76 $2,800,000 $2,949,999 1 1 112 1 35 $2,950,000 $3,099,999
$3,100,000 $3,249,999 $3,250,000 $3,399,999 $3,400,000 $3,549,999
$3,550,000 $3,699,999 $3,700,000 $3,849,999 $3,850,000 $3,999,999
$4,000,000 $4,149,999
$4,150,000 $4,299,999 $4,300,000 $4,449,999 $4,450,000 $4,999,999 $5,000,000 $5,999,999 $6,000,000 $10,000,000
ADVANTAGE SUPPLY & DEMAND
REALTORS
as of December 31, 2022
BUYER
DEMAND
/ INVESTOR ADVANTAGE
DOM New Cons New DOM Homes Resold Resold
New Cons
Cons
17
22
16 1
20 1
8
41 2
26 1
3
5
14 2
1 0 REALTORS DIGEST
Based on last 3 months of homes sales, Bel-Air has 7.9 months supply of inventory. Sold Homes Days on Market Before Sold = DOM October November December Resold
DOM
New DOM Homes Resold Resold DOM New
New DOM
1 0 8
1 24 8 11
7
20
1 14 3 11
26
20 1 13
2 10
1 25
76 1 24 1 0
$-
Jan 01, 2019 to Dec 31, 2019 Jan 01, 2020 to Dec 31, 2020 Jan 01, 2021 to Dec 31, 2021 Jan 01, 2022 to Dec 31, 2022 Mid-Low Typical Home Price-Median Mid-High 4 YEAR
For questions, comments, a tailor-made report for your home area, or a complimentary home valuation please contact LeHoa Gacki LeHoa Gacki, DRE #01422855 Douglas Elliman Real Estate 11990 San Vicente Blvd., #100, L.A., Ca 90049 Email: Lehoa.Gacki@elliman.com Tel | Fax: (424) 276-7587 www.Lehoagacki.com | Lehoagacki.elliman.com 4 YEAR OBSERVATION Culver City Number of Homes Sold: 185 151 226 147 Jan 01, 2019 to Dec 31, 2019 Jan 01, 2020 to Dec 31, 2020 Jan 01, 2021 to Dec 31, 2021 Jan 01, 2022 to Dec 31, 2022 Actual Lowest Sold $750,000 $950,000 $800,000 $1,015,000 Mid-Low $1,199,500 $1,260,000 $1,404,875 $1,570,000 Typical Home Price-Median $1,375,500 $1,525,000 $1,689,500 $1,825,150 Mid-High $1,699,500 $1,761,000 $2,039,500 $2,212,500 Actual Highest Sold $4,195,000 $3,375,000 $4,210,000 $4,575,000 Average Price Sold $1,500,839 $1,603,329 $1,805,070 $1,955,284 12 MONTH OBSERVATION Culver City Cumulative 12 months sold home analysis from: January 01, 2022 to December 31, 2022 147 Sold Sold Price **Overbid / Underbid Square Feet Price per/SqFt YB LotSqFt BD BA Days on Market Actual Lowest Sold $1,015,000 107 1,639 $619 1984 1,283 2 3 4 Mid-Low* $1,570,000 98 1,323 $948 1940 5,004 3 2 8 Typical Home Price-Median* $1,825,150 102 1,681 $1,105 1948 5,485 3 2 13 Mid-High* $2,212,500 109 2,110 $1,237 1952 6,188 4 3 20 Actual Highest Sold $4,575,000 115 3,555 $1,287 2021 6,024 4 5 12 Average $1,955,284 104 1,813 $1,119 1954 5,729 3 3 19 **Overbid / Underbid: 100 is list price paid. Under 100 means sold for less than asking, over 100 sold probably in multiples and over asking. Note: Square Footage calculation could be more or less (+-) 20% difference. (Based on calculation.) * Middle Range Variance $642,500 Middle Range Variance is future range Typical Home Price (Median) Price will vary by. Never more, Never less. Source: TheMLS/CLAW (Combined Los Angeles Westside) © 2022 LEHOA GACKI. DRE# 01422855. ALL WORLDWIDE RIGHTS RESERVED. DOUGLAS ELLIMAN REAL ESTATE. 150 EL CAMINO DRIVE, BEVERLY HILLS, CA 90212. 310.595.3888. ALL MATERIAL PRESENTED HEREIN IS INTENDED FOR INFORMATION PURPOSES ONLY AND NOT INTENDED TO CONSTITUTE PROFESSIONAL ADVICE OR WARRANTY OUTSIDE THE REALM OF REAL ESTATE BROKERAGE. MAPS CREATED FOR REFERENCE PURPOSE ONLY. WHILE THIS INFORMATION IS BELIEVED TO BE CORRECT, IT IS REPRESENTED SUBJECT TO ERRORS, OMISSIONS, CHANGES OR WITHDRAWAL WITHOUT NOTICE. BASED ON DATA SOURCED FROM THE COMBINED LOS ANGELES WESTSIDE MULTIPLE LISTING SERVICE AND PUBLIC RECORDS. STATISTICS ARE SUBJECT TO CHANGE DUE TO INDIVIDUAL REAL ESTATE COMPANY REPORTING DISCIPLINES. BUYER ADVANTAGE OR SELLER ADVANTAGE IS STRICTLY OF THE OPINION OF LEHOA GACKI AND ACCURACY CANNOT BE GUARANTEED AND MAY NOT REFLECT ALL REAL ESTATE ACTIVITY ON THE MARKET. ALL PROPERTY INFORMATION, INCLUDING, BUT NOT LIMITED TO MAPS, GRAPHS, DEPICTIONS, SQUARE FOOTAGE, ROOM COUNT, NUMBER OF BEDROOMS AND THE SCHOOL DISTRICT IN PROPERTY LISTINGS SHOULD BE VERIFIED BY YOUR OWN ATTORNEY, ARCHITECT OR ZONING EXPERT. NEW CONSTRUCTION COUNT, SQUARE FOOTAGE AND YEAR BUILT IS BASED ON INDIVIDUAL REAL ESTATE COMPANY REPORTING AND MAY BE DIFFERENT THAN PUBLIC RECORDS. NEW CONSTRUCTION COUNT IS BASED ON LISTING BROKERAGE LISTING YEAR. THE BROKER/AGENT PROVIDING THE INFORMATION CONTAINED HEREIN MAY OR MAY HAVE NOT BEEN THE LISTING AND/OR SELLING AGENT. THIS IS NOT INTENDED TO SOLICIT PROPERTY ALREADY LISTED. EQUAL HOUSING OPPORTUNITY.
PUBLIC RECORDS, COMBINED
ANGELES
LISTING SERVICE AND
TIMES
CULVER CITY
$1,199,500 $1,260,000 $1,404,875 $1,570,000 $1,375,500 $1,525,000 $1,689,500 $1,825,150 $1,699,500 $1,761,000 $2,039,500 $2,212,500
$500,000 $1,000,000 $1,500,000 $2,000,000 $2,500,000
TREND
NEIGHBORHOOD BOUNDARY SOURCE:
LOS
WESTSIDE MULTIPLE
LOS ANGELES
MAPPING L.A. https://maps.latimes.com/neighborhoods/index.html
CULVER CITY
21 25 15 15 14 11 11 135 10 15 20 25 30 Jan 01 to Jun 30, 2019 Jul 01 to Dec 31, 2019 Jan 01 to Jun 30, 2020 Jul 01 to Dec
88 97 55 96 120
72 75
END OF CULVER CITY 6 PAGE REPORT
$884 $863 $898 $868 $994 $1,054 $1,130 $1,078 $912 $898 $964 $896 $1,018 $1,066 $1,159 $1,080 $$200 $400 $600 $800 $1,000 $1,200 $1,400 Jan 01 to Jun 30, 2019 Jul 01 to Dec 31, 2019 Jan 01 to Jun 30, 2020 Jul 01 to Dec 31, 2020 Jan 01 to Jun 30, 2021 Jul 01 to Dec 31, 2021 Jan 01 to Jun 30, 2022 Jul 01 to Dec 31, 2022 Median Price Per Square Foot Average Price per SquareFt
31, 2020 Jan 01 to Jun 30, 2021 Jul 01 to Dec 31, 2021 Jan 01 to Jun 30, 2022 Jul 01 to Dec 31, 2022 Number of Homes Sold
106
Days on Market before Sold
SOLD HOME PRICE PER SQUARE FOOT - PRE & POST MAR 2020 PANDEMIC CULVER CITY DAYS ON MARKET BEFORE SOLD- PRE & POST MAR 2020 PANDEMIC
WHAT YOUR MONEY BUYS YOU THIS MONTH: Del Rey Home Analysis from: December 01, 2022 to December 31, 2022 8 Sold Sold Price **Overbid/ Underbid Square Feet Price per/SqFt YB LotSqFt BD BA Days on Market Actual Lowest Sold $1,550,000 97 1,899 $816 1952 6,247 5 2 18 Mid-Low* $1,571,500 96 1,393 $950 1941 5,095 3 2 6 Typical Home Price (Median)* $1,870,000 100 1,769 $1,044 1952 5,861 4 3 11 Mid-High* $2,041,250 103 1,969 $1,181 1958 6,690 4 3 17 Actual Highest Sold $2,395,900 100 2,554 $938 1989 4,994 4 3 0 Average $1,860,863 100 1,770 $1,079 1953 5,890 4 3 11 **Overbid/Underbid: 100 is list price paid. Under 100 means sold for less than asking, over 100 sold probably in multiples and over asking. Note: Square Footage calculation could be more or less (+-) 20% difference. (Based on calculation.) * Middle Range Variance $469,750 Middle Range Variance is future range Typical Home Price (Median) Price will vary by. Never more, Never less. Source: TheMLS/CLAW (Combined Los Angeles Westside) Single Family Homes December 2022 $1,870,000 TYPICAL HOME PRICE (MEDIAN) $1,044 SOLD PRICE PER SQUARE FOOT 11 DAYS ON MARKET BEFORE SOLD (DOM) $1,571,500 MID-LOW $2,041,250 MID-HIGH NEIGHBORING AREAS: Area Typical Home Price( Median) Price per/SqFt Days on Market Mid-Low Mid-High Marina Del Rey $2,700,000 $891 22 Venice $2,162,500 $1,375 27 $1,555,000 $3,487,500 Mar Vista $2,610,578 $1,162 14 $1,607,500 $3,731,250 Culver City $1,870,000 $1,044 11 $1,571,500 $2,041,250 Playa Vista $1,910,000 $845 6 $1,125,000 $2,653,250 For questions, comments, a tailor-made report for your home area, or a complimentary home valuation please contact LeHoa Gacki LeHoa Gacki Douglas Elliman Real Estate DRE #01422855 Lehoa.Gacki@elliman.com www.LeHoaGacki.com 424.276.7587 LeHoa’s Neighborhood Data Charts Los Angeles Real Estate L.N.D.C. DECEMBER 2022 Del Rey A neighborhood in the City of Los Angeles DEL REY
Venice
Mar Vista Culver City
Marina Del Rey
Playa Vista
Buyer or Seller Advantage by Price Point for Del Rey as of December 31, 2022
Months supply of Inventory =
4-6 = BALANCED MARKET
Based on last 3 months of homes sales, Del Rey has 2.6 months supply of inventory.
HOME PRICE RANGE
$6,000,000 $10,000,000 $5,000,000 $5,999,999 $4,450,000 $4,999,999 $4,300,000 $4,449,999 $4,150,000 $4,299,999 $4,000,000 $4,149,999 $3,850,000 $3,999,999 $3,700,000 $3,849,999 $3,550,000 $3,699,999 $3,400,000 $3,549,999 $3,250,000 $3,399,999 $3,100,000 $3,249,999
3 and under FAVORS SELLER 7 and over FAVORS BUYER
BUYER ADVANTAGE
$2,950,000 $3,099,999 $2,800,000 $2,949,999
BUYER ADVANTAGE $2,650,000 $2,799,999 $2,500,000 $2,649,999
SELLER ADVANTAGE
SELLER ADVANTAGE $2,350,000 $2,499,999
BUYER ADVANTAGE
SELLER ADVANTAGE $2,200,000 $2,349,999 $2,050,000 $2,199,999
SELLER
ADVANTAGE
$1,900,000 $2,049,999
SELLER ADVANTAGE
SELLER ADVANTAGE $1,750,000 $1,899,999
$1,600,000 $1,749,999
SELLER ADVANTAGE $1,450,000 $1,599,999
SELLER ADVANTAGE $1,300,000 $1,449,999 $1,150,000 $1,299,999
$1,000,000 $1,149,999 $750,000 $999,999 $500,000 $749,999
SELLER
ADVANTAGE
Del Rey Inventory for New Construction and Resale of Homes as
SELLER
For Sale
Source: TheMLS/CLAW (Combined Los Angeles Westside)
Under Contract Pending - Closing Soon
New Construction New Con DOM Resale Resale DOM Home Price Range Homes Resold
1 5 3 19 18 77 11
$500,000 $749,999 $750,000 $999,999 4 64 $1,000,000 $1,149,999 1 3 2 61 $1,150,000 $1,299,999 1 1 4 34 $1,300,000 $1,449,999 2 3 158 $1,450,000 $1,599,999 1
1 3 113 $1,600,000 $1,749,999 2 1 31 $1,750,000 $1,899,999 2
1 27 $1,900,000 $2,049,999 1 $2,050,000 $2,199,999 1 $2,200,000 $2,349,999 1 18 $2,350,000 $2,499,999 $2,500,000 $2,649,999 1 12 $2,650,000 $2,799,999 1 $2,800,000 $2,949,999 1 18 $2,950,000 $3,099,999 $3,100,000 $3,249,999 $3,250,000 $3,399,999 $3,400,000 $3,549,999 $3,550,000 $3,699,999 $3,700,000 $3,849,999 $3,850,000 $3,999,999
$4,000,000 $4,149,999
$4,150,000 $4,299,999 $4,300,000 $4,449,999 $4,450,000 $4,999,999 $5,000,000 $5,999,999 $6,000,000 $10,000,000
ADVANTAGE SUPPLY & DEMAND
REALTORS
of December 31, 2022
BUYER
DEMAND
/ INVESTOR ADVANTAGE
Sold
October November December Resold DOM New Cons New DOM Homes Resold Resold DOM New Cons New DOM Homes Resold Resold DOM New Cons New DOM 26 5 31 8 11 12 34 33 17 2 4 3 11 51 18 1 6 1 13 8 2 10 13 1 79 1 25 1 0 1 62 REALTORS DIGEST
Based on last 3 months of homes sales, Bel-Air has 7.9 months supply of inventory. Sold Homes Days on Market Before
= DOM
Jan 01, 2019 to Dec 31, 2019 Jan 01, 2020 to Dec 31, 2020 Jan 01, 2021 to Dec 31, 2021 Jan 01, 2022 to Dec 31, 2022 Mid-Low Typical Home Price-Median Mid-High 4 YEAR TREND For questions, comments, a tailor-made report for your home area, or a complimentary home valuation please contact LeHoa Gacki LeHoa Gacki, DRE #01422855 Douglas Elliman Real Estate 11990 San Vicente Blvd., #100, L.A., Ca 90049 Email: Lehoa.Gacki@elliman.com Tel | Fax: (424) 276-7587 www.Lehoagacki.com | Lehoagacki.elliman.com 4 YEAR OBSERVATION Del Rey Number of Homes Sold: 134 124 166 116 Jan 01, 2019 to Dec 31, 2019 Jan 01, 2020 to Dec 31, 2020 Jan 01, 2021 to Dec 31, 2021 Jan 01, 2022 to Dec 31, 2022 Actual Lowest Sold $570,000 $770,000 $780,000 $700,000 Mid-Low $1,073,750 $1,116,250 $1,236,500 $1,307,750 Typical Home Price-Median $1,285,000 $1,357,000 $1,431,000 $1,545,000 Mid-High $1,550,000 $1,670,500 $1,850,000 $1,775,000 Actual Highest Sold $3,165,000 $2,750,000 $3,199,350 $3,750,000 Average Price Sold $1,362,763 $1,456,957 $1,596,022 $1,604,248 12 MONTH OBSERVATION Del Rey Cumulative 12 months sold home analysis from: January 01, 2022 to December 31, 2022 116 Sold Sold Price **Overbid / Underbid Square Feet Price per/SqFt YB LotSqFt BD BA Days on Market Actual Lowest Sold $700,000 100 896 $781 1948 4,367 2 1 0 Mid-Low* $1,307,750 98 1,156 $847 1947 4,440 3 2 8 Typical Home Price-Median* $1,545,000 100 1,485 $1,033 1951 5,004 3 2 13 Mid-High* $1,775,000 107 1,948 $1,190 1960 5,707 4 3 26 Actual Highest Sold $3,750,000 112 3,573 $1,050 2017 6,608 5 6 7 Average $1,604,248 103 1,624 $1,056 1960 5,120 3 2 22 **Overbid / Underbid: 100 is list price paid. Under 100 means sold for less than asking, over 100 sold probably in multiples and over asking. Note: Square Footage calculation could be more or less (+-) 20% difference. (Based on calculation.) * Middle Range Variance $467,250 Middle Range Variance is future range Typical Home Price (Median) Price will vary by. Never more, Never less. Source: TheMLS/CLAW (Combined Los Angeles Westside) © 2022 LEHOA GACKI. DRE# 01422855. ALL WORLDWIDE RIGHTS RESERVED. DOUGLAS ELLIMAN REAL ESTATE. 150 EL CAMINO DRIVE, BEVERLY HILLS, CA 90212. 310.595.3888. ALL MATERIAL PRESENTED HEREIN IS INTENDED FOR INFORMATION PURPOSES ONLY AND NOT INTENDED TO CONSTITUTE PROFESSIONAL ADVICE OR WARRANTY OUTSIDE THE REALM OF REAL ESTATE BROKERAGE. MAPS CREATED FOR REFERENCE PURPOSE ONLY. WHILE THIS INFORMATION IS BELIEVED TO BE CORRECT, IT IS REPRESENTED SUBJECT TO ERRORS, OMISSIONS, CHANGES OR WITHDRAWAL WITHOUT NOTICE. BASED ON DATA SOURCED FROM THE COMBINED LOS ANGELES WESTSIDE MULTIPLE LISTING SERVICE AND PUBLIC RECORDS. STATISTICS ARE SUBJECT TO CHANGE DUE TO INDIVIDUAL REAL ESTATE COMPANY REPORTING DISCIPLINES. BUYER ADVANTAGE OR SELLER ADVANTAGE IS STRICTLY OF THE OPINION OF LEHOA GACKI AND ACCURACY CANNOT BE GUARANTEED AND MAY NOT REFLECT ALL REAL ESTATE ACTIVITY ON THE MARKET. ALL PROPERTY INFORMATION, INCLUDING, BUT NOT LIMITED TO MAPS, GRAPHS, DEPICTIONS, SQUARE FOOTAGE, ROOM COUNT, NUMBER OF BEDROOMS AND THE SCHOOL DISTRICT IN PROPERTY LISTINGS SHOULD BE VERIFIED BY YOUR OWN ATTORNEY, ARCHITECT OR ZONING EXPERT. NEW CONSTRUCTION COUNT, SQUARE FOOTAGE AND YEAR BUILT IS BASED ON INDIVIDUAL REAL ESTATE COMPANY REPORTING AND MAY BE DIFFERENT THAN PUBLIC RECORDS. NEW CONSTRUCTION COUNT IS BASED ON LISTING BROKERAGE LISTING YEAR. THE BROKER/AGENT PROVIDING THE INFORMATION CONTAINED HEREIN MAY OR MAY HAVE NOT BEEN THE LISTING
SELLING AGENT. THIS IS NOT
TO SOLICIT PROPERTY
LISTED. EQUAL
COMBINED
LISTING SERVICE
DEL REY
$1,073,750 $1,116,250 $1,236,500 $1,307,750 $1,285,000 $1,357,000 $1,431,000 $1,545,000 $1,550,000 $1,670,500 $1,850,000 $1,775,000 $$200,000 $400,000 $600,000 $800,000 $1,000,000 $1,200,000 $1,400,000 $1,600,000 $1,800,000 $2,000,000
AND/OR
INTENDED
ALREADY
HOUSING OPPORTUNITY. NEIGHBORHOOD BOUNDARY SOURCE: PUBLIC RECORDS,
LOS ANGELES WESTSIDE MULTIPLE
AND LOS ANGELES TIMES MAPPING L.A. https://maps.latimes.com/neighborhoods/index.html
$-
Jan 01 to Jun 30, 2019 Jul 01 to Dec 31, 2019 Jan 01 to Jun 30, 2020 Jul 01 to Dec 31,
Jan 01 to Jun
Jul 01 to Dec 31,
Jun
Jul
Price Per Square Foot Average Price per SquareFt 42 23 18 17 13 14 12 145 10 15 20 25 30 35 40 45 Jan 01 to Jun 30, 2019 Jul 01 to Dec 31, 2019 Jan 01 to Jun 30, 2020 Jul 01 to Dec 31, 2020 Jan 01 to Jun 30, 2021 Jul 01 to Dec 31, 2021 Jan 01 to Jun 30, 2022 Jul 01 to Dec 31, 2022 Number of Homes Sold 62 72 39 85 77 89 61 55 Days on Market before Sold END OF DEL REY 6 PAGE REPORT SOLD HOME PRICE PER SQUARE FOOT - PRE & POST MAR 2020 PANDEMIC DEL REY DAYS ON MARKET BEFORE SOLD- PRE & POST MAR 2020 PANDEMIC DEL REY
$842 $876 $806 $877 $962 $986 $1,040 $1,015 $878 $893 $850 $1,072 $998 $1,004 $1,074 $1,036
$200 $400 $600 $800 $1,000 $1,200
2020
30, 2021
2021 Jan 01 to
30, 2022
01 to Dec 31, 2022 Median
Single Family Homes December 2022 $1,680,000 TYPICAL HOME PRICE (MEDIAN) $673 SOLD PRICE PER SQUARE FOOT 12 DAYS ON MARKET BEFORE SOLD (DOM) NEIGHBORING AREAS: Area Typical Home Price (Median) Price per/SqFt Days on Market Mid-Low Mid-High Culver City $1,870,000 $1,044 11 $1,571,500 $2,041,250 Park Hills Heights $1,005,000 $613 24 $742,475 $1,355,000 Inglewood $735,000 $645 45 $583,750 $952,475 Westchester $1,435,600 $803 30 $1,130,000 $1,884,963 For questions, comments, a tailor-made report for your home area, or a complimentary home valuation please contact LeHoa Gacki LeHoa Gacki Douglas Elliman Real Estate DRE #01422855 Lehoa.Gacki@elliman.com www.LeHoaGacki.com 424.276.7587 LeHoa’s Neighborhood Data Charts Los Angeles Real Estate L.N.D.C. DECEMBER 2022 Ladera Heights An unincorporated area in Los Angeles County LADERA HEIGHTS Culver City Baldwin Hills/ Crenshaw Inglewood View parkWindsor Hills Westchester WHAT YOUR MONEY BUYS YOU THIS MONTH: No Homes Sold in Ladera Heights in the month of December
Buyer or Seller Advantage by Price Point for Ladera Heights as of December 31, 2022
Months supply of Inventory =
Based on last 3 months of homes sales, Ladera Heights has 2.5 months supply of inventory.
HOME PRICE RANGE
$6,000,000 $10,000,000 $5,000,000 $5,999,999 $4,450,000 $4,999,999 $4,300,000 $4,449,999 $4,150,000 $4,299,999 $4,000,000 $4,149,999 $3,850,000 $3,999,999 $3,700,000 $3,849,999 $3,550,000 $3,699,999 $3,400,000 $3,549,999 $3,250,000 $3,399,999 $3,100,000 $3,249,999 $2,950,000 $3,099,999 $2,800,000 $2,949,999
4-6 = BALANCED MARKET 3 and under FAVORS SELLER 7 and over FAVORS BUYER
SELLER ADVANTAGE $2,650,000 $2,799,999
BUYER ADVANTAGE $2,500,000 $2,649,999 $2,350,000 $2,499,999 $2,200,000 $2,349,999 $2,050,000 $2,199,999
BUYER ADVANTAGE
$1,900,000 $2,049,999 $1,750,000 $1,899,999
SELLER ADVANTAGE $1,600,000 $1,749,999
SELLER ADVANTAGE $1,450,000 $1,599,999
SELLER ADVANTAGE $1,300,000 $1,449,999
SELLER ADVANTAGE $1,150,000 $1,299,999 $1,000,000 $1,149,999
SELLER ADVANTAGE $750,000 $999,999 SELLER ADVANTAGE $500,000 $749,999
Ladera Heights Inventory for New Construction and Resale of Homes
SELLER ADVANTAGE SUPPLY & DEMAND
For Sale
Source: TheMLS/CLAW (Combined Los Angeles Westside)
Under Contract Pending - Closing Soon
New Construction New Con DOM Resale Resale DOM Home Price Range Homes Resold
1 2 9 27 8
$500,000 $749,999 1 $750,000 $999,999 1 $1,000,000 $1,149,999 $1,150,000 $1,299,999
1 1 3 $1,300,000 $1,449,999 1 1 33 $1,450,000 $1,599,999 3 1 6 $1,600,000 $1,749,999 2 1 45 $1,750,000 $1,899,999 1 1 17 $1,900,000 $2,049,999 2 31 $2,050,000 $2,199,999 1 $2,200,000 $2,349,999 $2,350,000 $2,499,999 2 39 $2,500,000 $2,649,999
$2,650,000 $2,799,999 $2,800,000 $2,949,999 $2,950,000 $3,099,999 $3,100,000 $3,249,999
$3,250,000 $3,399,999 $3,400,000 $3,549,999
$3,550,000 $3,699,999 $3,700,000 $3,849,999 $3,850,000 $3,999,999
$4,000,000 $4,149,999
$4,150,000 $4,299,999
$4,300,000 $4,449,999 $4,450,000 $4,999,999 $5,000,000 $5,999,999 $6,000,000 $10,000,000
REALTORS
Homes as of December 31, 2022
BUYER
INVESTOR
DEMAND
/
ADVANTAGE
Sold Homes Days on Market Before Sold
DOM October November December Resold DOM New Cons New DOM Homes Resold Resold DOM New Cons New DOM Homes Resold Resold DOM New Cons New DOM 48 3 16 1 0 15 32 20 141 1 30 90 1 17 REALTORS DIGEST
Based on last 3 months of homes sales, Bel-Air has 7.9 months supply of inventory.
=
$-
Jan 01, 2019 to Dec 31, 2019 Jan 01, 2020 to Dec 31, 2020 Jan 01, 2021 to Dec 31, 2021 Jan 01, 2022 to Dec 31, 2022 Mid-Low Typical Home Price-Median Mid-High 4 YEAR
For questions, comments, a tailor-made report for your home area, or a complimentary home valuation please contact LeHoa Gacki LeHoa Gacki, DRE #01422855 Douglas Elliman Real Estate 11990 San Vicente Blvd., #100, L.A., Ca 90049 Email: Lehoa.Gacki@elliman.com Tel | Fax: (424) 276-7587 www.Lehoagacki.com | Lehoagacki.elliman.com 4 YEAR OBSERVATION Ladera Heights Number of Homes Sold: 49 38 68 49 Jan 01, 2019 to Dec 31, 2019 Jan 01, 2020 to Dec 31, 2020 Jan 01, 2021 to Dec 31, 2021 Jan 01, 2022 to Dec 31, 2022 Actual Lowest Sold $835,000 $875,000 $925,000 $850,000 Mid-Low $1,152,500 $1,186,250 $1,433,750 $1,425,000 Typical Home Price-Median $1,390,000 $1,475,000 $1,622,500 $1,680,000 Mid-High $1,562,500 $1,684,500 $1,800,000 $2,175,000 Actual Highest Sold $2,800,000 $2,185,000 $2,850,333 $3,300,000 Average Price Sold $1,390,531 $1,486,895 $1,633,487 $1,809,842 12 MONTH OBSERVATION Ladera Heights Cumulative 12 months sold home analysis from: January 01, 2022 to December 31, 2022 49 Sold Sold Price **Overbid / Underbid Square Feet Price per/SqFt YB LotSqFt BD BA Days on Market Actual Lowest Sold $850,000 89 1,449 $587 1951 7,299 3 2 47 Mid-Low* $1,425,000 98 1,872 $614 1953 7,503 3 3 8 Typical Home Price-Median* $1,680,000 103 2,462 $673 1957 8,977 4 3 12 Mid-High* $2,175,000 112 3,325 $788 1963 9,880 4 4 23 Actual Highest Sold $3,300,000 114 4,480 $737 1997 7,636 6 5 11 Average $1,809,842 104 2,641 $704 1960 8,868 4 3 22 **Overbid / Underbid: 100 is list price paid. Under 100 means sold for less than asking, over 100 sold probably in multiples and over asking. Note: Square Footage calculation could be more or less (+-) 20% difference. (Based on calculation.) * Middle Range Variance $750,000 Middle Range Variance is future range Typical Home Price (Median) Price will vary by. Never more, Never less. Source: TheMLS/CLAW (Combined Los Angeles Westside) © 2022 LEHOA GACKI. DRE# 01422855. ALL WORLDWIDE RIGHTS RESERVED. DOUGLAS ELLIMAN REAL ESTATE. 150 EL CAMINO DRIVE, BEVERLY HILLS, CA 90212. 310.595.3888. ALL MATERIAL PRESENTED HEREIN IS INTENDED FOR INFORMATION PURPOSES ONLY AND NOT INTENDED TO CONSTITUTE PROFESSIONAL ADVICE OR WARRANTY OUTSIDE THE REALM OF REAL ESTATE BROKERAGE. MAPS CREATED FOR REFERENCE PURPOSE ONLY. WHILE THIS INFORMATION IS BELIEVED TO BE CORRECT, IT IS REPRESENTED SUBJECT TO ERRORS, OMISSIONS, CHANGES OR WITHDRAWAL WITHOUT NOTICE. BASED ON DATA SOURCED FROM THE COMBINED LOS ANGELES WESTSIDE MULTIPLE LISTING SERVICE AND PUBLIC RECORDS. STATISTICS ARE SUBJECT TO CHANGE DUE TO INDIVIDUAL REAL ESTATE COMPANY REPORTING DISCIPLINES. BUYER ADVANTAGE OR SELLER ADVANTAGE IS STRICTLY OF THE OPINION OF LEHOA GACKI AND ACCURACY CANNOT BE GUARANTEED AND MAY NOT REFLECT ALL REAL ESTATE ACTIVITY ON THE MARKET. ALL PROPERTY INFORMATION, INCLUDING, BUT NOT LIMITED TO MAPS, GRAPHS, DEPICTIONS, SQUARE FOOTAGE, ROOM COUNT, NUMBER OF BEDROOMS AND THE SCHOOL DISTRICT IN PROPERTY LISTINGS SHOULD BE VERIFIED BY YOUR OWN ATTORNEY, ARCHITECT OR ZONING EXPERT. NEW CONSTRUCTION COUNT, SQUARE FOOTAGE AND YEAR BUILT IS BASED ON INDIVIDUAL REAL ESTATE COMPANY REPORTING AND MAY BE DIFFERENT THAN PUBLIC RECORDS. NEW CONSTRUCTION COUNT IS BASED ON LISTING BROKERAGE LISTING YEAR. THE BROKER/AGENT PROVIDING THE INFORMATION CONTAINED HEREIN MAY OR MAY HAVE NOT BEEN THE LISTING AND/OR SELLING AGENT. THIS IS NOT INTENDED TO SOLICIT PROPERTY ALREADY LISTED. EQUAL HOUSING OPPORTUNITY. NEIGHBORHOOD BOUNDARY SOURCE: PUBLIC RECORDS, COMBINED LOS ANGELES WESTSIDE MULTIPLE LISTING SERVICE AND LOS ANGELES TIMES MAPPING L.A. https://maps.latimes.com/neighborhoods/index.html LADERA HEIGHTS
$1,152,500 $1,186,250 $1,433,750 $1,425,000 $1,390,000 $1,475,000 $1,622,500 $1,680,000 $1,562,500 $1,684,500 $1,800,000 $2,175,000
$500,000 $1,000,000 $1,500,000 $2,000,000 $2,500,000
TREND
$493 $497 $539 $594
$503 $516 $546 $574
$$100 $200 $300 $400 $500 $600 $700 $800 Jan 01 to Jun 30, 2019 Jul 01 to Dec 31, 2019 Jan 01 to Jun 30, 2020 Jul 01 to Dec 31, 2020 Jan 01 to Jun 30, 2021 Jul 01 to Dec 31, 2021 Jan 01 to Jun 30,
Jul 01 to Dec 31, 2022 Median Price Per Square Foot Average Price per SquareFt 32 34 30 12 13 15 11 165 10 15 20 25 30 35 40 Jan 01 to Jun 30, 2019 Jul 01 to Dec 31, 2019 Jan 01 to Jun 30, 2020 Jul 01 to Dec 31, 2020 Jan 01 to Jun 30, 2021 Jul 01 to Dec 31, 2021 Jan 01 to Jun 30, 2022 Jul 01 to Dec 31, 2022 Number of Homes Sold 19 30 18 20 36 32 29 20 Days on Market before Sold END OF LADERA HEIGHTS 6 PAGE REPORT SOLD HOME PRICE PER SQUARE FOOT - PRE & POST MAR 2020 PANDEMIC LADERA HEIGHTS DAYS ON MARKET BEFORE SOLD- PRE & POST MAR 2020 PANDEMIC LADERA HEIGHTS
$586 $615 $702 $636
$593 $612 $725 $673
2022
WHAT YOUR MONEY BUYS YOU THIS MONTH: Mar Vista Home Analysis from: December 01, 2022 to December 31, 2022 14 Sold Sold Price **Overbid/ Underbid Square Feet Price per/SqFt YB LotSqFt BD BA Days on Market Actual Lowest Sold $1,256,000 100 1,045 $1,202 1948 2,501 2 2 14 Mid-Low* $1,607,500 99 1,125 $1,034 1947 5,215 3 2 7 Typical Home Price (Median)* $2,610,578 100 2,374 $1,162 1984 6,001 4 3 14 Mid-High* $3,731,250 102 3,655 $1,253 2022 6,370 5 5 46 Actual Highest Sold $5,775,000 100 4,619 $1,250 2023 7,907 5 6 0 Average $2,847,725 101 2,603 $1,160 1984 5,745 4 4 24 **Overbid/Underbid: 100 is list price paid. Under 100 means sold for less than asking, over 100 sold probably in multiples and over asking. Note: Square Footage calculation could be more or less (+-) 20% difference. (Based on calculation.) * Middle Range Variance $2,123,750 Middle Range Variance is future range Typical Home Price (Median) Price will vary by. Never more, Never less. Source: TheMLS/CLAW (Combined Los Angeles Westside) Single Family Homes December 2022 $2,610,578 TYPICAL HOME PRICE (MEDIAN) $1,162 SOLD PRICE PER SQUARE FOOT 14 DAYS ON MARKET BEFORE SOLD (DOM) $1,607,500 MID-LOW $3,731,250 MID-HIGH NEIGHBORING AREAS: Area Typical Home Price (Median) Price per/SqFt Days on Market Mid-Low Mid-High Venice $2,162,500 $1,375 27 $1,555,000 $3,487,500 Santa Monica $2,997,500 $1,525 16 $2,192,500 $4,200,000 Sawtelle $1,636,000 $824 38 $1,070,000 $1,748,000 Rancho Park $1,655,000 $1,083 12 $1,521,750 $2,115,000 Palms $1,515,000 $951 52 $1,175,000 $2,195,000 Culver City $1,870,000 $1,044 11 $1,571,500 $2,041,250 Del Rey $1,870,000 $1,044 11 $1,571,500 $2,041,250 MAR VISTA Santa Monica Rancho Park Palms Culver City Venice Del Rey Sawtelle LeHoa’s Neighborhood Data Charts Los Angeles Real Estate L.N.D.C. DECEMBER 2022 For questions, comments, a tailor-made report for your home area, or a complimentary home valuation please contact LeHoa Gacki LeHoa Gacki Douglas Elliman Real Estate DRE #01422855 Lehoa.Gacki@elliman.com www.LeHoaGacki.com 424.276.7587 Mar Vista A neighborhood in the City of Los Angeles
Buyer or Seller Advantage by Price Point for Mar Vista as of December 31, 2022
Based on last 3 months of homes sales, Mar Vista has 1.2 months supply of inventory.
HOME PRICE RANGE
$7,000,000 $10,000,000 $5,000,000 $6,999,999 SELLER ADVANTAGE $4,450,000 $4,999,999 $4,300,000 $4,449,999 SELLER ADVANTAGE $4,150,000 $4,299,999 SELLER ADVANTAGE $4,000,000 $4,149,999 $3,850,000 $3,999,999 SELLER ADVANTAGE $3,700,000 $3,849,999 SELLER ADVANTAGE $3,550,000 $3,699,999 SELLER ADVANTAGE $3,400,000 $3,549,999 SELLER ADVANTAGE $3,250,000 $3,399,999 SELLER ADVANTAGE $3,100,000 $3,249,999 SELLER ADVANTAGE
BUYER ADVANTAGE
$2,950,000 $3,099,999 $2,800,000 $2,949,999 SELLER ADVANTAGE
$2,650,000 $2,799,999 SELLER ADVANTAGE $2,500,000 $2,649,999 SELLER ADVANTAGE $2,350,000 $2,499,999 SELLER ADVANTAGE $2,200,000 $2,349,999 SELLER ADVANTAGE $2,050,000 $2,199,999 SELLER ADVANTAGE $1,900,000 $2,049,999 SELLER ADVANTAGE $1,750,000 $1,899,999 SELLER ADVANTAGE
$1,600,000 $1,749,999 SELLER ADVANTAGE $1,450,000 $1,599,999 $1,300,000 $1,449,999 SELLER ADVANTAGE $1,150,000 $1,299,999 SELLER ADVANTAGE $1,000,000 $1,149,999 $750,000 $999,999 SELLER ADVANTAGE $500,000 $749,999
4-6 = BALANCED MARKET 3 and under FAVORS SELLER 7 and over
BUYER
FAVORS
Months supply of Inventory =
Mar Vista Inventory for New Construction and Resale of Homes as
SELLER
For Sale
Source: TheMLS/CLAW (Combined Los Angeles Westside)
Under Contract Pending - Closing Soon
New Construction New Con DOM Resale Resale DOM Home Price Range Homes Resold
7 8 3 45 13 74 9
$500,000 $749,999
1 $750,000 $999,999 $1,000,000 $1,149,999 1 45 $1,150,000 $1,299,999 2 45 $1,300,000 $1,449,999 2 78 $1,450,000 $1,599,999
1 2 $1,600,000 $1,749,999 1 3 2 26 $1,750,000 $1,899,999
1 2 46 $1,900,000 $2,049,999 4
1 1 3 147 $2,050,000 $2,199,999 1 $2,200,000 $2,349,999 1 $2,350,000 $2,499,999 1 1 88 $2,500,000 $2,649,999 2 $2,650,000 $2,799,999 $2,800,000 $2,949,999
1 33 $2,950,000 $3,099,999
1 $3,100,000 $3,249,999
1 17 $3,250,000 $3,399,999
1 $3,400,000 $3,549,999
$3,550,000 $3,699,999 $3,700,000 $3,849,999 1
1 $3,850,000 $3,999,999
$4,000,000 $4,149,999
1 84
$4,150,000 $4,299,999 $4,300,000 $4,449,999 $4,450,000 $4,999,999 $5,000,000 $6,999,999 $7,000,000 $10,000,000
ADVANTAGE SUPPLY & DEMAND
REALTORS
as of December 31, 2022 DEMAND BUYER / INVESTOR ADVANTAGE
Sold Homes Days on Market Before Sold = DOM October November December Resold DOM New Cons New DOM Homes Resold Resold DOM New Cons New DOM Homes Resold Resold DOM New Cons New DOM 23 2 23 13 31 2 53 9 29 5 14 1 14 2 19 1 14 1 6 53 5 12 2 25 1 109 12 18 1 16 55 1 68 21 1 63 1 46 1 4 1 63 1 10 1 26 1 67 1 8 1 103 1 46 1 55 1 0 1 2 1 19 2 4 REALTORS DIGEST
Based on last 3 months of homes sales, Bel-Air has 7.9 months supply of inventory.
Jan 01, 2019 to Dec 31, 2019 Jan 01, 2020 to Dec 31, 2020 Jan 01, 2021 to Dec 31, 2021 Jan 01, 2022 to Dec 31, 2022 Mid-Low Typical Home Price-Median Mid-High 4 YEAR TREND For questions, comments, a tailor-made report for your home area, or a complimentary home valuation please contact LeHoa Gacki LeHoa Gacki, DRE #01422855 Douglas Elliman Real Estate 11990 San Vicente Blvd., #100, L.A., Ca 90049 Email: Lehoa.Gacki@elliman.com Tel | Fax: (424) 276-7587 www.Lehoagacki.com | Lehoagacki.elliman.com 4 YEAR OBSERVATION Mar Vista Number of Homes Sold: 225 203 269 178 Jan 01, 2019 to Dec 31, 2019 Jan 01, 2020 to Dec 31, 2020 Jan 01, 2021 to Dec 31, 2021 Jan 01, 2022 to Dec 31, 2022 Actual Lowest Sold $749,950 $989,000 $820,000 $895,000 Mid-Low $1,389,500 $1,536,333 $1,638,000 $1,682,500 Typical Home Price-Median $1,660,000 $1,860,000 $2,000,000 $2,197,500 Mid-High $2,355,250 $2,495,000 $2,672,500 $2,873,500 Actual Highest Sold $4,995,000 $5,995,000 $5,400,000 $6,500,000 Average Price Sold $1,942,858 $2,096,882 $2,252,723 $2,417,402 12 MONTH OBSERVATION Mar Vista Cumulative 12 months sold home analysis from: January 01, 2022 to December 31, 2022 178 Sold Sold Price **Overbid / Underbid Square Feet Price per/SqFt YB LotSqFt BD BA Days on Market Actual Lowest Sold $895,000 97 642 $1,394 1947 2,473 1 1 52 Mid-Low* $1,682,500 99 1,353 $983 1947 5,437 3 2 7 Typical Home Price-Median* $2,197,500 102 1,852 $1,129 1949 5,949 3 3 12 Mid-High* $2,873,500 109 2,692 $1,272 1962 6,859 4 4 22 Actual Highest Sold $6,500,000 100 - $0 2022 11,341 7 8 19 Average $2,417,402 104 2,142 $1,163 1963 6,301 3 3 20 **Overbid / Underbid: 100 is list price paid. Under 100 means sold for less than asking, over 100 sold probably in multiples and over asking. Note: Square Footage calculation could be more or less (+-) 20% difference. (Based on calculation.) * Middle Range Variance $1,191,000 Middle Range Variance is future range Typical Home Price (Median) Price will vary by. Never more, Never less. Source: TheMLS/CLAW (Combined Los Angeles Westside) © 2022 LEHOA GACKI. DRE# 01422855. ALL WORLDWIDE RIGHTS RESERVED. DOUGLAS ELLIMAN REAL ESTATE. 150 EL CAMINO DRIVE, BEVERLY HILLS, CA 90212. 310.595.3888. ALL MATERIAL PRESENTED HEREIN IS INTENDED FOR INFORMATION PURPOSES ONLY AND NOT INTENDED TO CONSTITUTE PROFESSIONAL ADVICE OR WARRANTY OUTSIDE THE REALM OF REAL ESTATE BROKERAGE. MAPS CREATED FOR REFERENCE PURPOSE ONLY. WHILE THIS INFORMATION IS BELIEVED TO BE CORRECT, IT IS REPRESENTED SUBJECT TO ERRORS, OMISSIONS, CHANGES OR WITHDRAWAL WITHOUT NOTICE. BASED ON DATA SOURCED FROM THE COMBINED LOS ANGELES WESTSIDE MULTIPLE LISTING SERVICE AND PUBLIC RECORDS. STATISTICS ARE SUBJECT TO CHANGE DUE TO INDIVIDUAL REAL ESTATE COMPANY REPORTING DISCIPLINES. BUYER ADVANTAGE OR SELLER ADVANTAGE IS STRICTLY OF THE OPINION OF LEHOA GACKI AND ACCURACY CANNOT BE GUARANTEED AND MAY NOT REFLECT ALL REAL ESTATE ACTIVITY ON THE MARKET. ALL PROPERTY INFORMATION, INCLUDING, BUT NOT LIMITED TO MAPS, GRAPHS, DEPICTIONS, SQUARE FOOTAGE, ROOM COUNT, NUMBER OF BEDROOMS AND THE SCHOOL DISTRICT IN PROPERTY LISTINGS SHOULD BE VERIFIED BY YOUR OWN ATTORNEY, ARCHITECT OR ZONING EXPERT. NEW CONSTRUCTION COUNT, SQUARE FOOTAGE AND YEAR BUILT IS BASED ON INDIVIDUAL REAL ESTATE COMPANY REPORTING AND MAY BE DIFFERENT THAN PUBLIC RECORDS. NEW CONSTRUCTION COUNT IS BASED ON LISTING BROKERAGE LISTING YEAR. THE BROKER/AGENT PROVIDING THE INFORMATION CONTAINED HEREIN MAY OR MAY HAVE NOT BEEN THE LISTING AND/OR SELLING AGENT. THIS IS NOT INTENDED TO SOLICIT PROPERTY ALREADY LISTED. EQUAL HOUSING OPPORTUNITY.
PUBLIC RECORDS, COMBINED
LISTING SERVICE AND
TIMES
MAR VISTA
$1,389,500 $1,536,333 $1,638,000 $1,682,500 $1,660,000 $1,860,000 $2,000,000 $2,197,500 $2,355,250 $2,495,000 $2,672,500 $2,873,500 $$500,000 $1,000,000 $1,500,000 $2,000,000 $2,500,000 $3,000,000 $3,500,000
NEIGHBORHOOD BOUNDARY SOURCE:
LOS ANGELES WESTSIDE MULTIPLE
LOS ANGELES
MAPPING L.A. https://maps.latimes.com/neighborhoods/index.html
Jan
Jul
31 19 8 15 15 12 10 165 10 15 20 25 30 35 Jan 01 to Jun 30, 2019 Jul 01 to Dec 31, 2019 Jan 01 to Jun 30, 2020 Jul 01 to Dec 31, 2020 Jan 01 to Jun 30, 2021 Jul 01 to Dec 31, 2021 Jan 01 to Jun 30,
Jul 01 to Dec 31,
Number of Homes Sold 111 114 75 128 119 150 95 83 Days
Sold END OF MAR VISTA 6 PAGE REPORT SOLD HOME PRICE PER SQUARE FOOT
& POST MAR 2020
MAR
DAYS ON MARKET
SOLD-
MAR
$863 $904 $945 $952 $983 $1,062 $1,138 $1,123 $903 $933 $972 $998 $1,038 $1,070 $1,168 $1,157 $$200 $400 $600 $800 $1,000 $1,200 $1,400
01 to Jun 30, 2019
01 to Dec 31, 2019 Jan 01 to Jun 30, 2020 Jul 01 to Dec 31, 2020 Jan 01 to Jun 30, 2021 Jul 01 to Dec 31, 2021 Jan 01 to Jun 30, 2022 Jul 01 to Dec 31, 2022 Median Price Per Square Foot Average Price per SquareFt
2022
2022
on Market before
- PRE
PANDEMIC
VISTA
BEFORE
PRE & POST MAR 2020 PANDEMIC
VISTA
WHAT YOUR MONEY BUYS YOU THIS MONTH: Pacific Palisades Home Analysis from: December 01, 2022 to December 31, 2022 16 Sold Sold Price **Overbid/ Underbid Square Feet Price per/SqFt YB LotSqFt BD BA Days on Market Actual Lowest Sold $1,787,500 94 1,006 $1,777 1951 2,879 2 2 40 Mid-Low* $2,933,750 91 2,318 $1,163 1951 8,080 3 3 15 Typical Home Price (Median)* $3,917,500 96 2,986 $1,312 1960 11,874 4 3 31 Mid-High* $5,712,500 100 4,537 $1,636 1965 18,459 5 5 65 Actual Highest Sold $11,500,000 89 4,423 $2,600 2002 12,138 5 5 17 Average $4,558,969 99 3,258 $1,407 1961 12,976 4 4 49 **Overbid/Underbid: 100 is list price paid. Under 100 means sold for less than asking, over 100 sold probably in multiples and over asking. Note: Square Footage calculation could be more or less (+-) 20% difference. (Based on calculation.) * Middle Range Variance $2,778,750 Middle Range Variance is future range Typical Home Price (Median) Price will vary by. Never more, Never less. Source: TheMLS/CLAW (Combined Los Angeles Westside) Single Family Homes December 2022 $3,917,500 TYPICAL HOME PRICE (MEDIAN) $1,312 SOLD PRICE PER SQUARE FOOT 31 DAYS ON MARKET BEFORE SOLD (DOM) $2,933,750 MID-LOW $5,712,500 MID-HIGH NEIGHBORING AREAS: Area Typical Home Price (Median) Price per/SqFt Days on Market Mid-Low Mid-High Malibu $2,550,000 $1,107 $69 $1,581,250 $10,825,000 Topanga $2,389,505 $1,043 $18 $1,778,750 $4,793,781 Brentwood $4,449,512 $1,383 $18 $2,550,000 $8,525,000 Santa Monica $2,997,500 $1,525 $16 $2,192,500 $4,200,000 For questions, comments, a tailor-made report for your home area, or a complimentary home valuation please contact LeHoa Gacki LeHoa Gacki Douglas Elliman Real Estate DRE #01422855 Lehoa.Gacki@elliman.com www.LeHoaGacki.com 424.276.7587 LeHoa’s Neighborhood Data Charts Los Angeles Real Estate L.N.D.C. DECEMBER 2022 Pacific Palisades A neighborhood in the City of Los Angeles PACIFIC PALISADES Brentwood Topanga Santa Monica Malibu
Buyer or Seller Advantage by Price Point for Pacific Palisades as of December 31, 2022
Based on last 3 months of homes sales, Pacific Palisades has 2.5 months supply of inventory.
HOME PRICE RANGE
$80,000,000 $100,000,000 $70,000,000 $79,999,999 $60,000,000 $69,999,999
BUYER ADVANTAGE $50,000,000 $59,999,999
BUYER ADVANTAGE $40,000,000 $49,999,999 $30,000,000 $39,999,999
BUYER ADVANTAGE $25,000,000 $29,999,999
BUYER ADVANTAGE $20,000,000 $24,999,999
$17,500,000 $19,999,999 $15,000,000 $17,499,999 SELLER ADVANTAGE
BUYER ADVANTAGE $13,500,000 $14,999,999 $12,000,000 $13,499,999
BUYER ADVANTAGE $10,000,000 $11,999,999 $9,000,000 $9,999,999
SELLER ADVANTAGE $8,000,000 $8,999,999
SELLER ADVANTAGE
SELLER ADVANTAGE $6,500,000 $6,999,999 $6,000,000 $6,499,999 SELLER ADVANTAGE $5,500,000 $5,999,999 $5,000,000 $5,499,999
$7,000,000 $7,999,999
SELLER ADVANTAGE
SELLER ADVANTAGE $4,500,000 $4,999,999
$4,000,000 $4,499,999
SELLER ADVANTAGE $3,500,000 $3,999,999
SELLER ADVANTAGE $3,000,000 $3,499,999
SELLER ADVANTAGE
SELLER ADVANTAGE $2,000,000 $2,499,999
$2,500,000 $2,999,999
SELLER ADVANTAGE $1,500,000 $1,999,999 SELLER ADVANTAGE $1,000,000 $1,499,999
4-6 = BALANCED MARKET 3 and under FAVORS SELLER 7 and over FAVORS BUYER Months supply of Inventory =
Pacific Palisades Inventory for New Construction and Resale of Homes
SELLER
For Sale
Source: TheMLS/CLAW (Combined Los Angeles Westside)
Under Contract Pending - Closing Soon
New Construction New Con DOM Resale Resale DOM Home Price Range Homes Resold
4 4 4 98 37 89 17
$1,000,000 $1,499,999 $1,500,000 $1,999,999 $2,000,000 $2,499,999 1
3 1 5 76 $2,500,000 $2,999,999
1 1 2 31 $3,000,000 $3,499,999 2 2 84 $3,500,000 $3,999,999 2 $4,000,000 $4,499,999 2 2 44 $4,500,000 $4,999,999 2 2 63 $5,000,000 $5,499,999 3 4 79 $5,500,000 $5,999,999 1 1 53 $6,000,000 $6,499,999 2 5 65 $6,500,000 $6,999,999 1
1 174 1 33 $7,000,000 $7,999,999 2 1 117 $8,000,000 $8,999,999
1 91 $9,000,000 $9,999,999 1 3 86 $10,000,000 $11,999,999 $12,000,000 $13,499,999
1 91 2 79 $13,500,000 $14,999,999 $15,000,000 $17,499,999 $17,500,000 $19,999,999 3 208 $20,000,000 $24,999,999
1 35 2 169 $25,000,000 $29,999,999 $30,000,000 $39,999,999 1 77 $40,000,000 $49,999,999 1 171 $50,000,000 $59,999,999 $60,000,000 $69,999,999 $70,000,000 $79,999,999 $80,000,000 $100,000,000
ADVANTAGE SUPPLY & DEMAND
REALTORS
Based on last 3 months of homes sales, Bel-Air has 7.9 months supply of inventory.
Homes as of December 31, 2022
DEMAND BUYER / INVESTOR ADVANTAGE
REALTORS DIGEST
Sold Homes Days on Market Before Sold = DOM October November December Resold DOM New Cons New DOM Homes Resold Resold DOM New Cons New DOM Homes Resold Resold DOM New Cons New DOM 39 15 39 1 115 16 49 1 40 11 1 15 1 21 2 42 2 27 55 4 37 3 29 1 157 1 70 11 1 9 1 90 2 32 36 1 4 1 221 22 1 21 1 14 128 1 2 26 1 29 1 70 37 1 7 1 133 1 115 20 1 17 1 21
OBSERVATION
Jan 01, 2019 to Dec 31, 2019 Jan 01, 2020 to Dec 31, 2020 Jan 01, 2021 to Dec 31, 2021 Jan 01, 2022 to Dec 31, 2022 Mid-Low Typical Home Price-Median Mid-High 4 YEAR TREND For questions, comments, a tailor-made report for your home area, or a complimentary home valuation please contact LeHoa Gacki LeHoa Gacki, DRE #01422855 Douglas Elliman Real Estate 11990 San Vicente Blvd., #100, L.A., Ca 90049 Email: Lehoa.Gacki@elliman.com Tel | Fax: (424) 276-7587 www.Lehoagacki.com | Lehoagacki.elliman.com 4 YEAR OBSERVATION Pacific Palisades Number of Homes Sold: 211 255 383 231 Jan 01, 2019 to Dec 31, 2019 Jan 01, 2020 to Dec 31, 2020 Jan 01, 2021 to Dec 31, 2021 Jan 01, 2022 to Dec 31, 2022 Actual Lowest Sold $1,415,000 $1,450,000 $1,025,000 $1,787,500 Mid-Low $2,275,000 $2,400,000 $2,850,000 $3,312,026 Typical Home Price-Median $3,100,000 $3,298,000 $3,968,000 $4,500,000 Mid-High $4,609,000 $5,100,000 $6,100,000 $6,618,195 Actual Highest Sold $21,000,000 $24,000,000 $25,500,000 $51,000,000 Average Price Sold $3,953,606 $4,052,499 $5,091,786 $5,936,511 12 MONTH
Pacific Palisades Cumulative 12 months sold home analysis from: January 01, 2022 to December 31, 2022 231 Sold Sold Price **Overbid / Underbid Square Feet Price per/SqFt YB LotSqFt BD BA Days on Market Actual Lowest Sold $1,787,500 94 1,006 $1,777 1951 2,879 2 2 40 Mid-Low* $3,312,026 95 2,290 $1,186 1950 6,554 3 3 9 Typical Home Price-Median* $4,500,000 100 3,244 $1,453 1960 9,181 4 4 15 Mid-High* $6,618,195 105 4,583 $1,777 1996 16,867 5 6 50 Actual Highest Sold $51,000,000 89 - $0 0 132,261 10 14 50 Average $5,936,511 101 3,818 $1,553 1971 17,188 4 4 45 **Overbid / Underbid: 100 is list price paid. Under 100 means sold for less than asking, over 100 sold probably in multiples and over asking. Note: Square Footage calculation could be more or less (+-) 20% difference. (Based on calculation.) * Middle Range Variance $3,306,169 Middle Range Variance is future range Typical Home Price (Median) Price will vary by. Never more, Never less. Source: TheMLS/CLAW (Combined Los Angeles Westside) © 2022 LEHOA GACKI. DRE# 01422855. ALL WORLDWIDE RIGHTS RESERVED. DOUGLAS ELLIMAN REAL ESTATE. 150 EL CAMINO DRIVE, BEVERLY HILLS, CA 90212. 310.595.3888. ALL MATERIAL PRESENTED HEREIN IS INTENDED FOR INFORMATION PURPOSES ONLY AND NOT INTENDED TO CONSTITUTE PROFESSIONAL ADVICE OR WARRANTY OUTSIDE THE REALM OF REAL ESTATE BROKERAGE. MAPS CREATED FOR REFERENCE PURPOSE ONLY. WHILE THIS INFORMATION IS BELIEVED TO BE CORRECT, IT IS REPRESENTED SUBJECT TO ERRORS, OMISSIONS, CHANGES OR WITHDRAWAL WITHOUT NOTICE. BASED ON DATA SOURCED FROM THE COMBINED LOS ANGELES WESTSIDE MULTIPLE LISTING SERVICE AND PUBLIC RECORDS. STATISTICS ARE SUBJECT TO CHANGE DUE TO INDIVIDUAL REAL ESTATE COMPANY REPORTING DISCIPLINES. BUYER ADVANTAGE OR SELLER ADVANTAGE IS STRICTLY OF THE OPINION OF LEHOA GACKI AND ACCURACY CANNOT BE GUARANTEED AND MAY NOT REFLECT ALL REAL ESTATE ACTIVITY ON THE MARKET. ALL PROPERTY INFORMATION, INCLUDING, BUT NOT LIMITED TO MAPS, GRAPHS, DEPICTIONS, SQUARE FOOTAGE, ROOM COUNT, NUMBER OF BEDROOMS AND THE SCHOOL DISTRICT IN PROPERTY LISTINGS SHOULD BE VERIFIED BY YOUR OWN ATTORNEY, ARCHITECT OR ZONING EXPERT. NEW CONSTRUCTION COUNT, SQUARE FOOTAGE AND YEAR BUILT IS BASED ON INDIVIDUAL REAL ESTATE COMPANY REPORTING AND MAY BE DIFFERENT THAN PUBLIC RECORDS. NEW CONSTRUCTION COUNT IS BASED ON LISTING BROKERAGE LISTING YEAR. THE BROKER/AGENT PROVIDING THE INFORMATION CONTAINED HEREIN MAY OR MAY HAVE NOT BEEN THE LISTING AND/OR SELLING AGENT. THIS IS NOT INTENDED TO SOLICIT PROPERTY ALREADY LISTED. EQUAL HOUSING OPPORTUNITY. NEIGHBORHOOD
PUBLIC RECORDS, COMBINED LOS ANGELES WESTSIDE MULTIPLE LISTING SERVICE AND LOS ANGELES TIMES
L.A.
PACIFIC PALISADES
$2,275,000 $2,400,000 $2,850,000 $3,312,026 $3,100,000 $3,298,000 $3,968,000 $4,500,000 $4,609,000 $5,100,000 $6,100,000 $6,618,195 $$1,000,000 $2,000,000 $3,000,000 $4,000,000 $5,000,000 $6,000,000 $7,000,000
BOUNDARY SOURCE:
MAPPING
https://maps.latimes.com/neighborhoods/index.html
26 39 34 27 25 22 15 175 10 15 20 25 30 35 40 45 Jan 01 to Jun 30, 2019 Jul 01 to Dec 31, 2019 Jan 01 to Jun 30, 2020 Jul 01 to Dec
Jan
Jul
Number
Sold 80 131 82 173 201 182 128 103 Days
6 PAGE REPORT
PER
$1,097 $1,079 $1,018 $1,113 $1,129 $1,226 $1,513 $1,347 $1,190 $1,123 $1,114 $1,189 $1,240 $1,292 $1,644 $1,440 $$200 $400 $600 $800 $1,000 $1,200 $1,400 $1,600 $1,800 Jan 01 to Jun 30, 2019 Jul 01 to Dec 31, 2019 Jan 01 to Jun 30, 2020 Jul 01 to Dec 31, 2020 Jan 01 to Jun 30, 2021 Jul 01 to Dec 31, 2021 Jan 01 to Jun 30, 2022 Jul 01 to Dec 31, 2022 Median Price Per Square Foot Average Price per SquareFt
31, 2020
01 to Jun 30, 2021
01 to Dec 31, 2021 Jan 01 to Jun 30, 2022 Jul 01 to Dec 31, 2022
of Homes
on Market before Sold END OF PACIFIC PALISADES
SOLD HOME PRICE
SQUARE FOOT - PRE & POST MAR 2020 PANDEMIC PACIFIC PALISADES DAYS ON MARKET BEFORE SOLD- PRE & POST MAR 2020 PANDEMIC PACIFIC PALISADES
WHAT YOUR MONEY BUYS YOU THIS MONTH: Palms Home Analysis from: December 01, 2022 to December 31, 2022 3 Sold Sold Price **Overbid/ Underbid Square Feet Price per/SqFt YB LotSqFt BD BA Days on Market Actual Lowest Sold $1,175,000 98 1,515 $776 1947 4,994 3 2 52 Mid-Low* $1,175,000 95 1,515 $776 1940 4,994 2 2 52 Typical Home Price (Median)* $1,515,000 96 1,569 $951 1947 5,434 3 2 52 Mid-High* $2,195,000 98 2,307 $966 1951 6,447 4 2 72 Actual Highest Sold $2,195,000 96 2,307 $951 1951 6,447 4 2 52 Average $1,628,333 96 1,797 $898 1946 5,625 3 2 59 **Overbid/Underbid: 100 is list price paid. Under 100 means sold for less than asking, over 100 sold probably in multiples and over asking. Note: Square Footage calculation could be more or less (+-) 20% difference. (Based on calculation.) * Middle Range Variance $1,020,000 Middle Range Variance is future range Typical Home Price (Median) Price will vary by. Never more, Never less. Source: TheMLS/CLAW (Combined Los Angeles Westside) Single Family Homes December 2022 $1,515,000 TYPICAL HOME PRICE (MEDIAN) $951 SOLD PRICE PER SQUARE FOOT 52 DAYS ON MARKET BEFORE SOLD (DOM) $1,175,000 MID-LOW $2,195,000 MID-HIGH NEIGHBORING AREAS: Area Typical Home Price (Median) Price per/SqFt Days on Market Mid-Low Mid-High Mar Vista $2,610,578 $1,162 14 $1,607,500 $3,731,250 Rancho Park $1,655,000 $1,083 12 $1,521,750 $2,115,000 Cheviot Hills $3,235,000 $1,048 8 $2,535,000 $4,787,500 Beverlywood $2,725,000 $1,030 47 $1,977,500 $3,532,500 Mid-City $1,326,000 $808 20 $1,096,250 $1,629,625 Culver City $1,870,000 $1,044 11 $1,571,500 $2,041,250 LeHoa’s Neighborhood Data Charts Los Angeles Real Estate L.N.D.C. DECEMBER 2022 For questions, comments, a tailor-made report for your home area, or a complimentary home valuation please contact LeHoa Gacki LeHoa Gacki Douglas Elliman Real Estate DRE #01422855 Lehoa.Gacki@elliman.com www.LeHoaGacki.com 424.276.7587 Palms A neighborhood in the City of Los Angeles PALMS Rancho Park Cheviot Hills Beverlywood Culver City Mar Vista Mid-City
Buyer or Seller Advantage by Price Point for Palms as of December 31, 2022
Months supply of Inventory =
4-6 = BALANCED MARKET
Based on last 3 months of homes sales, Palms has 3.5 months supply of inventory.
HOME PRICE RANGE
$6,000,000 $10,000,000 $5,000,000 $5,999,999 $4,450,000 $4,999,999 $4,300,000 $4,449,999 $4,150,000 $4,299,999 $4,000,000 $4,149,999 $3,850,000 $3,999,999 $3,700,000 $3,849,999 $3,550,000 $3,699,999 $3,400,000 $3,549,999
3 and under FAVORS SELLER 7 and over FAVORS BUYER
SELLER ADVANTAGE
BUYER ADVANTAGE
$3,250,000 $3,399,999 $3,100,000 $3,249,999
BUYER ADVANTAGE $2,950,000 $3,099,999 $2,800,000 $2,949,999 $2,650,000 $2,799,999 $2,500,000 $2,649,999 $2,350,000 $2,499,999
$2,200,000 $2,349,999 $2,050,000 $2,199,999
$1,900,000 $2,049,999
BUYER ADVANTAGE $1,750,000 $1,899,999
$1,600,000 $1,749,999
$1,450,000 $1,599,999
BUYER ADVANTAGE $1,300,000 $1,449,999 $1,150,000 $1,299,999
BUYER ADVANTAGE
$1,000,000 $1,149,999 $750,000 $999,999 $500,000 $749,999
SELLER
ADVANTAGE
SELLER
ADVANTAGE
SELLER ADVANTAGE
SELLER
ADVANTAGE
SELLER ADVANTAGE
SELLER ADVANTAGE
Palms Inventory for New Construction and Resale of Homes as of
For Sale
Source: TheMLS/CLAW (Combined Los Angeles Westside)
Under Contract Pending - Closing Soon
New Construction New Con DOM Resale Resale DOM Home Price Range Homes Resold
2 13 150 3
$500,000 $749,999 $750,000 $999,999 2 649 $1,000,000 $1,149,999 1 31 $1,150,000 $1,299,999 1 1 127 $1,300,000 $1,449,999
1 $1,450,000 $1,599,999 2 45 $1,600,000 $1,749,999 1 2 34 $1,750,000 $1,899,999 1 34 $1,900,000 $2,049,999 2 59 $2,050,000 $2,199,999 $2,200,000 $2,349,999 $2,350,000 $2,499,999 1 $2,500,000 $2,649,999
$2,650,000 $2,799,999 $2,800,000 $2,949,999 1 25 $2,950,000 $3,099,999 $3,100,000 $3,249,999 1 160 $3,250,000 $3,399,999
1 $3,400,000 $3,549,999
$3,550,000 $3,699,999 $3,700,000 $3,849,999 $3,850,000 $3,999,999
$4,000,000 $4,149,999 $4,150,000 $4,299,999
$4,300,000 $4,449,999 $4,450,000 $4,999,999 $5,000,000 $5,999,999 $6,000,000 $10,000,000
SELLER ADVANTAGE SUPPLY & DEMAND
REALTORS
of December 31, 2022
Days
Sold
November December Resold DOM New Cons New DOM Homes Resold Resold DOM New Cons New DOM Homes Resold Resold DOM New Cons New DOM 15 5 40 3 59 32 2 44 1 52 1 72 7 1 21 1 35 1 58 1 52 7 REALTORS DIGEST
DEMAND BUYER / INVESTOR ADVANTAGE Based on last 3 months of homes sales, Bel-Air has 7.9 months supply of inventory. Sold Homes
on Market Before
= DOM October
OBSERVATION
$-
Jan 01, 2019 to Dec 31, 2019 Jan 01, 2020 to Dec 31, 2020 Jan 01, 2021 to Dec 31, 2021 Jan 01, 2022 to Dec 31, 2022 Mid-Low Typical Home Price-Median Mid-High 4 YEAR TREND For questions, comments, a tailor-made report for your home area, or a complimentary home valuation please contact LeHoa Gacki LeHoa Gacki, DRE #01422855 Douglas Elliman Real Estate 11990 San Vicente Blvd., #100, L.A., Ca 90049 Email: Lehoa.Gacki@elliman.com Tel | Fax: (424) 276-7587 www.Lehoagacki.com | Lehoagacki.elliman.com 4 YEAR OBSERVATION Palms Number of Homes Sold: 61 44 71 53 Jan 01, 2019 to Dec 31, 2019 Jan 01, 2020 to Dec 31, 2020 Jan 01, 2021 to Dec 31, 2021 Jan 01, 2022 to Dec 31, 2022 Actual Lowest Sold $725,000 $775,000 $590,000 $604,250 Mid-Low $1,222,500 $1,201,250 $1,320,000 $1,428,500 Typical Home Price-Median $1,350,000 $1,390,000 $1,625,000 $1,660,000 Mid-High $1,564,000 $1,760,500 $1,850,000 $1,973,250 Actual Highest Sold $2,700,000 $2,802,000 $3,550,000 $3,650,000 Average Price Sold $1,467,838 $1,486,758 $1,692,545 $1,732,199 12
Palms Cumulative 12 months sold home analysis from: January 01, 2022 to December 31, 2022 53 Sold Sold Price **Overbid / Underbid Square Feet Price per/SqFt YB LotSqFt BD BA Days on Market Actual Lowest Sold $604,250 93 518 $1,167 1922 2,273 1 1 41 Mid-Low* $1,428,500 98 1,351 $890 1940 5,000 2 2 9 Typical Home Price-Median* $1,660,000 102 1,591 $1,022 1941 5,664 3 2 15 Mid-High* $1,973,250 106 2,098 $1,202 1951 6,653 4 3 34 Actual Highest Sold $3,650,000 104 3,900 $936 2017 8,714 5 6 22 Average $1,732,199 102 1,689 $1,068 1949 5,823 3 2 23 **Overbid / Underbid: 100 is list price paid. Under 100 means sold for less than asking, over 100 sold probably in multiples and over asking. Note: Square Footage calculation could be more or less (+-) 20% difference. (Based on calculation.) * Middle Range Variance $544,750 Middle Range Variance is future range Typical Home Price (Median) Price will vary by. Never more, Never less. Source: TheMLS/CLAW (Combined Los Angeles Westside) © 2022 LEHOA GACKI. DRE# 01422855. ALL WORLDWIDE RIGHTS RESERVED. DOUGLAS ELLIMAN REAL ESTATE. 150 EL CAMINO DRIVE, BEVERLY HILLS, CA 90212. 310.595.3888. ALL MATERIAL PRESENTED HEREIN IS INTENDED FOR INFORMATION PURPOSES ONLY AND NOT INTENDED TO CONSTITUTE PROFESSIONAL ADVICE OR WARRANTY OUTSIDE THE REALM OF REAL ESTATE BROKERAGE. MAPS CREATED FOR REFERENCE PURPOSE ONLY. WHILE THIS INFORMATION IS BELIEVED TO BE CORRECT, IT IS REPRESENTED SUBJECT TO ERRORS, OMISSIONS, CHANGES OR WITHDRAWAL WITHOUT NOTICE. BASED ON DATA SOURCED FROM THE COMBINED LOS ANGELES WESTSIDE MULTIPLE LISTING SERVICE AND PUBLIC RECORDS. STATISTICS ARE SUBJECT TO CHANGE DUE TO INDIVIDUAL REAL ESTATE COMPANY REPORTING DISCIPLINES. BUYER ADVANTAGE OR SELLER ADVANTAGE IS STRICTLY OF THE OPINION OF LEHOA GACKI AND ACCURACY CANNOT BE GUARANTEED AND MAY NOT REFLECT ALL REAL ESTATE ACTIVITY ON THE MARKET. ALL PROPERTY INFORMATION, INCLUDING, BUT NOT LIMITED TO MAPS, GRAPHS, DEPICTIONS, SQUARE FOOTAGE, ROOM COUNT, NUMBER OF BEDROOMS AND THE SCHOOL DISTRICT IN PROPERTY LISTINGS SHOULD BE VERIFIED BY YOUR OWN ATTORNEY, ARCHITECT OR ZONING EXPERT. NEW CONSTRUCTION COUNT, SQUARE FOOTAGE AND YEAR BUILT IS BASED ON INDIVIDUAL REAL ESTATE COMPANY REPORTING AND MAY BE DIFFERENT THAN PUBLIC RECORDS. NEW CONSTRUCTION COUNT IS BASED ON LISTING BROKERAGE LISTING YEAR. THE BROKER/AGENT PROVIDING THE INFORMATION CONTAINED HEREIN MAY OR MAY HAVE NOT BEEN THE LISTING AND/OR SELLING AGENT. THIS IS NOT INTENDED TO SOLICIT PROPERTY ALREADY LISTED. EQUAL HOUSING OPPORTUNITY. NEIGHBORHOOD
PUBLIC RECORDS, COMBINED LOS ANGELES WESTSIDE MULTIPLE LISTING SERVICE AND LOS ANGELES TIMES MAPPING L.A. https://maps.latimes.com/neighborhoods/index.html PALMS
$1,222,500 $1,201,250 $1,320,000 $1,428,500 $1,350,000 $1,390,000 $1,625,000 $1,660,000 $1,564,000 $1,760,500 $1,850,000 $1,973,250
$500,000 $1,000,000 $1,500,000 $2,000,000 $2,500,000
MONTH
BOUNDARY SOURCE:
$-
Jan 01 to Jun
Jul 01 to Dec 31,
Jan
Jun
Jul
Jul
Median Price Per Square Foot Average Price per SquareFt 28 14 5 15 22 20 13 325 10 15 20 25 30 35 Jan 01 to Jun 30, 2019 Jul 01 to Dec 31, 2019 Jan 01 to Jun 30, 2020 Jul 01 to Dec 31, 2020 Jan 01 to Jun 30, 2021 Jul 01 to Dec 31, 2021 Jan 01 to Jun 30,
Jul 01 to Dec 31, 2022 Number of Homes Sold 39 22 15 29 42 29 32 21 Days
Sold END OF PALMS 6 PAGE REPORT SOLD HOME PRICE PER SQUARE FOOT - PRE & POST MAR 2020 PANDEMIC PALMS DAYS
SOLD-
PALMS
$839 $915 $902 $874 $917 $913 $1,078 $985 $897 $867 $939 $916 $925 $934 $1,093 $1,029
$200 $400 $600 $800 $1,000 $1,200
30, 2019
2019
01 to
30, 2020
01 to Dec 31, 2020 Jan 01 to Jun 30, 2021
01 to Dec 31, 2021 Jan 01 to Jun 30, 2022 Jul 01 to Dec 31, 2022
2022
on Market before
ON MARKET BEFORE
PRE & POST MAR 2020 PANDEMIC
Single Family Homes December 2022 $2,512,500 TYPICAL HOME PRICE (MEDIAN) $1,004 SOLD PRICE PER SQUARE FOOT 18 DAYS ON MARKET BEFORE SOLD (DOM) $1,575,000 MID-LOW $3,637,500 MID-HIGH NEIGHBORING AREAS: Area Typical Home Price (Median) Price per/SqFt Days on Market Mid-Low Mid-High Century City $2,307,500 $1,342 11 $1,869,375 $3,452,526 Beverly Hills $5,343,500 $1,557 54 $3,483,750 $8,250,000 Beverly Grove $2,099,000 $1,316 24 $2,025,000 $3,100,000 Carthay $2,425,500 $1,015 11 $2,267,320 $2,676,250 Mid-City $1,326,000 $808 20 $1,096,250 $1,629,625 Beverlywood $2,725,000 $1,030 47 $1,977,500 $3,532,500 Cheviot Hills $3,235,000 $1,048 8 $2,535,000 $4,787,500 For questions, comments, a tailor-made report for your home area, or a complimentary home valuation please contact LeHoa Gacki LeHoa Gacki Douglas Elliman Real Estate DRE #01422855 Lehoa.Gacki@elliman.com www.LeHoaGacki.com 424.276.7587 LeHoa’s Neighborhood Data Charts Los Angeles Real Estate L.N.D.C. DECEMBER 2022 PicoRobertson A neighborhood in the City of Los Angeles PICO-ROBERTSON Beverly Hills Beverly Grove Century City Carthay Cheviot Hills Beverlywood Mid-City WHAT YOUR MONEY BUYS YOU THIS MONTH: Pico Robertson Home Analysis from: December 01, 2022 to December 31, 2022 4 Sold Sold Price **Overbid/ Underbid Square Feet Price per/SqFt YB LotSqFt BD BA Days on Market Actual Lowest Sold $1,525,000 97 1,510 $1,010 1930 6,252 2 2 5 Mid-Low* $1,575,000 95 1,642 $885 1953 4,448 3 2 5 Typical Home Price (Median)* $2,512,500 96 2,520 $1,004 2022 5,908 4 4 18 Mid-High* $3,637,500 100 3,570 $1,077 2022 6,181 5 6 34 Actual Highest Sold $3,750,000 101 3,759 $998 2022 5,850 5 6 6 Average $2,575,000 97 2,577 $988 1999 5,512 4 4 19 **Overbid/Underbid: 100 is list price paid. Under 100 means sold for less than asking, over 100 sold probably in multiples and over asking. Note: Square Footage calculation could be more or less (+-) 20% difference. (Based on calculation.) * Middle Range Variance $2,062,500 Middle Range Variance is future range Typical Home Price (Median) Price will vary by. Never more, Never less. Source: TheMLS/CLAW (Combined Los Angeles Westside)
Buyer or Seller Advantage by Price Point for Pico Robertson as of December 31, 2022
Months supply of Inventory =
4-6 = BALANCED MARKET
Based on last 3 months of homes sales, Pico Robertson has 2.0 months supply of inventory.
HOME PRICE RANGE
$7,000,000 $10,000,000 $5,000,000 $6,999,999 $4,450,000 $4,999,999 $4,300,000 $4,449,999
BUYER ADVANTAGE
$4,150,000 $4,299,999 $4,000,000 $4,149,999 $3,850,000 $3,999,999 $3,700,000 $3,849,999
$3,550,000 $3,699,999 $3,400,000 $3,549,999
SELLER
3 and under FAVORS SELLER 7 and over FAVORS BUYER
ADVANTAGE
SELLER ADVANTAGE
$3,250,000 $3,399,999 SELLER ADVANTAGE $3,100,000 $3,249,999
BUYER ADVANTAGE
$2,950,000 $3,099,999 $2,800,000 $2,949,999 $2,650,000 $2,799,999 $2,500,000 $2,649,999
BUYER ADVANTAGE
$2,350,000 $2,499,999 $2,200,000 $2,349,999 $2,050,000 $2,199,999
$1,900,000 $2,049,999 $1,750,000 $1,899,999
$1,600,000 $1,749,999
SELLER ADVANTAGE
SELLER ADVANTAGE
SELLER ADVANTAGE $1,300,000 $1,449,999 SELLER ADVANTAGE
$1,450,000 $1,599,999
$1,150,000 $1,299,999
$1,000,000 $1,149,999 $750,000 $999,999 $500,000 $749,999
SELLER ADVANTAGE
Pico Robertson Inventory for New Construction and Resale of Homes
SELLER ADVANTAGE SUPPLY & DEMAND
For Sale
Source: TheMLS/CLAW (Combined Los Angeles Westside)
Under Contract Pending - Closing Soon
New Construction New Con DOM Resale Resale DOM Home Price Range Homes Resold
2 3 6 86 2
$500,000 $749,999 $750,000 $999,999 $1,000,000 $1,149,999 2 $1,150,000 $1,299,999 1 $1,300,000 $1,449,999
$1,450,000 $1,599,999 1 33 $1,600,000 $1,749,999 1
1 2 72 $1,750,000 $1,899,999
$1,900,000 $2,049,999 $2,050,000 $2,199,999 1 $2,200,000 $2,349,999 1 135 $2,350,000 $2,499,999 $2,500,000 $2,649,999 $2,650,000 $2,799,999 $2,800,000 $2,949,999 1 158 $2,950,000 $3,099,999
$3,100,000 $3,249,999 $3,250,000 $3,399,999 1 $3,400,000 $3,549,999
$3,550,000 $3,699,999 $3,700,000 $3,849,999 $3,850,000 $3,999,999 $4,000,000 $4,149,999 1 48 $4,150,000 $4,299,999
$4,300,000 $4,449,999
$4,450,000 $4,999,999 $5,000,000 $6,999,999 $7,000,000 $10,000,000
REALTORS
Homes as of December 31, 2022
BUYER
Sold Homes Days on Market Before Sold
DOM October November December Resold DOM New Cons New DOM Homes Resold Resold DOM New Cons New DOM Homes Resold Resold DOM New Cons New DOM 69 1 23 2 6 1 5 3 23 1 1 5 70 1 23 1 12 1 29 68 1 35 1 6 REALTORS DIGEST
DEMAND
/ INVESTOR ADVANTAGE Based on last 3 months of homes sales, Bel-Air has 7.9 months supply of inventory.
=
$1,880,500
$1,652,000
Jan 01, 2019 to Dec 31, 2019 Jan 01, 2020 to Dec 31, 2020 Jan 01, 2021 to Dec 31, 2021 Jan 01, 2022 to Dec 31, 2022 Mid-Low Typical Home Price-Median Mid-High 4 YEAR TREND For questions, comments, a tailor-made report for your home area, or a complimentary home valuation please contact LeHoa Gacki LeHoa Gacki, DRE #01422855 Douglas Elliman Real Estate 11990 San Vicente Blvd., #100, L.A., Ca 90049 Email: Lehoa.Gacki@elliman.com Tel | Fax: (424) 276-7587 www.Lehoagacki.com | Lehoagacki.elliman.com 4 YEAR OBSERVATION Pico Robertson Number of Homes Sold: 29 39 39 26 Jan 01, 2019 to Dec 31, 2019 Jan 01, 2020 to Dec 31, 2020 Jan 01, 2021 to Dec 31, 2021 Jan 01, 2022 to Dec 31, 2022 Actual Lowest Sold $960,000 $1,135,000 $1,350,000 $1,465,000 Mid-Low $1,374,500 $1,455,000 $1,615,000 $1,652,000 Typical Home Price-Median $1,550,000 $1,635,000 $2,000,000 $1,880,500 Mid-High $2,545,538 $2,275,000 $2,955,000 $2,675,000 Actual Highest Sold $4,050,000 $2,962,000 $4,325,000 $3,822,500 Average Price Sold $1,908,204 $1,792,865 $2,317,872 $2,219,566 12 MONTH
Pico Robertson Cumulative 12 months sold home analysis from: January 01, 2022 to December 31, 2022 26 Sold Sold Price **Overbid / Underbid Square Feet Price per/SqFt YB LotSqFt BD BA Days on Market Actual Lowest Sold $1,465,000 100 1,372 $1,068 1927 6,254 3 2 12 Mid-Low* $1,652,000 96 1,620 $910 1928 5,724 3 2 7 Typical Home Price-Median* $1,880,500 100 1,918 $1,011 1937 6,062 3 3 12 Mid-High* $2,675,000 102 2,872 $1,169 1943 6,462 4 4 38 Actual Highest Sold $3,822,500 101 4,108 $931 1927 6,946 5 6 48 Average $2,219,566 102 2,259 $1,023 1948 5,970 4 3 24 **Overbid / Underbid: 100 is list price paid. Under 100 means sold for less than asking, over 100 sold probably in multiples and over asking. Note: Square Footage calculation could be more or less (+-) 20% difference. (Based on calculation.) * Middle Range Variance $1,023,000 Middle Range Variance is future range Typical Home Price (Median) Price will vary by. Never more, Never less. Source: TheMLS/CLAW (Combined Los Angeles Westside) © 2022 LEHOA GACKI. DRE# 01422855. ALL WORLDWIDE RIGHTS RESERVED. DOUGLAS ELLIMAN REAL ESTATE. 150 EL CAMINO DRIVE, BEVERLY HILLS, CA 90212. 310.595.3888. ALL MATERIAL PRESENTED HEREIN IS INTENDED FOR INFORMATION PURPOSES ONLY AND NOT INTENDED TO CONSTITUTE PROFESSIONAL ADVICE OR WARRANTY OUTSIDE THE REALM OF REAL ESTATE BROKERAGE. MAPS CREATED FOR REFERENCE PURPOSE ONLY. WHILE THIS INFORMATION IS BELIEVED TO BE CORRECT, IT IS REPRESENTED SUBJECT TO ERRORS, OMISSIONS, CHANGES OR WITHDRAWAL WITHOUT NOTICE. BASED ON DATA SOURCED FROM THE COMBINED LOS ANGELES WESTSIDE MULTIPLE LISTING SERVICE AND PUBLIC RECORDS. STATISTICS ARE SUBJECT TO CHANGE DUE TO INDIVIDUAL REAL ESTATE COMPANY REPORTING DISCIPLINES. BUYER ADVANTAGE OR SELLER ADVANTAGE IS STRICTLY OF THE OPINION OF LEHOA GACKI AND ACCURACY CANNOT BE GUARANTEED AND MAY NOT REFLECT ALL REAL ESTATE ACTIVITY ON THE MARKET. ALL PROPERTY INFORMATION, INCLUDING, BUT NOT LIMITED TO MAPS, GRAPHS, DEPICTIONS, SQUARE FOOTAGE, ROOM COUNT, NUMBER OF BEDROOMS AND THE SCHOOL DISTRICT IN PROPERTY LISTINGS SHOULD BE VERIFIED BY YOUR OWN ATTORNEY, ARCHITECT OR ZONING EXPERT. NEW CONSTRUCTION COUNT, SQUARE FOOTAGE AND YEAR BUILT IS BASED ON INDIVIDUAL REAL ESTATE COMPANY REPORTING AND MAY BE DIFFERENT THAN PUBLIC RECORDS. NEW CONSTRUCTION COUNT IS BASED ON LISTING BROKERAGE LISTING YEAR. THE BROKER/AGENT PROVIDING THE INFORMATION CONTAINED HEREIN MAY OR MAY HAVE NOT BEEN THE LISTING AND/OR SELLING AGENT. THIS IS NOT INTENDED TO SOLICIT PROPERTY ALREADY LISTED. EQUAL HOUSING OPPORTUNITY. NEIGHBORHOOD BOUNDARY SOURCE: PUBLIC RECORDS, COMBINED LOS ANGELES WESTSIDE MULTIPLE LISTING SERVICE AND LOS ANGELES TIMES MAPPING L.A. https://maps.latimes.com/neighborhoods/index.html PICO ROBERTSON
$1,374,500 $1,455,000 $1,615,000
$1,550,000 $1,635,000 $2,000,000
$2,545,538 $2,275,000 $2,955,000 $2,675,000 $$500,000 $1,000,000 $1,500,000 $2,000,000 $2,500,000 $3,000,000 $3,500,000
OBSERVATION
Jan
Jul
Jul
Price Per
Foot Average Price per
56 32 15 32 18 9 16 1210 20 30 40 50 60 Jan 01 to Jun 30, 2019 Jul 01 to Dec 31, 2019 Jan 01 to Jun 30, 2020 Jul 01 to Dec 31, 2020 Jan 01 to Jun 30, 2021 Jul 01 to Dec 31, 2021 Jan
to Jun
Jul
Dec
Number of Homes Sold 15 14 10 29 20 19 10 16 Days
END OF PICO ROBERTSON 6 PAGE REPORT SOLD HOME PRICE PER
FOOT
POST
DAYS
PICO
$831 $866 $942 $920 $921 $929 $946 $1,043 $881 $894 $884 $917 $913 $939 $943 $1,073 $$200 $400 $600 $800 $1,000 $1,200
01 to Jun 30, 2019
01 to Dec 31, 2019 Jan 01 to Jun 30, 2020
01 to Dec 31, 2020 Jan 01 to Jun 30, 2021 Jul 01 to Dec 31, 2021 Jan 01 to Jun 30, 2022 Jul 01 to Dec 31, 2022 Median
Square
SquareFt
01
30, 2022
01 to
31, 2022
on Market before Sold
SQUARE
- PRE &
MAR 2020 PANDEMIC PICO ROBERTSON
ON MARKET BEFORE SOLD- PRE & POST MAR 2020 PANDEMIC
ROBERTSON
WHAT YOUR MONEY BUYS YOU THIS MONTH: Playa Vista Home Analysis from: December 01, 2022 to December 31, 2022 2 Sold Sold Price **Overbid/ Underbid Square Feet Price per/SqFt YB LotSqFt BD BA Days on Market Actual Lowest Sold $1,850,000 100 2,150 $860 2006 90,568 3 4 6 Typical Home Price (Median)* $1,910,000 101 2,263 $845 2004 76,935 3 4 6 Actual Highest Sold $1,970,000 101 2,376 $829 2002 63,302 3 4 6 Average $1,910,000 101 2,263 $845 2004 76,935 3 4 6 **Overbid/Underbid: 100 is list price paid. Under 100 means sold for less than asking, over 100 sold probably in multiples and over asking. Note: Square Footage calculation could be more or less (+-) 20% difference. (Based on calculation.) Source: TheMLS/CLAW (Combined Los Angeles Westside) Single Family Homes December 2022 $1,910,000 TYPICAL HOME PRICE (MEDIAN) $845 SOLD PRICE PER SQUARE FOOT 6 DAYS ON MARKET BEFORE SOLD (DOM) NEIGHBORING AREAS: Area Typical Home Price (Median) Price per/SqFt Days on Market Mid-Low Mid-High Playa Del Rey $2,305,000 $882 22 $1,850,000 $2,830,000 Marina Del Rey $2,700,000 $891 22 Del Rey $1,870,000 $1,044 11 $1,571,500 $2,041,250 Culver City $1,870,000 $1,044 11 $1,571,500 $2,041,250 Westchester $1,435,600 $803 30 $1,130,000 $1,884,963 For questions, comments, a tailor-made report for your home area, or a complimentary home valuation please contact LeHoa Gacki LeHoa Gacki Douglas Elliman Real Estate DRE #01422855 Lehoa.Gacki@elliman.com www.LeHoaGacki.com 424.276.7587 LeHoa’s Neighborhood Data Charts Los Angeles Real Estate L.N.D.C. DECEMBER 2022 Playa Vista A neighborhood in the City of Los Angeles Marina Del Rey PLAYA VISTA Del Rey Culver City Playa Del Rey Westchester
Buyer or Seller Advantage by Price Point for Playa Vista as of December 31, 2022
Months supply of Inventory =
4-6 = BALANCED MARKET
Based on last 3 months of homes sales, Playa Vista has 1.5 months supply of inventory.
HOME PRICE RANGE
$6,000,000 $10,000,000 $5,000,000 $5,999,999 $4,450,000 $4,999,999 $4,300,000 $4,449,999 $4,150,000 $4,299,999 $4,000,000 $4,149,999 $3,850,000 $3,999,999 $3,700,000 $3,849,999 $3,550,000 $3,699,999 $3,400,000 $3,549,999 $3,250,000 $3,399,999 SELLER
3 and under FAVORS SELLER 7 and over FAVORS BUYER
ADVANTAGE
$3,100,000 $3,249,999 SELLER ADVANTAGE $2,950,000 $3,099,999
BUYER ADVANTAGE $2,800,000 $2,949,999 $2,650,000 $2,799,999 $2,500,000 $2,649,999 $2,350,000 $2,499,999 $2,200,000 $2,349,999 $2,050,000 $2,199,999 SELLER
ADVANTAGE
$1,900,000 $2,049,999 SELLER ADVANTAGE $1,750,000 $1,899,999 SELLER ADVANTAGE
$1,600,000 $1,749,999 $1,450,000 $1,599,999 $1,300,000 $1,449,999 $1,150,000 $1,299,999 $1,000,000 $1,149,999
BUYER ADVANTAGE $750,000 $999,999 $500,000 $749,999
Playa Vista Inventory for New Construction and Resale of Homes
SELLER ADVANTAGE SUPPLY & DEMAND
For Sale
Source: TheMLS/CLAW (Combined Los Angeles Westside)
Under Contract Pending - Closing Soon
New Construction New Con DOM Resale Resale DOM Home Price Range Homes Resold
1 3 32 1
$500,000 $749,999 1 3 $750,000 $999,999
$1,000,000 $1,149,999 $1,150,000 $1,299,999 $1,300,000 $1,449,999
$1,450,000 $1,599,999
$1,600,000 $1,749,999 $1,750,000 $1,899,999
1 1 38 $1,900,000 $2,049,999 $2,050,000 $2,199,999 1 $2,200,000 $2,349,999 $2,350,000 $2,499,999 $2,500,000 $2,649,999 $2,650,000 $2,799,999 1 54
$2,800,000 $2,949,999 $2,950,000 $3,099,999
$3,100,000 $3,249,999
$3,250,000 $3,399,999 $3,400,000 $3,549,999
$3,550,000 $3,699,999 $3,700,000 $3,849,999 $3,850,000 $3,999,999
$4,000,000 $4,149,999 $4,150,000 $4,299,999
$4,300,000 $4,449,999
$4,450,000 $4,999,999
$5,000,000 $5,999,999 $6,000,000 $10,000,000
REALTORS
Homes as of December 31, 2022
BUYER
INVESTOR
inventory. Sold Homes Days on Market Before Sold = DOM October November December Resold DOM New Cons New DOM Homes Resold Resold DOM New Cons New DOM Homes Resold Resold DOM New Cons New DOM 7 3 12 2 6 1 6 1 6 7 1 13 1 0 1 23 REALTORS DIGEST
DEMAND
/
ADVANTAGE Based on last 3 months of homes sales, Bel-Air has 7.9 months supply of
$1,416,250
$1,125,000 $1,251,250
$1,721,461 $1,656,000

OBSERVATION
Jan 01, 2019 to Dec 31, 2019 Jan 01, 2020 to Dec 31, 2020 Jan 01, 2021 to Dec 31, 2021 Jan 01, 2022 to Dec 31, 2022 Mid-Low Typical Home Price-Median Mid-High 4 YEAR TREND For questions, comments, a tailor-made report for your home area, or a complimentary home valuation please contact LeHoa Gacki LeHoa Gacki, DRE #01422855 Douglas Elliman Real Estate 11990 San Vicente Blvd., #100, L.A., Ca 90049 Email: Lehoa.Gacki@elliman.com Tel | Fax: (424) 276-7587 www.Lehoagacki.com | Lehoagacki.elliman.com 4 YEAR OBSERVATION Playa Vista Number of Homes Sold: 50 56 78 39 Jan 01, 2019 to Dec 31, 2019 Jan 01, 2020 to Dec 31, 2020 Jan 01, 2021 to Dec 31, 2021 Jan 01, 2022 to Dec 31, 2022 Actual Lowest Sold $662,000 $900,000 $920,000 $1,085,000 Mid-Low $1,125,000 $1,251,250 $1,721,461 $1,656,000 Typical Home Price-Median $1,416,250 $1,835,000 $2,349,500 $2,055,000 Mid-High $2,653,250 $2,278,000 $2,903,000 $2,858,000 Actual Highest Sold $4,058,000 $3,988,888 $4,700,000 $5,000,000 Average Price Sold $1,894,845 $1,884,449 $2,306,556 $2,345,990 12
Playa Vista Cumulative 12 months sold home analysis from: January 01, 2022 to December 31, 2022 39 Sold Sold Price **Overbid / Underbid Square Feet Price per/SqFt YB LotSqFt BD BA Days on Market Actual Lowest Sold $1,085,000 104 1,006 $1,079 1952 2,881 2 2 14 Mid-Low* $1,656,000 100 1,693 $827 1952 5,750 3 2 7 Typical Home Price-Median* $2,055,000 100 2,241 $919 2002 9,379 3 4 13 Mid-High* $2,858,000 104 2,758 $1,061 2014 49,074 4 4 23 Actual Highest Sold $5,000,000 100 - $0 0 - 4 5 23 Average $2,345,990 102 2,422 $940 1985 25,589 4 3 17 **Overbid / Underbid: 100 is list price paid. Under 100 means sold for less than asking, over 100 sold probably in multiples and over asking. Note: Square Footage calculation could be more or less (+-) 20% difference. (Based on calculation.) * Middle Range Variance $1,202,000 Middle Range Variance is future range Typical Home Price (Median) Price will vary by. Never more, Never less. Source: TheMLS/CLAW (Combined Los Angeles Westside) © 2022 LEHOA GACKI. DRE# 01422855. ALL WORLDWIDE RIGHTS RESERVED. DOUGLAS ELLIMAN REAL ESTATE. 150 EL CAMINO DRIVE, BEVERLY HILLS, CA 90212. 310.595.3888. ALL MATERIAL PRESENTED HEREIN IS INTENDED FOR INFORMATION PURPOSES ONLY AND NOT INTENDED TO CONSTITUTE PROFESSIONAL ADVICE OR WARRANTY OUTSIDE THE REALM OF REAL ESTATE BROKERAGE. MAPS CREATED FOR REFERENCE PURPOSE ONLY. WHILE THIS INFORMATION IS BELIEVED TO BE CORRECT, IT IS REPRESENTED SUBJECT TO ERRORS, OMISSIONS, CHANGES OR WITHDRAWAL WITHOUT NOTICE. BASED ON DATA SOURCED FROM THE COMBINED LOS ANGELES WESTSIDE MULTIPLE LISTING SERVICE AND PUBLIC RECORDS. STATISTICS ARE SUBJECT TO CHANGE DUE TO INDIVIDUAL REAL ESTATE COMPANY REPORTING DISCIPLINES. BUYER ADVANTAGE OR SELLER ADVANTAGE IS STRICTLY OF THE OPINION OF LEHOA GACKI AND ACCURACY CANNOT BE GUARANTEED AND MAY NOT REFLECT ALL REAL ESTATE ACTIVITY ON THE MARKET. ALL PROPERTY INFORMATION, INCLUDING, BUT NOT LIMITED TO MAPS, GRAPHS, DEPICTIONS, SQUARE FOOTAGE, ROOM COUNT, NUMBER OF BEDROOMS AND THE SCHOOL DISTRICT IN PROPERTY LISTINGS SHOULD BE VERIFIED BY YOUR OWN ATTORNEY, ARCHITECT OR ZONING EXPERT. NEW CONSTRUCTION COUNT, SQUARE FOOTAGE AND YEAR BUILT IS BASED ON INDIVIDUAL REAL ESTATE COMPANY REPORTING AND MAY BE DIFFERENT THAN PUBLIC RECORDS. NEW CONSTRUCTION COUNT IS BASED ON LISTING BROKERAGE LISTING YEAR. THE BROKER/AGENT PROVIDING THE INFORMATION CONTAINED HEREIN MAY OR MAY HAVE NOT BEEN THE LISTING AND/OR SELLING AGENT. THIS IS NOT INTENDED TO SOLICIT PROPERTY ALREADY LISTED. EQUAL HOUSING OPPORTUNITY. NEIGHBORHOOD
PUBLIC RECORDS, COMBINED LOS ANGELES WESTSIDE MULTIPLE LISTING SERVICE AND LOS ANGELES TIMES MAPPING L.A. https://maps.latimes.com/neighborhoods/index.html
VISTA
$1,835,000 $2,349,500 $2,055,000 $2,653,250 $2,278,000 $2,903,000 $2,858,000 $$500,000 $1,000,000 $1,500,000 $2,000,000 $2,500,000 $3,000,000 $3,500,000
MONTH
BOUNDARY SOURCE:
PLAYA
58 44 22 31 20 11 13 1310 20 30 40 50 60 70 Jan 01 to Jun 30, 2019 Jul 01 to Dec 31, 2019 Jan 01 to Jun 30, 2020 Jul 01 to Dec 31, 2020 Jan 01 to Jun 30, 2021 Jul 01 to Dec 31, 2021 Jan 01 to Jun 30, 2022 Jul 01 to Dec 31, 2022 Number of Homes Sold 22 28 24 32 37 41 24 15 Days on Market before Sold $812 $810 $784 $806 $831 $891 $966 $860 $784 $792 $776 $804 $824 $865 $971 $896 $$200 $400 $600 $800 $1,000 $1,200 Jan 01 to Jun 30, 2019 Jul 01 to Dec 31, 2019 Jan 01 to Jun 30, 2020 Jul 01 to Dec 31, 2020 Jan 01 to Jun 30, 2021 Jul 01 to Dec 31, 2021 Jan 01 to Jun 30, 2022 Jul 01 to Dec 31, 2022
END OF
VISTA 6 PAGE REPORT
Median Price Per Square Foot Average Price per SquareFt
PLAYA
SOLD HOME PRICE PER SQUARE FOOT - PRE & POST MAR 2020 PANDEMIC PLAYA VISTA DAYS ON MARKET BEFORE SOLD- PRE & POST MAR 2020 PANDEMIC PLAYA VISTA
Single Family Homes December 2022 $1,655,000 TYPICAL HOME PRICE (MEDIAN) $1,083 SOLD PRICE PER SQUARE FOOT 12 DAYS ON MARKET BEFORE SOLD (DOM) NEIGHBORING AREAS: Area Typical Home Price (Median) Price per/SqFt Days on Market Mid-Low Mid-High Sawtelle $1,636,000 $824 38 $1,070,000 $1,748,000 West Los Angeles $1,925,000 $1,303 20 $1,711,250 $2,545,375 Cheviot Hills $3,235,000 $1,048 8 $2,535,000 $4,787,500 Palms $1,515,000 $951 52 $1,175,000 $2,195,000 Mar Vista $2,610,578 $1,162 14 $1,607,500 $3,731,250 For questions, comments, a tailor-made report for your home area, or a complimentary home valuation please contact LeHoa Gacki LeHoa Gacki Douglas Elliman Real Estate DRE #01422855 Lehoa.Gacki@elliman.com www.LeHoaGacki.com 424.276.7587 LeHoa’s Neighborhood Data Charts Los Angeles Real Estate L.N.D.C. DECEMBER 2022 Rancho Park A neighborhood in the City of Los Angeles MarVista RANCHO PARK West Los Angeles Palms Cheviot Hills Sawtelle WHAT YOUR MONEY BUYS YOU THIS MONTH: No Homes Sold in Rancho Park in the month of December
Buyer or Seller Advantage by Price Point for Rancho Park as of December 31, 2022
Months supply of Inventory =
Based on last 3 months of homes sales, Rancho Park has 1.5 months supply of inventory.
HOME PRICE RANGE
$15,000,000 $20,000,000 $12,000,000 $14,999,999 $11,000,000 $11,999,999 $10,000,000 $10,999,999 $9,000,000 $9,999,999 $8,000,000 $8,999,999 $7,500,000 $7,999,999 $7,000,000 $7,499,999 $6,500,000 $6,999,999 $6,000,000 $6,499,999 $5,500,000 $5,999,999 $5,000,000 $5,499,999 $4,750,000 $4,999,999 $4,500,000 $4,749,999 $4,250,000 $4,499,999 $4,000,000 $4,249,999 $3,750,000 $3,999,999 $3,500,000 $3,749,999 $3,250,000 $3,499,999 $3,000,000 $3,249,999 $2,750,000 $2,999,999 $2,500,000 $2,749,999
4-6 = BALANCED MARKET 3 and under FAVORS SELLER 7 and over FAVORS BUYER
SELLER ADVANTAGE $2,250,000 $2,499,999
SELLER ADVANTAGE $2,000,000 $2,249,999
SELLER ADVANTAGE $1,750,000 $1,999,999
SELLER ADVANTAGE $1,500,000 $1,749,999 SELLER ADVANTAGE
BUYER ADVANTAGE
$1,250,000 $1,499,999 $1,000,000 $1,249,999
SELLER
ADVANTAGE
Rancho Park Inventory for New Construction and Resale of Homes
SELLER ADVANTAGE SUPPLY & DEMAND
For Sale
Source: TheMLS/CLAW (Combined Los Angeles Westside)
Under Contract Pending - Closing Soon
New Construction New Con DOM Resale Resale DOM Home Price Range Homes Resold
2 3 55 2 2 15
$1,000,000 $1,249,999 1 135 $1,250,000 $1,499,999 $1,500,000 $1,749,999 1 1
$1,750,000 $1,999,999 $2,000,000 $2,249,999 1 1
$2,250,000 $2,499,999 $2,500,000 $2,749,999 $2,750,000 $2,999,999 $3,000,000 $3,249,999 $3,250,000 $3,499,999 $3,500,000 $3,749,999 $3,750,000 $3,999,999
$4,000,000 $4,249,999
$4,250,000 $4,499,999 $4,500,000 $4,749,999 $4,750,000 $4,999,999
$5,000,000 $5,499,999
$5,500,000 $5,999,999 $6,000,000 $6,499,999
$6,500,000 $6,999,999 $7,000,000 $7,499,999 $7,500,000 $7,999,999
$8,000,000 $8,999,999
$9,000,000 $9,999,999
$10,000,000 $10,999,999
$11,000,000 $11,999,999 $12,000,000 $14,999,999 $15,000,000 $20,000,000
REALTORS
Homes as of December 31, 2022
BUYER
DEMAND
/ INVESTOR ADVANTAGE
Sold Homes Days on Market Before Sold
DOM October November December Resold DOM New Cons New DOM Homes Resold Resold DOM New Cons New DOM Homes Resold Resold DOM New Cons New DOM 20 4 33 2 42 28 1 23 11 1 25 REALTORS DIGEST
Based on last 3 months of homes sales, Bel-Air has 7.9 months supply of inventory.
=
$-
Jan 01, 2019 to Dec 31, 2019 Jan 01, 2020 to Dec 31, 2020 Jan 01, 2021 to Dec 31, 2021 Jan 01, 2022 to Dec 31, 2022 Mid-Low Typical Home Price-Median Mid-High 4 YEAR
For questions, comments, a tailor-made report for your home area, or a complimentary home valuation please contact LeHoa Gacki LeHoa Gacki, DRE #01422855 Douglas Elliman Real Estate 11990 San Vicente Blvd., #100, L.A., Ca 90049 Email: Lehoa.Gacki@elliman.com Tel | Fax: (424) 276-7587 www.Lehoagacki.com | Lehoagacki.elliman.com 4 YEAR OBSERVATION Rancho Park Number of Homes Sold: 35 31 56 38 Jan 01, 2019 to Dec 31, 2019 Jan 01, 2020 to Dec 31, 2020 Jan 01, 2021 to Dec 31, 2021 Jan 01, 2022 to Dec 31, 2022 Actual Lowest Sold $1,100,000 $850,000 $720,000 $1,070,000 Mid-Low $1,256,500 $1,300,000 $1,500,000 $1,521,750 Typical Home Price-Median $1,402,000 $1,625,000 $1,645,000 $1,655,000 Mid-High $1,710,000 $1,800,000 $2,008,250 $2,115,000 Actual Highest Sold $2,769,000 $2,520,000 $2,905,000 $3,528,000 Average Price Sold $1,554,671 $1,616,637 $1,754,691 $1,828,546 12 MONTH
Rancho Park Cumulative 12 months sold home analysis from: January 01, 2022 to December 31, 2022 38 Sold Sold Price **Overbid / Underbid Square Feet Price per/SqFt YB LotSqFt BD BA Days on Market Actual Lowest Sold $1,070,000 93 1,124 $952 1940 3,456 2 2 20 Mid-Low* $1,521,750 98 1,294 $924 1941 5,688 3 2 9 Typical Home Price-Median* $1,655,000 101 1,648 $1,083 1945 6,090 3 2 12 Mid-High* $2,115,000 110 2,041 $1,222 1948 6,315 4 3 25 Actual Highest Sold $3,528,000 101 3,296 $1,070 2022 5,819 4 5 12 Average $1,828,546 104 1,872 $1,062 1950 6,015 3 3 18 **Overbid / Underbid: 100 is list price paid. Under 100 means sold for less than asking, over 100 sold probably in multiples and over asking. Note: Square Footage calculation could be more or less (+-) 20% difference. (Based on calculation.) * Middle Range Variance $593,250 Middle Range Variance is future range Typical Home Price (Median) Price will vary by. Never more, Never less. Source: TheMLS/CLAW (Combined Los Angeles Westside) © 2022 LEHOA GACKI. DRE# 01422855. ALL WORLDWIDE RIGHTS RESERVED. DOUGLAS ELLIMAN REAL ESTATE. 150 EL CAMINO DRIVE, BEVERLY HILLS, CA 90212. 310.595.3888. ALL MATERIAL PRESENTED HEREIN IS INTENDED FOR INFORMATION PURPOSES ONLY AND NOT INTENDED TO CONSTITUTE PROFESSIONAL ADVICE OR WARRANTY OUTSIDE THE REALM OF REAL ESTATE BROKERAGE. MAPS CREATED FOR REFERENCE PURPOSE ONLY. WHILE THIS INFORMATION IS BELIEVED TO BE CORRECT, IT IS REPRESENTED SUBJECT TO ERRORS, OMISSIONS, CHANGES OR WITHDRAWAL WITHOUT NOTICE. BASED ON DATA SOURCED FROM THE COMBINED LOS ANGELES WESTSIDE MULTIPLE LISTING SERVICE AND PUBLIC RECORDS. STATISTICS ARE SUBJECT TO CHANGE DUE TO INDIVIDUAL REAL ESTATE COMPANY REPORTING DISCIPLINES. BUYER ADVANTAGE OR SELLER ADVANTAGE IS STRICTLY OF THE OPINION OF LEHOA GACKI AND ACCURACY CANNOT BE GUARANTEED AND MAY NOT REFLECT ALL REAL ESTATE ACTIVITY ON THE MARKET. ALL PROPERTY INFORMATION, INCLUDING, BUT NOT LIMITED TO MAPS, GRAPHS, DEPICTIONS, SQUARE FOOTAGE, ROOM COUNT, NUMBER OF BEDROOMS AND THE SCHOOL DISTRICT IN PROPERTY LISTINGS SHOULD BE VERIFIED BY YOUR OWN ATTORNEY, ARCHITECT OR ZONING EXPERT. NEW CONSTRUCTION COUNT, SQUARE FOOTAGE AND YEAR BUILT IS BASED ON INDIVIDUAL REAL ESTATE
REPORTING AND MAY BE DIFFERENT THAN PUBLIC RECORDS. NEW CONSTRUCTION COUNT IS BASED ON LISTING BROKERAGE LISTING YEAR. THE BROKER/AGENT PROVIDING THE INFORMATION CONTAINED HEREIN MAY OR MAY HAVE NOT BEEN THE LISTING AND/OR SELLING AGENT. THIS IS
TO SOLICIT PROPERTY
LISTED.
COMBINED
LISTING SERVICE AND
RANCHO PARK
$1,256,500 $1,300,000 $1,500,000 $1,521,750 $1,402,000 $1,625,000 $1,645,000 $1,655,000 $1,710,000 $1,800,000 $2,008,250 $2,115,000
$500,000 $1,000,000 $1,500,000 $2,000,000 $2,500,000
TREND
OBSERVATION
COMPANY
NOT INTENDED
ALREADY
EQUAL HOUSING OPPORTUNITY. NEIGHBORHOOD BOUNDARY SOURCE: PUBLIC RECORDS,
LOS ANGELES WESTSIDE MULTIPLE
LOS ANGELES TIMES MAPPING L.A. https://maps.latimes.com/neighborhoods/index.html
$-
Jan 01 to Jun
Jul 01 to Dec 31,
Jan
Jul
Jul
Price Per Square Foot Average Price per
47 43 19 28 13 12 10 205 10 15 20 25 30 35 40 45 50 Jan 01 to Jun 30, 2019 Jul 01 to Dec 31, 2019 Jan 01 to Jun 30, 2020 Jul 01 to Dec 31, 2020 Jan 01 to Jun 30, 2021 Jul 01 to Dec 31, 2021 Jan 01 to Jun 30,
Jul 01 to Dec 31, 2022 Number of Homes Sold 16 19 9 22 28 28 21 17 Days
Sold END OF RANCHO PARK 6 PAGE REPORT SOLD HOME PRICE PER SQUARE FOOT
PRE & POST MAR 2020
RANCHO
DAYS
SOLD-
$765 $909 $910 $969 $903 $941 $1,137 $944 $819 $910 $919 $938 $932 $979 $1,105 $1,008
$200 $400 $600 $800 $1,000 $1,200
30, 2019
2019
01 to Jun 30, 2020
01 to Dec 31, 2020 Jan 01 to Jun 30, 2021
01 to Dec 31, 2021 Jan 01 to Jun 30, 2022 Jul 01 to Dec 31, 2022 Median
SquareFt
2022
on Market before
-
PANDEMIC
PARK
ON MARKET BEFORE
PRE & POST MAR 2020 PANDEMIC RANCHO PARK
WHAT YOUR MONEY BUYS YOU THIS MONTH: Santa Monica Home Analysis from: December 01, 2022 to December 31, 2022 12 Sold Sold Price **Overbid/ Underbid Square Feet Price per/SqFt YB LotSqFt BD BA Days on Market Actual Lowest Sold $1,800,000 100 1,366 $1,318 1940 6,509 3 2 6 Mid-Low* $2,192,500 94 1,376 $1,149 1930 5,283 3 2 7 Typical Home Price (Median)* $2,997,500 99 1,617 $1,525 1939 6,770 3 3 16 Mid-High* $4,200,000 100 3,251 $2,028 1966 7,507 4 5 46 Actual Highest Sold $5,410,000 90 4,000 $1,353 1928 12,155 6 6 109 Average $3,205,958 98 2,175 $1,599 1950 6,572 3 3 28 **Overbid/Underbid: 100 is list price paid. Under 100 means sold for less than asking, over 100 sold probably in multiples and over asking. Note: Square Footage calculation could be more or less (+-) 20% difference. (Based on calculation.) * Middle Range Variance $2,007,500 Middle Range Variance is future range Typical Home Price (Median) Price will vary by. Never more, Never less. Source: TheMLS/CLAW (Combined Los Angeles Westside) Single Family Homes December 2022 $2,997,500 TYPICAL HOME PRICE (MEDIAN) $1,525 SOLD PRICE PER SQUARE FOOT 16 DAYS ON MARKET BEFORE SOLD (DOM) $2,192,500 MID-LOW $4,200,000 MID-HIGH NEIGHBORING AREAS: Area Typical Home Price (Median) Price per/SqFt Days on Market Mid-Low Mid-High Pacific Palisades $3,917,500 $1,312 31 $2,933,750 $5,712,500 Brentwood $4,449,512 $1,383 18 $2,550,000 $8,525,000 Sawtelle $1,636,000 $824 38 $1,070,000 $1,748,000 Mar Vista $2,610,578 $1,162 14 $1,607,500 $3,731,250 Venice $2,162,500 $1,375 27 $1,555,000 $3,487,500 For questions, comments, a tailor-made report for your home area, or a complimentary home valuation please contact LeHoa Gacki LeHoa Gacki Douglas Elliman Real Estate DRE #01422855 Lehoa.Gacki@elliman.com www.LeHoaGacki.com 424.276.7587
Neighborhood Data Charts Los Angeles Real Estate L.N.D.C. DECEMBER 2022 Santa Monica A City in Los Angeles County
LeHoa’s
SANTA MONICA
Venice Mar Vista Pacific Palicades Sawtelle
Brentwood
Buyer or Seller Advantage by Price Point for Santa Monica as of December 31, 2022
4-6
Based on last 3 months of homes sales, Santa Monica has 3.7 months supply of inventory.
HOME PRICE RANGE
$80,000,000 $100,000,000 $70,000,000 $79,999,999 $60,000,000 $69,999,999 $50,000,000 $59,999,999 $40,000,000 $49,999,999 $30,000,000 $39,999,999 $25,000,000 $29,999,999
BUYER ADVANTAGE $20,000,000 $24,999,999
BUYER ADVANTAGE $17,500,000 $19,999,999
BUYER ADVANTAGE $15,000,000 $17,499,999
BUYER ADVANTAGE $13,500,000 $14,999,999
BUYER ADVANTAGE $12,000,000 $13,499,999
BUYER ADVANTAGE $10,000,000 $11,999,999
BUYER ADVANTAGE $9,000,000 $9,999,999
BUYER ADVANTAGE $8,000,000 $8,999,999 $7,000,000 $7,999,999
BUYER ADVANTAGE
BUYER ADVANTAGE
$6,500,000 $6,999,999 $6,000,000 $6,499,999
$5,500,000 $5,999,999 $5,000,000 $5,499,999
SELLER ADVANTAGE
SELLER ADVANTAGE
SELLER ADVANTAGE $4,500,000 $4,999,999
SELLER ADVANTAGE $4,000,000 $4,499,999
SELLER ADVANTAGE $3,500,000 $3,999,999
SELLER ADVANTAGE $3,000,000 $3,499,999
SELLER ADVANTAGE
SELLER ADVANTAGE $2,000,000 $2,499,999
$2,500,000 $2,999,999
SELLER ADVANTAGE $1,500,000 $1,999,999 SELLER ADVANTAGE $1,000,000 $1,499,999
SELLER ADVANTAGE
= BALANCED MARKET 3 and under FAVORS SELLER 7 and over FAVORS BUYER Months supply of Inventory =
Santa Monica Inventory for New Construction and Resale of Homes
SELLER
For Sale
Source: TheMLS/CLAW (Combined Los Angeles Westside)
Under Contract Pending - Closing Soon
New Construction New Con DOM Resale Resale DOM Home Price Range Homes Resold
5 7 6 65 40 90 13
1 2 55 $1,000,000 $1,499,999 1
1 1 2 75 $1,500,000 $1,999,999 1
1 6 120 $2,000,000 $2,499,999 1 3 56 $2,500,000 $2,999,999 2 2 4 42 $3,000,000 $3,499,999 4 1 1 32 1 73 $3,500,000 $3,999,999
1 1 4 119 $4,000,000 $4,499,999 2 1 1 67 1 87 $4,500,000 $4,999,999 2 65 $5,000,000 $5,499,999 1 1 42 $5,500,000 $5,999,999 $6,000,000 $6,499,999 1 81 $6,500,000 $6,999,999 1 2 81 $7,000,000 $7,999,999 1 4 $8,000,000 $8,999,999
1 3 97 $9,000,000 $9,999,999
1 108 2 144 $10,000,000 $11,999,999 1
1 81 1 73 $12,000,000 $13,499,999 1 73 1 70 $13,500,000 $14,999,999 2 153 $15,000,000 $17,499,999
1 31 $17,500,000 $19,999,999 1 191 $20,000,000 $24,999,999 $25,000,000 $29,999,999 $30,000,000 $39,999,999 $40,000,000 $49,999,999 $50,000,000 $59,999,999 $60,000,000 $69,999,999 $70,000,000 $79,999,999 $80,000,000 $100,000,000
ADVANTAGE SUPPLY & DEMAND
REALTORS
Homes as of December 31, 2022
DEMAND BUYER / INVESTOR ADVANTAGE
November December
DOM New Cons New DOM Homes Resold Resold DOM New Cons New DOM
Resold DOM New Cons New DOM 37 12
12
8 1
16 2
11 4
64
44
26 1
1
1
1
19 REALTORS DIGEST
Based on last 3 months of homes sales, Bel-Air has 7.9 months supply of inventory. Sold Homes Days on Market Before Sold = DOM October
Resold
Homes Resold
46
28
34
45 1 6
62 4 20
1 9
2 30 1 9
71 1 14
7 1 48 80 1 48 1 109
22
30
$-
$2,000,000
Jan 01, 2019 to Dec 31, 2019 Jan 01, 2020 to Dec 31, 2020 Jan 01, 2021 to Dec 31, 2021 Jan 01, 2022 to Dec 31, 2022 Mid-Low Typical Home Price-Median Mid-High 4 YEAR TREND For questions, comments, a tailor-made report for your home area, or a complimentary home valuation please contact LeHoa Gacki LeHoa Gacki, DRE #01422855 Douglas Elliman Real Estate 11990 San Vicente Blvd., #100, L.A., Ca 90049 Email: Lehoa.Gacki@elliman.com Tel | Fax: (424) 276-7587 www.Lehoagacki.com | Lehoagacki.elliman.com 4 YEAR OBSERVATION Santa Monica Number of Homes Sold: 209 227 342 209 Jan 01, 2019 to Dec 31, 2019 Jan 01, 2020 to Dec 31, 2020 Jan 01, 2021 to Dec 31, 2021 Jan 01, 2022 to Dec 31, 2022 Actual Lowest Sold $835,000 $725,000 $1,150,000 $1,000,000 Mid-Low $1,825,000 $1,925,000 $2,392,231 $2,550,000 Typical Home Price-Median $2,706,500 $2,752,100 $3,362,500 $3,750,000 Mid-High $4,045,259 $4,050,000 $5,100,000 $5,627,500 Actual Highest Sold $16,000,000 $9,300,000 $48,674,649 $19,500,000 Average Price Sold $3,266,958 $3,194,046 $4,114,883 $4,355,172 12 MONTH
Santa Monica Cumulative 12 months sold home analysis from: January 01, 2022 to December 31, 2022 209 Sold Sold Price **Overbid / Underbid Square Feet Price per/SqFt YB LotSqFt BD BA Days on Market Actual Lowest Sold $1,000,000 80 1,626 $615 1969 8,944 4 2 44 Mid-Low* $2,550,000 97 1,585 $1,215 1927 5,872 3 2 9 Typical Home Price-Median* $3,750,000 101 2,517 $1,534 1941 7,230 4 3 15 Mid-High* $5,627,500 106 3,847 $1,771 1983 8,521 5 5 39 Actual Highest Sold $19,500,000 98 12,379 $1,575 2021 20,807 7 12 91 Average $4,355,172 103 2,942 $1,558 1954 7,779 4 4 31 **Overbid / Underbid: 100 is list price paid. Under 100 means sold for less than asking, over 100 sold probably in multiples and over asking. Note: Square Footage calculation could be more or less (+-) 20% difference. (Based on calculation.) * Middle Range Variance $3,077,500 Middle Range Variance is future range Typical Home Price (Median) Price will vary by. Never more, Never less. Source: TheMLS/CLAW (Combined Los Angeles Westside) © 2022 LEHOA GACKI. DRE# 01422855. ALL WORLDWIDE RIGHTS RESERVED. DOUGLAS ELLIMAN REAL ESTATE. 150 EL CAMINO DRIVE, BEVERLY HILLS, CA 90212. 310.595.3888. ALL MATERIAL PRESENTED HEREIN IS INTENDED FOR INFORMATION PURPOSES ONLY AND NOT INTENDED TO CONSTITUTE PROFESSIONAL ADVICE OR WARRANTY OUTSIDE THE REALM OF REAL ESTATE BROKERAGE. MAPS CREATED FOR REFERENCE PURPOSE ONLY. WHILE THIS INFORMATION IS BELIEVED TO BE CORRECT, IT IS REPRESENTED SUBJECT TO ERRORS, OMISSIONS, CHANGES OR WITHDRAWAL WITHOUT NOTICE. BASED ON DATA SOURCED FROM THE COMBINED LOS ANGELES WESTSIDE MULTIPLE LISTING SERVICE AND PUBLIC RECORDS. STATISTICS ARE SUBJECT TO CHANGE DUE TO INDIVIDUAL REAL ESTATE COMPANY REPORTING DISCIPLINES. BUYER ADVANTAGE OR SELLER ADVANTAGE IS STRICTLY OF THE OPINION OF LEHOA GACKI AND ACCURACY CANNOT BE GUARANTEED AND MAY NOT REFLECT ALL REAL ESTATE ACTIVITY ON THE MARKET. ALL PROPERTY INFORMATION, INCLUDING, BUT NOT LIMITED TO MAPS, GRAPHS, DEPICTIONS, SQUARE FOOTAGE, ROOM COUNT, NUMBER OF BEDROOMS AND THE SCHOOL DISTRICT IN PROPERTY LISTINGS SHOULD BE VERIFIED BY YOUR OWN ATTORNEY, ARCHITECT OR ZONING EXPERT. NEW CONSTRUCTION COUNT, SQUARE FOOTAGE AND YEAR BUILT IS BASED ON INDIVIDUAL REAL ESTATE COMPANY REPORTING AND MAY BE DIFFERENT THAN PUBLIC RECORDS. NEW CONSTRUCTION COUNT IS BASED ON LISTING BROKERAGE LISTING YEAR. THE BROKER/AGENT PROVIDING THE INFORMATION CONTAINED HEREIN MAY OR MAY HAVE NOT BEEN THE
THIS
SOLICIT
LISTED.
MONICA
$1,825,000 $1,925,000 $2,392,231 $2,550,000 $2,706,500 $2,752,100 $3,362,500 $3,750,000 $4,045,259 $4,050,000 $5,100,000 $5,627,500
$1,000,000
$3,000,000 $4,000,000 $5,000,000 $6,000,000
OBSERVATION
LISTING AND/OR SELLING AGENT.
IS NOT INTENDED TO
PROPERTY ALREADY
EQUAL HOUSING OPPORTUNITY. NEIGHBORHOOD BOUNDARY SOURCE: PUBLIC RECORDS, COMBINED LOS ANGELES WESTSIDE MULTIPLE LISTING SERVICE AND LOS ANGELES TIMES MAPPING L.A. https://maps.latimes.com/neighborhoods/index.html SANTA
$1,390
$1,501
$1,513
$1,241 $1,303 $1,302
$1,229 $1,189 $1,121
36 40 15 20 18 14 13 185 10 15 20 25 30 35 40 45 Jan 01 to Jun 30, 2019 Jul 01 to Dec 31, 2019 Jan 01 to Jun 30, 2020 Jul 01 to Dec 31,
Jan
Jun
Jul
Number
Sold 91 118 84 143 151 191 110 99 Days
END OF
MONICA 6 PAGE REPORT
$1,552
$1,343 $1,247 $1,222 $1,305 $1,395
$1,612
$$200 $400 $600 $800 $1,000 $1,200 $1,400 $1,600 $1,800 Jan 01 to Jun 30, 2019 Jul 01 to Dec 31, 2019 Jan 01 to Jun 30, 2020 Jul 01 to Dec 31, 2020 Jan 01 to Jun 30, 2021 Jul 01 to Dec 31, 2021 Jan 01 to Jun 30, 2022 Jul 01 to Dec 31, 2022 Median Price Per Square Foot Average Price per SquareFt
2020
01 to
30, 2021
01 to Dec 31, 2021 Jan 01 to Jun 30, 2022 Jul 01 to Dec 31, 2022
of Homes
on Market before Sold
SANTA
SOLD HOME PRICE PER SQUARE FOOT - PRE & POST MAR 2020 PANDEMIC
SANTA MONICA DAYS ON MARKET BEFORE SOLD- PRE & POST MAR 2020 PANDEMIC SANTA MONICA
WHAT YOUR MONEY BUYS YOU THIS MONTH: Sawtelle Home Analysis from: December 01, 2022 to December 31, 2022 3 Sold Sold Price **Overbid/ Underbid Square Feet Price per/SqFt YB LotSqFt BD BA Days on Market Actual Lowest Sold $1,070,000 91 1,493 $717 1940 5,531 3 2 38 Typical Home Price (Median)* $1,636,000 97 1,563 $824 1941 5,531 3 2 38 Actual Highest Sold $1,748,000 97 2,122 $824 2022 2,616 3 4 79 Average $1,484,667 96 1,726 $862 1968 4,791 3 3 52 **Overbid/Underbid: 100 is list price paid. Under 100 means sold for less than asking, over 100 sold probably in multiples and over asking. Note: Square Footage calculation could be more or less (+-) 20% difference. (Based on calculation.) Source: TheMLS/CLAW (Combined Los Angeles Westside) NEIGHBORING AREAS: Area Typical Home Price (Median) Price per/SqFt Days on Market Mid-Low Mid-High Brentwood $4,449,512 $1,383 18 $2,550,000 $8,525,000 Westwood $2,225,000 $1,136 22 $2,000,000 $2,431,550 West Los Angeles $1,925,000 $1,303 20 $1,711,250 $2,545,375 Rancho Park $1,655,000 $1,083 12 $1,521,750 $2,115,000 Palms $1,515,000 $951 52 $1,175,000 $2,195,000 Mar Vista $2,610,578 $1,162 14 $1,607,500 $3,731,250 Santa Monica $2,997,500 $1,525 16 $2,192,500 $4,200,000 For questions, comments, a tailor-made report for your home area, or a complimentary home valuation please contact LeHoa Gacki LeHoa Gacki Douglas Elliman Real Estate DRE #01422855 Lehoa.Gacki@elliman.com www.LeHoaGacki.com 424.276.7587 LeHoa’s Neighborhood Data Charts Los Angeles Real Estate L.N.D.C. DECEMBER 2022 Sawtelle A neighborhood in the City of Los Angeles SAWTELLE Brentwood Westwood West Los Angeles Santa Monica Mar Vista Rancho Park Palms Single Family Homes December 2022 $1,636,000 TYPICAL HOME PRICE (MEDIAN) $824 SOLD PRICE PER SQUARE FOOT 38 DAYS ON MARKET BEFORE SOLD (DOM) $1,070,000 ACTUAL LOWEST SOLD $1,748,000 ACTUAL HIGHEST SOLD
Buyer or Seller Advantage by Price Point for Sawtelle as of December 31, 2022
Months supply of Inventory =
Based on last 3 months of homes sales, Sawtelle has 1.5 months supply of inventory.
HOME PRICE RANGE
$6,000,000 $10,000,000 $5,000,000 $5,999,999 $4,450,000 $4,999,999 $4,300,000 $4,449,999 $4,150,000 $4,299,999 $4,000,000 $4,149,999 $3,850,000 $3,999,999 $3,700,000 $3,849,999 $3,550,000 $3,699,999
BUYER ADVANTAGE $3,400,000 $3,549,999
BUYER ADVANTAGE $3,250,000 $3,399,999 $3,100,000 $3,249,999
BUYER ADVANTAGE $2,950,000 $3,099,999 $2,800,000 $2,949,999 $2,650,000 $2,799,999
BUYER ADVANTAGE $2,500,000 $2,649,999
BUYER ADVANTAGE
$2,350,000 $2,499,999 $2,200,000 $2,349,999 $2,050,000 $2,199,999
4-6 = BALANCED MARKET 3 and under FAVORS SELLER 7 and over FAVORS BUYER
SELLER ADVANTAGE
SELLER ADVANTAGE $1,900,000 $2,049,999
SELLER ADVANTAGE $1,750,000 $1,899,999
SELLER ADVANTAGE $1,600,000 $1,749,999
SELLER ADVANTAGE $1,450,000 $1,599,999
SELLER ADVANTAGE $1,300,000 $1,449,999
SELLER ADVANTAGE $1,150,000 $1,299,999
$1,000,000 $1,149,999
SELLER ADVANTAGE
SELLER ADVANTAGE $750,000 $999,999
SELLER ADVANTAGE $500,000 $749,999
Sawtelle Inventory for New Construction and Resale of Homes as
SELLER ADVANTAGE SUPPLY & DEMAND
For Sale
Source: TheMLS/CLAW (Combined Los Angeles Westside)
Under Contract Pending - Closing Soon
New Construction New Con DOM Resale Resale DOM Home Price Range Homes Resold
2 5 6 60 3
$500,000 $749,999 1 $750,000 $999,999 $1,000,000 $1,149,999 1 $1,150,000 $1,299,999 1 $1,300,000 $1,449,999 1
2 $1,450,000 $1,599,999 2 1 $1,600,000 $1,749,999 1 1 32 $1,750,000 $1,899,999 $1,900,000 $2,049,999 $2,050,000 $2,199,999 $2,200,000 $2,349,999 1 96 $2,350,000 $2,499,999 1 53 $2,500,000 $2,649,999 $2,650,000 $2,799,999 $2,800,000 $2,949,999 1 94 $2,950,000 $3,099,999 $3,100,000 $3,249,999 1 35 $3,250,000 $3,399,999 1 47 $3,400,000 $3,549,999
$3,550,000 $3,699,999 $3,700,000 $3,849,999 $3,850,000 $3,999,999
$4,000,000 $4,149,999 $4,150,000 $4,299,999
$4,300,000 $4,449,999 $4,450,000 $4,999,999 $5,000,000 $5,999,999 $6,000,000 $10,000,000
REALTORS
as of December 31, 2022
DEMAND BUYER / INVESTOR ADVANTAGE
DOM New Cons New DOM Homes Resold
Cons
REALTORS DIGEST
Based on last 3 months of homes sales, Bel-Air has 7.9 months supply of inventory. Sold Homes Days on Market Before Sold = DOM October November December Resold
Resold DOM New
New DOM Homes Resold Resold DOM New Cons New DOM 24 6 22 2 38 1 79 1 1 1 38 1 25 33 20 1 38 1 79 1 47 2 24 1 13
OBSERVATION
Jan 01, 2019 to Dec 31, 2019 Jan 01, 2020 to Dec 31, 2020 Jan 01, 2021 to Dec 31, 2021 Jan 01, 2022 to Dec 31, 2022 Mid-Low Typical Home Price-Median Mid-High 4 YEAR
For questions, comments, a tailor-made report for your home area, or a complimentary home valuation please contact LeHoa Gacki LeHoa Gacki, DRE #01422855 Douglas Elliman Real Estate 11990 San Vicente Blvd., #100, L.A., Ca 90049 Email: Lehoa.Gacki@elliman.com Tel | Fax: (424) 276-7587 www.Lehoagacki.com | Lehoagacki.elliman.com 4 YEAR OBSERVATION Sawtelle Number of Homes Sold: 77 78 91 66 Jan 01, 2019 to Dec 31, 2019 Jan 01, 2020 to Dec 31, 2020 Jan 01, 2021 to Dec 31, 2021 Jan 01, 2022 to Dec 31, 2022 Actual Lowest Sold $810,000 $925,000 $879,120 $1,050,000 Mid-Low $1,185,000 $1,260,500 $1,288,000 $1,338,750 Typical Home Price-Median $1,300,000 $1,565,000 $1,560,000 $1,665,000 Mid-High $1,650,000 $1,791,000 $1,800,000 $2,200,000 Actual Highest Sold $3,175,000 $3,000,000 $3,350,000 $3,270,000 Average Price Sold $1,470,310 $1,574,466 $1,659,192 $1,802,672 12 MONTH
Sawtelle Cumulative 12 months sold home analysis from: January 01, 2022 to December 31, 2022 66 Sold Sold Price **Overbid / Underbid Square Feet Price per/SqFt YB LotSqFt BD BA Days on Market Actual Lowest Sold $1,050,000 95 1,178 $891 1947 4,238 3 1 231 Mid-Low* $1,338,750 97 1,234 $824 1940 4,792 2 2 11 Typical Home Price-Median* $1,665,000 100 1,618 $1,039 1946 5,514 3 2 18 Mid-High* $2,200,000 108 2,340 $1,231 1960 6,243 3 3 35 Actual Highest Sold $3,270,000 122 2,558 $1,278 1940 5,902 3 4 6 Average $1,802,672 103 1,791 $1,074 1956 5,378 3 2 28 **Overbid / Underbid: 100 is list price paid. Under 100 means sold for less than asking, over 100 sold probably in multiples and over asking. Note: Square Footage calculation could be more or less (+-) 20% difference. (Based on calculation.) * Middle Range Variance $861,250 Middle Range Variance is future range Typical Home Price (Median) Price will vary by. Never more, Never less. Source: TheMLS/CLAW (Combined Los Angeles Westside) © 2022 LEHOA GACKI. DRE# 01422855. ALL WORLDWIDE RIGHTS RESERVED. DOUGLAS ELLIMAN REAL ESTATE. 150 EL CAMINO DRIVE, BEVERLY HILLS, CA 90212. 310.595.3888. ALL MATERIAL PRESENTED HEREIN IS INTENDED FOR INFORMATION PURPOSES ONLY AND NOT INTENDED TO CONSTITUTE PROFESSIONAL ADVICE OR WARRANTY OUTSIDE THE REALM OF REAL ESTATE BROKERAGE. MAPS CREATED FOR REFERENCE PURPOSE ONLY. WHILE THIS INFORMATION IS BELIEVED TO BE CORRECT, IT IS REPRESENTED SUBJECT TO ERRORS, OMISSIONS, CHANGES OR WITHDRAWAL WITHOUT NOTICE. BASED ON DATA SOURCED FROM THE COMBINED LOS ANGELES WESTSIDE MULTIPLE LISTING SERVICE AND PUBLIC RECORDS. STATISTICS ARE SUBJECT TO CHANGE DUE TO INDIVIDUAL REAL ESTATE COMPANY REPORTING DISCIPLINES. BUYER ADVANTAGE OR SELLER ADVANTAGE IS STRICTLY OF THE OPINION OF LEHOA GACKI AND ACCURACY CANNOT BE GUARANTEED AND MAY NOT REFLECT ALL REAL ESTATE ACTIVITY ON THE MARKET. ALL PROPERTY INFORMATION, INCLUDING, BUT NOT LIMITED TO MAPS, GRAPHS, DEPICTIONS, SQUARE FOOTAGE, ROOM COUNT, NUMBER OF BEDROOMS AND THE SCHOOL DISTRICT IN PROPERTY LISTINGS SHOULD BE VERIFIED BY YOUR OWN ATTORNEY, ARCHITECT OR ZONING EXPERT. NEW CONSTRUCTION COUNT, SQUARE FOOTAGE AND YEAR BUILT IS BASED ON INDIVIDUAL REAL ESTATE COMPANY REPORTING AND MAY BE DIFFERENT THAN PUBLIC RECORDS. NEW CONSTRUCTION COUNT IS BASED ON LISTING BROKERAGE LISTING YEAR. THE BROKER/AGENT PROVIDING THE INFORMATION CONTAINED HEREIN MAY OR MAY HAVE NOT BEEN THE LISTING AND/OR SELLING AGENT. THIS IS NOT INTENDED TO SOLICIT PROPERTY ALREADY LISTED. EQUAL
COMBINED
LISTING
AND
SAWTELLE
$1,185,000 $1,260,500 $1,288,000 $1,338,750 $1,300,000 $1,565,000 $1,560,000 $1,665,000 $1,650,000 $1,791,000 $1,800,000 $2,200,000 $$500,000 $1,000,000 $1,500,000 $2,000,000 $2,500,000
TREND
HOUSING OPPORTUNITY. NEIGHBORHOOD BOUNDARY SOURCE: PUBLIC RECORDS,
LOS ANGELES WESTSIDE MULTIPLE
SERVICE
LOS ANGELES TIMES MAPPING L.A. https://maps.latimes.com/neighborhoods/index.html
$-
Jan 01 to Jun 30, 2019 Jul 01 to Dec 31, 2019 Jan 01 to Jun 30, 2020 Jul 01 to Dec 31, 2020 Jan 01 to Jun
Jul 01 to Dec 31,
Jan
Jun
Jul 01
Median Price Per Square Foot Average Price per SquareFt 31 36 15 18 27 23 14 285 10 15 20 25 30 35 40 Jan 01 to Jun 30, 2019 Jul 01 to Dec 31, 2019 Jan 01 to Jun 30, 2020 Jul 01 to Dec 31, 2020 Jan 01 to Jun 30, 2021 Jul 01 to Dec 31, 2021 Jan 01 to Jun 30, 2022 Jul 01 to Dec 31, 2022 Number of Homes Sold 43 34 28 50 41 50 35 31 Days on Market before Sold END OF SAWTELLE 6 PAGE REPORT SOLD HOME PRICE PER SQUARE FOOT - PRE & POST MAR 2020 PANDEMIC SAWTELLE DAYS ON MARKET BEFORE SOLD- PRE & POST MAR 2020 PANDEMIC SAWTELLE
$778 $844 $885 $959 $934 $967 $1,080 $1,028 $835 $899 $937 $954 $1,018 $1,028 $1,080 $1,067
$200 $400 $600 $800 $1,000 $1,200
30, 2021
2021
01 to
30, 2022
to Dec 31, 2022
WHAT YOUR MONEY BUYS YOU THIS MONTH: Venice Home Analysis from: December 01, 2022 to December 31, 2022 16 Sold Sold Price **Overbid/ Underbid Square Feet Price per/SqFt YB LotSqFt BD BA Days on Market Actual Lowest Sold $1,199,900 100 798 $1,504 1953 2,864 2 1 119 Mid-Low* $1,555,000 91 846 $1,143 1924 2,934 2 1 12 Typical Home Price (Median)* $2,162,500 97 1,769 $1,375 1948 3,894 3 2 27 Mid-High* $3,487,500 100 3,212 $1,795 2004 5,824 3 4 76 Actual Highest Sold $7,700,000 90 4,588 $1,678 2022 3,150 4 6 22 Average $2,881,088 98 2,104 $1,498 1960 4,268 3 3 51 **Overbid/Underbid: 100 is list price paid. Under 100 means sold for less than asking, over 100 sold probably in multiples and over asking. Note: Square Footage calculation could be more or less (+-) 20% difference. (Based on calculation.) * Middle Range Variance $1,932,500 Middle Range Variance is future range Typical Home Price (Median) Price will vary by. Never more, Never less. Source: TheMLS/CLAW (Combined Los Angeles Westside) Single Family Homes December 2022 $2,162,500 TYPICAL HOME PRICE (MEDIAN) $1,375 SOLD PRICE PER SQUARE FOOT 27 DAYS ON MARKET BEFORE SOLD (DOM) $1,555,000 MID-LOW $3,487,500 MID-HIGH NEIGHBORING AREAS: Area Typical Home Price (Median) Price per/SqFt Days on Market Mid-Low Mid-High Santa Monica $2,997,500 $1,525 $16 $2,192,500 $4,200,000 Mar Vista $2,610,578 $1,162 $14 $1,607,500 $3,731,250 Culver City $1,870,000 $1,044 $11 $1,571,500 $2,041,250 Del Rey $1,870,000 $1,044 $11 $1,571,500 $2,041,250 Marina Del Rey $2,700,000 $891 $22 VENICE Marina Del Rey Del Rey Mar Vista Santa Monica Culver City LeHoa’s Neighborhood Data Charts Los Angeles Real Estate L.N.D.C. DECEMBER 2022 For questions, comments, a tailor-made report for your home area, or a complimentary home valuation please contact LeHoa Gacki LeHoa Gacki Douglas Elliman Real Estate DRE #01422855 Lehoa.Gacki@elliman.com www.LeHoaGacki.com 424.276.7587 Venice A neighborhood in the City of Los Angeles
Buyer or Seller Advantage by Price Point for Venice as of December 31, 2022
Based on last 3 months of homes sales, Venice has 4.6 months supply of inventory.
HOME PRICE RANGE
$15,000,000 $20,000,000 $12,000,000 $14,999,999 $11,000,000 $11,999,999 $10,000,000 $10,999,999
BUYER ADVANTAGE $9,000,000 $9,999,999
BUYER ADVANTAGE $8,000,000 $8,999,999
BUYER ADVANTAGE $7,500,000 $7,999,999 $7,000,000 $7,499,999
BUYER ADVANTAGE $6,500,000 $6,999,999 $6,000,000 $6,499,999
BUYER ADVANTAGE $5,500,000 $5,999,999 $4,750,000 $5,499,999
BUYER ADVANTAGE $4,500,000 $4,749,999 $4,250,000 $4,499,999 $4,000,000 $4,249,999 $3,750,000 $3,999,999 $3,500,000 $3,749,999
BUYER ADVANTAGE $3,250,000 $3,499,999
BUYER ADVANTAGE $3,000,000 $3,249,999 $2,750,000 $2,999,999
SELLER
ADVANTAGE
SELLER ADVANTAGE
SELLER ADVANTAGE
SELLER ADVANTAGE $2,500,000 $2,749,999
SELLER ADVANTAGE $2,250,000 $2,499,999
SELLER ADVANTAGE $2,000,000 $2,249,999
SELLER ADVANTAGE $1,750,000 $1,999,999
SELLER ADVANTAGE
SELLER ADVANTAGE $1,250,000 $1,499,999
$1,500,000 $1,749,999
SELLER ADVANTAGE $1,000,000 $1,249,999 SELLER ADVANTAGE $750,000 $999,999
4-6 = BALANCED MARKET 3 and under FAVORS SELLER 7 and over FAVORS BUYER
Months supply of Inventory =
Venice Inventory for New Construction and Resale of Homes as of
For Sale
Source: TheMLS/CLAW (Combined Los Angeles Westside)
Under Contract Pending - Closing Soon
New Construction New Con DOM Resale Resale DOM Home Price Range Homes Resold
12 6 5 40 64 102 12
$750,000 $999,999 $1,000,000 $1,249,999 1 2 $1,250,000 $1,499,999 1
3 5 72 $1,500,000 $1,749,999 1 2 7 66 $1,750,000 $1,999,999 2
1 1 3 124 $2,000,000 $2,249,999 1
1 1 6 89 $2,250,000 $2,499,999 2
1 2 135 $2,500,000 $2,749,999 1 1 1 19 $2,750,000 $2,999,999 1 6 160 $3,000,000 $3,249,999
1 60 2 70 $3,250,000 $3,499,999
1 42 2 32 $3,500,000 $3,749,999 1
1 54 3 111 $3,750,000 $3,999,999 2 57 $4,000,000 $4,249,999
1 3 113 $4,250,000 $4,499,999
1 25 3 103 $4,500,000 $4,749,999
1 3 112 $4,750,000 $5,499,999 6 153 $5,500,000 $5,999,999 1
2 1 31 $6,000,000 $6,499,999 1 68 $6,500,000 $6,999,999 1 196 $7,000,000 $7,499,999
1 17 2 109 $7,500,000 $7,999,999 2 88 $8,000,000 $8,999,999 3 94 $9,000,000 $9,999,999 $10,000,000 $10,999,999 $11,000,000 $11,999,999 1 $12,000,000 $14,999,999 $15,000,000 $20,000,000
SELLER ADVANTAGE SUPPLY & DEMAND
REALTORS
of December 31, 2022
BUYER
DOM New Cons New DOM Homes Resold Resold
New Cons
Cons
REALTORS DIGEST
DEMAND
/ INVESTOR ADVANTAGE Based on last 3 months of homes sales, Bel-Air has 7.9 months supply of inventory. Sold Homes Days on Market Before Sold = DOM October November December Resold
DOM
New DOM Homes Resold Resold DOM New
New DOM 53 1 91 13 27 3 101 14 52 2 44 177 2 104 36 14 2 21 4 15 21 3 30 1 25 24 2 60 3 28 46 2 15 1 14 12 1 15 99 1 27 1 31 1 19 105 1 13 1 79 1 240 1 66 1 13 1 91 1 39 41 1 238 1 22
Jan 01, 2019 to Dec 31, 2019 Jan 01, 2020 to Dec 31, 2020 Jan 01, 2021 to Dec 31, 2021 Jan 01, 2022 to Dec 31, 2022 Mid-Low Typical Home Price-Median Mid-High 4 YEAR TREND For questions, comments, a tailor-made report for your home area, or a complimentary home valuation please contact LeHoa Gacki LeHoa Gacki, DRE #01422855 Douglas Elliman Real Estate 11990 San Vicente Blvd., #100, L.A., Ca 90049 Email: Lehoa.Gacki@elliman.com Tel | Fax: (424) 276-7587 www.Lehoagacki.com | Lehoagacki.elliman.com 4 YEAR OBSERVATION Venice Number of Homes Sold: 200 245 353 267 Jan 01, 2019 to Dec 31, 2019 Jan 01, 2020 to Dec 31, 2020 Jan 01, 2021 to Dec 31, 2021 Jan 01, 2022 to Dec 31, 2022 Actual Lowest Sold $1,025,000 $750,000 $660,000 $950,000 Mid-Low $1,606,175 $1,700,000 $1,725,000 $1,900,000 Typical Home Price-Median $2,062,500 $2,075,000 $2,245,000 $2,400,000 Mid-High $2,750,000 $2,760,000 $2,950,000 $3,350,000 Actual Highest Sold $6,750,000 $9,050,000 $9,000,000 $7,700,000 Average Price Sold $2,315,381 $2,340,618 $2,531,545 $2,700,079 12 MONTH OBSERVATION Venice Cumulative 12 months sold home analysis from: January 01, 2022 to December 31, 2022 267 Sold Sold Price **Overbid / Underbid Square Feet Price per/SqFt YB LotSqFt BD BA Days on Market Actual Lowest Sold $950,000 97 484 $1,963 1922 1,573 1 1 138 Mid-Low* $1,900,000 96 1,310 $1,024 1924 2,849 3 2 10 Typical Home Price-Median* $2,400,000 100 1,965 $1,269 1952 3,851 3 3 20 Mid-High* $3,350,000 104 2,900 $1,559 2005 5,198 4 4 58 Actual Highest Sold $7,700,000 90 4,588 $1,678 2022 3,150 4 6 22 Average $2,700,079 100 2,225 $1,347 1962 4,281 3 3 42 **Overbid / Underbid: 100 is list price paid. Under 100 means sold for less than asking, over 100 sold probably in multiples and over asking. Note: Square Footage calculation could be more or less (+-) 20% difference. (Based on calculation.) * Middle Range Variance $1,450,000 Middle Range Variance is future range Typical Home Price (Median) Price will vary by. Never more, Never less. Source: TheMLS/CLAW (Combined Los Angeles Westside) © 2022 LEHOA GACKI. DRE# 01422855. ALL WORLDWIDE RIGHTS RESERVED. DOUGLAS ELLIMAN REAL ESTATE. 150 EL CAMINO DRIVE, BEVERLY HILLS, CA 90212. 310.595.3888. ALL MATERIAL PRESENTED HEREIN IS INTENDED FOR INFORMATION PURPOSES ONLY AND NOT INTENDED TO CONSTITUTE PROFESSIONAL ADVICE OR WARRANTY OUTSIDE THE REALM OF REAL ESTATE BROKERAGE. MAPS CREATED FOR REFERENCE PURPOSE ONLY. WHILE THIS INFORMATION IS BELIEVED TO BE CORRECT, IT IS REPRESENTED SUBJECT TO ERRORS, OMISSIONS, CHANGES OR WITHDRAWAL WITHOUT NOTICE. BASED ON DATA SOURCED FROM THE COMBINED LOS ANGELES WESTSIDE MULTIPLE LISTING SERVICE AND PUBLIC RECORDS. STATISTICS ARE SUBJECT TO CHANGE DUE TO INDIVIDUAL REAL ESTATE COMPANY REPORTING DISCIPLINES. BUYER ADVANTAGE OR SELLER ADVANTAGE IS STRICTLY OF THE OPINION OF LEHOA GACKI AND ACCURACY CANNOT BE GUARANTEED AND MAY NOT REFLECT ALL REAL ESTATE ACTIVITY ON THE MARKET. ALL PROPERTY INFORMATION, INCLUDING, BUT NOT LIMITED TO MAPS, GRAPHS, DEPICTIONS, SQUARE FOOTAGE, ROOM COUNT, NUMBER OF BEDROOMS AND THE SCHOOL DISTRICT IN PROPERTY LISTINGS SHOULD BE VERIFIED BY YOUR OWN ATTORNEY, ARCHITECT OR ZONING EXPERT. NEW CONSTRUCTION COUNT, SQUARE FOOTAGE AND YEAR BUILT IS BASED ON INDIVIDUAL REAL ESTATE COMPANY REPORTING AND MAY BE DIFFERENT THAN PUBLIC RECORDS. NEW CONSTRUCTION COUNT IS BASED ON LISTING BROKERAGE LISTING YEAR. THE BROKER/AGENT PROVIDING THE INFORMATION CONTAINED HEREIN MAY OR MAY HAVE NOT BEEN THE LISTING AND/OR SELLING AGENT. THIS IS NOT INTENDED TO SOLICIT PROPERTY ALREADY LISTED. EQUAL
PUBLIC RECORDS, COMBINED
LISTING SERVICE AND
TIMES
VENICE
$1,606,175 $1,700,000 $1,725,000 $1,900,000 $2,062,500 $2,075,000 $2,245,000 $2,400,000 $2,750,000 $2,760,000 $2,950,000 $3,350,000 $$500,000 $1,000,000 $1,500,000 $2,000,000 $2,500,000 $3,000,000 $3,500,000 $4,000,000
HOUSING OPPORTUNITY. NEIGHBORHOOD BOUNDARY SOURCE:
LOS ANGELES WESTSIDE MULTIPLE
LOS ANGELES
MAPPING L.A. https://maps.latimes.com/neighborhoods/index.html
$1,339
34 42 37 31 32 33 15 255 10 15 20 25 30 35 40 45 Jan 01 to Jun
2019 Jul 01 to Dec 31, 2019 Jan
to Jun
Jul
Dec
89 111 83 162 171 182 165
END OF VENICE 6 PAGE REPORT
$1,062 $1,100 $1,076 $1,045 $1,132 $1,148 $1,269 $1,267 $1,185 $1,165 $1,132 $1,153 $1,197 $1,231 $1,351
$$200 $400 $600 $800 $1,000 $1,200 $1,400 $1,600 Jan 01 to Jun 30, 2019 Jul 01 to Dec 31, 2019 Jan 01 to Jun 30, 2020 Jul 01 to Dec 31, 2020 Jan 01 to Jun 30, 2021 Jul 01 to Dec 31, 2021 Jan 01 to Jun 30, 2022 Jul 01 to Dec 31, 2022 Median Price Per Square Foot Average Price per SquareFt
30,
01
30, 2020
01 to
31, 2020 Jan 01 to Jun 30, 2021 Jul 01 to Dec 31, 2021 Jan 01 to Jun 30, 2022 Jul 01 to Dec 31, 2022 Number of Homes Sold
102 Days on Market before Sold
SOLD HOME PRICE PER SQUARE FOOT - PRE & POST MAR 2020 PANDEMIC VENICE DAYS ON MARKET BEFORE SOLD- PRE & POST MAR 2020 PANDEMIC VENICE
WHAT YOUR MONEY BUYS YOU THIS MONTH: West Los Angeles Home Analysis from: December 01, 2022 to December 31, 2022 2 Sold Sold Price **Overbid/ Underbid Square Feet Price per/SqFt YB LotSqFt BD BA Days on Market Actual Lowest Sold $1,660,000 92 1,302 $1,275 1925 6,076 2 1 26 Typical Home Price (Median)* $1,925,000 96 1,474 $1,303 1927 5,963 3 2 20 Actual Highest Sold $2,190,000 100 1,645 $1,331 1929 5,849 3 2 14 Average $1,925,000 96 1,474 $1,303 1927 5,963 3 2 20 **Overbid/Underbid: 100 is list price paid. Under 100 means sold for less than asking, over 100 sold probably in multiples and over asking. Note: Square Footage calculation could be more or less (+-) 20% difference. (Based on calculation.) Source: TheMLS/CLAW (Combined Los Angeles Westside) Single Family Homes December 2022 $1,925,000 TYPICAL HOME PRICE (MEDIAN) $1,303 SOLD PRICE PER SQUARE FOOT 20 DAYS ON MARKET BEFORE SOLD (DOM) $1,660,000 ACTUAL LOWEST SOLD $2,190,000 ACTUAL HIGHEST SOLD NEIGHBORING AREAS: Area Typical Home Price (Median) Price per/SqFt Days on Market Mid-Low Mid-High Westwood $2,225,000 $1,136 22 $2,000,000 $2,431,550 Century City $2,307,500 $1,342 11 $1,869,375 $3,452,526 Cheviot Hills $3,235,000 $1,048 8 $2,535,000 $4,787,500 Rancho Park $1,655,000 $1,083 12 $1,521,750 $2,115,000 Sawtelle $1,636,000 $824 38 $1,070,000 $1,748,000 For questions, comments, a tailor-made report for your home area, or a complimentary home valuation please contact LeHoa Gacki LeHoa Gacki Douglas Elliman Real Estate DRE #01422855 Lehoa.Gacki@elliman.com www.LeHoaGacki.com 424.276.7587 LeHoa’s Neighborhood Data Charts Los Angeles Real Estate L.N.D.C. DECEMBER 2022 West Los Angeles A neighborhood in the City of Los Angeles WEST LOS ANGELES Century City Westwood Rancho Park Cheviot Hills Sawtelle
Buyer or Seller Advantage by Price Point for West Los Angeles as of December 31, 2022
Months supply of Inventory =
Based on last 3 months of homes sales, West Los Angeles has 0.8 months supply of inventory.
BUYER ADVANTAGE
HOME PRICE RANGE
$6,000,000 $10,000,000 $5,000,000 $5,999,999
$4,450,000 $4,999,999 $4,300,000 $4,449,999 $4,150,000 $4,299,999 $4,000,000 $4,149,999 $3,850,000 $3,999,999 $3,700,000 $3,849,999 $3,550,000 $3,699,999
4-6 = BALANCED MARKET 3 and under FAVORS SELLER 7 and over FAVORS BUYER
SELLER ADVANTAGE
SELLER ADVANTAGE $3,400,000 $3,549,999
$3,250,000 $3,399,999 $3,100,000 $3,249,999 $2,950,000 $3,099,999 $2,800,000 $2,949,999 $2,650,000 $2,799,999
SELLER ADVANTAGE $2,500,000 $2,649,999
SELLER ADVANTAGE $2,350,000 $2,499,999
SELLER ADVANTAGE $2,200,000 $2,349,999 $2,050,000 $2,199,999
SELLER ADVANTAGE $1,900,000 $2,049,999
SELLER ADVANTAGE $1,750,000 $1,899,999
SELLER ADVANTAGE
SELLER ADVANTAGE $1,450,000 $1,599,999
$1,600,000 $1,749,999
SELLER ADVANTAGE $1,300,000 $1,449,999 $1,150,000 $1,299,999
$1,000,000 $1,149,999 $750,000 $999,999 $500,000 $749,999
SELLER ADVANTAGE
West Los Angeles Inventory for New Construction and Resale
SELLER ADVANTAGE SUPPLY & DEMAND
For Sale
Source: TheMLS/CLAW (Combined Los Angeles Westside)
Under Contract Pending - Closing Soon
New Construction New Con DOM Resale Resale DOM Home Price Range Homes Resold
2 2 3 142 2
$500,000 $749,999 $750,000 $999,999 $1,000,000 $1,149,999
1 $1,150,000 $1,299,999 $1,300,000 $1,449,999 1 $1,450,000 $1,599,999 1 127 $1,600,000 $1,749,999 1 $1,750,000 $1,899,999 $1,900,000 $2,049,999 1 $2,050,000 $2,199,999 $2,200,000 $2,349,999 1 $2,350,000 $2,499,999 1 159 $2,500,000 $2,649,999 $2,650,000 $2,799,999
$2,800,000 $2,949,999 $2,950,000 $3,099,999
$3,100,000 $3,249,999
$3,250,000 $3,399,999 $3,400,000 $3,549,999 1
$3,550,000 $3,699,999 $3,700,000 $3,849,999 $3,850,000 $3,999,999
$4,000,000 $4,149,999 $4,150,000 $4,299,999 $4,300,000 $4,449,999 1 140 $4,450,000 $4,999,999 $5,000,000 $5,999,999 $6,000,000 $10,000,000
Homes
of
REALTORS
Homes as of December 31, 2022
BUYER
Homes Days on Market Before Sold
DOM October November December Resold DOM New Cons New DOM Homes Resold Resold DOM New Cons New DOM Homes Resold Resold DOM New Cons New DOM 41 1 18 6 37 1 14 2 20 1 89 1 26 23 1 18 1 77 1 14 1 8 1 8 1 33 59 1 14 1 9 REALTORS DIGEST
DEMAND
/ INVESTOR ADVANTAGE Based on last 3 months of homes sales, Bel-Air has 7.9 months supply of inventory. Sold
=
Jan 01, 2019 to Dec 31, 2019 Jan 01, 2020 to Dec 31, 2020 Jan 01, 2021 to Dec 31, 2021 Jan 01, 2022 to Dec 31, 2022 Mid-Low Typical Home Price-Median Mid-High 4 YEAR TREND For questions, comments, a tailor-made report for your home area, or a complimentary home valuation please contact LeHoa Gacki LeHoa Gacki, DRE #01422855 Douglas Elliman Real Estate 11990 San Vicente Blvd., #100, L.A., Ca 90049 Email: Lehoa.Gacki@elliman.com Tel | Fax: (424) 276-7587 www.Lehoagacki.com | Lehoagacki.elliman.com 4 YEAR OBSERVATION West Los Angeles Number of Homes Sold: 63 44 72 55 Jan 01, 2019 to Dec 31, 2019 Jan 01, 2020 to Dec 31, 2020 Jan 01, 2021 to Dec 31, 2021 Jan 01, 2022 to Dec 31, 2022 Actual Lowest Sold $1,200,000 $1,300,000 $1,320,000 $1,150,000 Mid-Low $1,688,000 $1,655,750 $1,807,500 $1,745,000 Typical Home Price-Median $1,851,000 $1,845,000 $2,102,500 $1,981,500 Mid-High $2,190,000 $2,442,500 $2,649,531 $2,516,500 Actual Highest Sold $3,950,000 $4,750,000 $3,420,000 $3,607,000 Average Price Sold $2,052,946 $2,105,743 $2,225,139 $2,129,730 12 MONTH
West Los Angeles Cumulative 12 months sold home analysis from: January 01, 2022 to December 31, 2022 55 Sold Sold Price **Overbid / Underbid Square Feet Price per/SqFt YB LotSqFt BD BA Days on Market Actual Lowest Sold $1,150,000 96 785 $1,465 1952 4,761 2 1 89 Mid-Low* $1,745,000 97 1,543 $961 1927 5,406 3 2 9 Typical Home Price-Median* $1,981,500 102 1,907 $1,130 1929 6,212 3 2 13 Mid-High* $2,516,500 110 2,189 $1,267 1945 6,750 3 3 20 Actual Highest Sold $3,607,000 96 3,754 $961 2017 6,749 5 5 9 Average $2,129,730 104 1,952 $1,132 1947 5,975 3 3 23 **Overbid / Underbid: 100 is list price paid. Under 100 means sold for less than asking, over 100 sold probably in multiples and over asking. Note: Square Footage calculation could be more or less (+-) 20% difference. (Based on calculation.) * Middle Range Variance $771,500 Middle Range Variance is future range Typical Home Price (Median) Price will vary by. Never more, Never less. Source: TheMLS/CLAW (Combined Los Angeles Westside) © 2022 LEHOA GACKI. DRE# 01422855. ALL WORLDWIDE RIGHTS RESERVED. DOUGLAS ELLIMAN REAL ESTATE. 150 EL CAMINO DRIVE, BEVERLY HILLS, CA 90212. 310.595.3888. ALL MATERIAL PRESENTED HEREIN IS INTENDED FOR INFORMATION PURPOSES ONLY AND NOT INTENDED TO CONSTITUTE PROFESSIONAL ADVICE OR WARRANTY OUTSIDE THE REALM OF REAL ESTATE BROKERAGE. MAPS CREATED FOR REFERENCE PURPOSE ONLY. WHILE THIS INFORMATION IS BELIEVED TO BE CORRECT, IT IS REPRESENTED SUBJECT TO ERRORS, OMISSIONS, CHANGES OR WITHDRAWAL WITHOUT NOTICE. BASED ON DATA SOURCED FROM THE COMBINED LOS ANGELES WESTSIDE MULTIPLE LISTING SERVICE AND PUBLIC RECORDS. STATISTICS ARE SUBJECT TO CHANGE DUE TO INDIVIDUAL REAL ESTATE COMPANY REPORTING DISCIPLINES. BUYER ADVANTAGE OR SELLER ADVANTAGE IS STRICTLY OF THE OPINION OF LEHOA GACKI AND ACCURACY CANNOT BE GUARANTEED AND MAY NOT REFLECT ALL REAL ESTATE ACTIVITY ON THE MARKET. ALL PROPERTY INFORMATION, INCLUDING, BUT NOT LIMITED TO MAPS, GRAPHS, DEPICTIONS, SQUARE FOOTAGE, ROOM COUNT, NUMBER OF BEDROOMS AND THE SCHOOL DISTRICT IN PROPERTY LISTINGS SHOULD BE VERIFIED BY YOUR OWN ATTORNEY, ARCHITECT OR ZONING EXPERT. NEW CONSTRUCTION COUNT, SQUARE FOOTAGE AND YEAR BUILT IS BASED ON INDIVIDUAL REAL ESTATE COMPANY REPORTING AND MAY BE DIFFERENT THAN PUBLIC RECORDS. NEW CONSTRUCTION COUNT IS BASED ON LISTING BROKERAGE LISTING YEAR. THE BROKER/AGENT PROVIDING THE INFORMATION CONTAINED HEREIN MAY OR MAY HAVE NOT BEEN THE LISTING AND/OR SELLING AGENT. THIS IS NOT INTENDED TO SOLICIT PROPERTY ALREADY LISTED. EQUAL HOUSING OPPORTUNITY. NEIGHBORHOOD
PUBLIC RECORDS, COMBINED LOS ANGELES WESTSIDE MULTIPLE LISTING SERVICE AND LOS ANGELES TIMES MAPPING L.A. https://maps.latimes.com/neighborhoods/index.html WEST LOS ANGELES
$1,688,000 $1,655,750 $1,807,500 $1,745,000 $1,851,000 $1,845,000 $2,102,500 $1,981,500 $2,190,000 $2,442,500 $2,649,531 $2,516,500 $$500,000 $1,000,000 $1,500,000 $2,000,000 $2,500,000 $3,000,000
OBSERVATION
BOUNDARY SOURCE:
$1,114
$968 $903 $911 $979 $976
$1,111 $1,147 $970 $972 $931 $1,023 $996
Jul
37 22 33 18 10 16 11 155 10 15 20 25 30 35 40 Jan 01 to Jun 30, 2019 Jul 01 to Dec 31, 2019 Jan 01 to Jun 30, 2020 Jul 01 to Dec 31, 2020 Jan 01 to Jun 30, 2021 Jul 01 to Dec
Jan
to Jun
Jul
Dec
Number of
Sold 36 27 9 35 39 33 34 21 Days
END OF WEST LOS ANGELES 6 PAGE REPORT
HOME
PER
$1,127 $1,130 $1,136 $$200 $400 $600 $800 $1,000 $1,200 $1,400 Jan 01 to Jun 30, 2019
01 to Dec 31, 2019 Jan 01 to Jun 30, 2020 Jul 01 to Dec 31, 2020 Jan 01 to Jun 30, 2021 Jul 01 to Dec 31, 2021 Jan 01 to Jun 30, 2022 Jul 01 to Dec 31, 2022 Median Price Per Square Foot Average Price per SquareFt
31, 2021
01
30, 2022
01 to
31, 2022
Homes
on Market before Sold
SOLD
PRICE
SQUARE FOOT - PRE & POST MAR 2020 PANDEMIC WEST LOS ANGELES DAYS ON MARKET BEFORE SOLD- PRE & POST MAR 2020 PANDEMIC WEST LOS ANGELES
WHAT YOUR MONEY BUYS YOU THIS MONTH: Westwood Home Analysis from: December 01, 2022 to December 31, 2022 3 Sold Sold Price **Overbid/ Underbid Square Feet Price per/SqFt YB LotSqFt BD BA Days on Market Actual Lowest Sold $2,000,000 95 2,180 $917 1928 6,510 3 2 40 Typical Home Price (Median)* $2,225,000 97 1,958 $1,136 1935 6,563 3 2 22 Actual Highest Sold $2,431,550 97 1,949 $1,248 1935 6,563 3 2 17 Average $2,218,850 97 2,029 $1,100 1933 6,824 3 2 26 **Overbid/Underbid: 100 is list price paid. Under 100 means sold for less than asking, over 100 sold probably in multiples and over asking. Note: Square Footage calculation could be more or less (+-) 20% difference. (Based on calculation.) Source: TheMLS/CLAW (Combined Los Angeles Westside) NEIGHBORING AREAS: Area Typical Home Price (Median) Price per/SqFt Days on Market Mid-Low Mid-High Brentwood $4,449,512 $1,383 $18 $2,550,000 $8,525,000 Bel Air $4,125,000 $1,205 $43 $3,225,000 $9,962,500 Holmby Hills $49,500,000 $2,616 $65 Beverly Hills $5,343,500 $1,557 $54 $3,483,750 $8,250,000 Century City $2,781,750 $1,260 $19 $1,948,125 $4,168,103 West Los Angeles $1,925,000 $1,303 $20 $1,745,000 $2,516,500 Sawtelle $1,636,000 $824 $38 $1,070,000 $1,748,000 LeHoa’s Neighborhood Data Charts Los Angeles Real Estate L.N.D.C. DECEMBER 2022 For questions, comments, a tailor-made report for your home area, or a complimentary home valuation please contact LeHoa Gacki LeHoa Gacki Douglas Elliman Real Estate DRE #01422855 Lehoa.Gacki@elliman.com www.LeHoaGacki.com 424.276.7587 Westwood A neighborhood in the City of Los Angeles Sawtelle WESTWOOD West Los Angeles Beverly Hills Century City Bel Air Brentwood Holmby Hills Single Family Homes December 2022 $2,225,000 TYPICAL HOME PRICE (MEDIAN) $1,136 SOLD PRICE PER SQUARE FOOT 22 DAYS ON MARKET BEFORE SOLD (DOM) $2,000,000 ACTUAL LOWEST SOLD $2,431,550 ACTUAL HIGHEST SOLD
Buyer or Seller Advantage by Price Point for Westwood as of December 31, 2022
Based on last 3 months of homes sales, Westwood has 2.4 months supply of inventory.
HOME PRICE RANGE
$20,000,000 $30,000,000 $15,000,000 $19,999,999
BUYER ADVANTAGE $12,000,000 $14,999,999 $11,000,000 $11,999,999 $10,000,000 $10,999,999 $9,000,000 $9,999,999
BUYER ADVANTAGE $8,000,000 $8,999,999
BUYER ADVANTAGE $7,000,000 $7,999,999
BUYER ADVANTAGE $6,500,000 $6,999,999 $6,000,000 $6,499,999 SELLER ADVANTAGE $5,500,000 $5,999,999 SELLER ADVANTAGE $5,000,000 $5,499,999 SELLER ADVANTAGE $4,750,000 $4,999,999 $4,500,000 $4,749,999 SELLER ADVANTAGE $4,250,000 $4,499,999 SELLER ADVANTAGE $4,000,000 $4,249,999 SELLER ADVANTAGE $3,750,000 $3,999,999 SELLER ADVANTAGE $3,500,000 $3,749,999
BUYER ADVANTAGE
$3,250,000 $3,499,999 $3,000,000 $3,249,999 $2,750,000 $2,999,999
SELLER ADVANTAGE
BUYER ADVANTAGE
$2,500,000 $2,749,999
SELLER ADVANTAGE $2,250,000 $2,499,999 SELLER ADVANTAGE $2,000,000 $2,249,999 SELLER ADVANTAGE
$1,750,000 $1,999,999 $1,500,000 $1,749,999 $1,250,000 $1,499,999 $750,000 $1,249,999
4-6 = BALANCED MARKET 3 and under FAVORS SELLER 7
and over FAVORS BUYER
Months supply of Inventory =
Westwood Inventory for New Construction and Resale of Homes
SELLER ADVANTAGE SUPPLY & DEMAND
For Sale
Source: TheMLS/CLAW (Combined Los Angeles Westside)
Under Contract Pending - Closing Soon
New Construction New Con DOM Resale Resale DOM Home Price Range Homes Resold
1 2 11 92 4
$750,000 $1,249,999
$1,250,000 $1,499,999 $1,500,000 $1,749,999 1 76 $1,750,000 $1,999,999 $2,000,000 $2,249,999 $2,250,000 $2,499,999 1 4 $2,500,000 $2,749,999 2
1 1 53 $2,750,000 $2,999,999 $3,000,000 $3,249,999 2 113 $3,250,000 $3,499,999 $3,500,000 $3,749,999 1 1 24 $3,750,000 $3,999,999
$4,000,000 $4,249,999
$4,250,000 $4,499,999 1 $4,500,000 $4,749,999 $4,750,000 $4,999,999 1
$5,000,000 $5,499,999 $5,500,000 $5,999,999 1 1 105 $6,000,000 $6,499,999 1 89 $6,500,000 $6,999,999 1 143 $7,000,000 $7,999,999 1 122 $8,000,000 $8,999,999
$9,000,000 $9,999,999
$10,000,000 $10,999,999 $11,000,000 $11,999,999 1 174 $12,000,000 $14,999,999
$15,000,000 $19,999,999 $20,000,000 $30,000,000
REALTORS
as of December 31, 2022 DEMAND BUYER / INVESTOR
Homes Days on Market Before Sold
DOM October November December Resold DOM New Cons New DOM Homes Resold Resold DOM New Cons New DOM Homes Resold Resold DOM New Cons New DOM 35 5 48 2 29 3 26 2 31 1 17 65 1 70 1 44 1 25 5 2 52 5 2 29 REALTORS DIGEST
ADVANTAGE Based on last 3 months of homes sales, Bel-Air has 7.9 months supply of inventory. Sold
=
Jan 01, 2019 to Dec 31, 2019 Jan 01, 2020 to Dec 31, 2020 Jan 01, 2021 to Dec 31, 2021 Jan 01, 2022 to Dec 31, 2022 Mid-Low Typical Home Price-Median Mid-High 4 YEAR TREND For questions, comments, a tailor-made report for your home area, or a complimentary home valuation please contact LeHoa Gacki LeHoa Gacki, DRE #01422855 Douglas Elliman Real Estate 11990 San Vicente Blvd., #100, L.A., Ca 90049 Email: Lehoa.Gacki@elliman.com Tel | Fax: (424) 276-7587 www.Lehoagacki.com | Lehoagacki.elliman.com 4 YEAR OBSERVATION Westwood Number of Homes Sold: 77 75 107 97 Jan 01, 2019 to Dec 31, 2019 Jan 01, 2020 to Dec 31, 2020 Jan 01, 2021 to Dec 31, 2021 Jan 01, 2022 to Dec 31, 2022 Actual Lowest Sold $1,300,000 $1,690,000 $1,745,000 $1,633,000 Mid-Low $2,137,500 $2,271,865 $2,500,000 $2,657,500 Typical Home Price-Median $2,700,000 $2,720,000 $2,945,000 $3,375,000 Mid-High $3,897,500 $3,700,000 $4,350,000 $4,292,500 Actual Highest Sold $6,800,000 $6,850,000 $16,750,000 $17,470,000 Average Price Sold $2,990,759 $3,186,602 $3,814,687 $3,780,189 12 MONTH OBSERVATION Westwood Cumulative 12 months sold home analysis from: January 01, 2022 to December 31, 2022 97 Sold Sold Price **Overbid / Underbid Square Feet Price per/SqFt YB LotSqFt BD BA Days on Market Actual Lowest Sold $1,633,000 93 3,440 $475 1936 8,429 4 4 100 Mid-Low* $2,657,500 96 2,305 $1,033 1931 6,742 3 3 10 Typical Home Price-Median* $3,375,000 100 2,875 $1,144 1937 7,646 4 4 17 Mid-High* $4,292,500 109 3,659 $1,350 1951 9,029 5 5 40 Actual Highest Sold $17,470,000 92 13,000 $1,344 2022 20,004 8 11 76 Average $3,780,189 104 3,109 $1,201 1945 8,382 4 4 32 **Overbid / Underbid: 100 is list price paid. Under 100 means sold for less than asking, over 100 sold probably in multiples and over asking. Note: Square Footage calculation could be more or less (+-) 20% difference. (Based on calculation.) * Middle Range Variance $1,635,000 Middle Range Variance is future range Typical Home Price (Median) Price will vary by. Never more, Never less. Source: TheMLS/CLAW (Combined Los Angeles Westside) © 2022 LEHOA GACKI. DRE# 01422855. ALL WORLDWIDE RIGHTS RESERVED. DOUGLAS ELLIMAN REAL ESTATE. 150 EL CAMINO DRIVE, BEVERLY HILLS, CA 90212. 310.595.3888. ALL MATERIAL PRESENTED HEREIN IS INTENDED FOR INFORMATION PURPOSES ONLY AND NOT INTENDED TO CONSTITUTE PROFESSIONAL ADVICE OR WARRANTY OUTSIDE THE REALM OF REAL ESTATE BROKERAGE. MAPS CREATED FOR REFERENCE PURPOSE ONLY. WHILE THIS INFORMATION IS BELIEVED TO BE CORRECT, IT IS REPRESENTED SUBJECT TO ERRORS, OMISSIONS, CHANGES OR WITHDRAWAL WITHOUT NOTICE. BASED ON DATA SOURCED FROM THE COMBINED LOS ANGELES WESTSIDE MULTIPLE LISTING SERVICE AND PUBLIC RECORDS. STATISTICS ARE SUBJECT TO CHANGE DUE TO INDIVIDUAL REAL ESTATE COMPANY REPORTING DISCIPLINES. BUYER ADVANTAGE OR SELLER ADVANTAGE IS STRICTLY OF THE OPINION OF LEHOA GACKI AND ACCURACY CANNOT BE GUARANTEED AND MAY NOT REFLECT ALL REAL ESTATE ACTIVITY ON THE MARKET. ALL PROPERTY INFORMATION, INCLUDING, BUT NOT LIMITED TO MAPS, GRAPHS, DEPICTIONS, SQUARE FOOTAGE, ROOM COUNT, NUMBER OF BEDROOMS AND THE SCHOOL DISTRICT IN PROPERTY LISTINGS SHOULD BE VERIFIED BY YOUR OWN ATTORNEY, ARCHITECT OR ZONING EXPERT. NEW CONSTRUCTION COUNT, SQUARE FOOTAGE AND YEAR BUILT IS BASED ON INDIVIDUAL REAL ESTATE COMPANY REPORTING AND MAY BE DIFFERENT THAN PUBLIC RECORDS. NEW CONSTRUCTION COUNT IS BASED ON LISTING BROKERAGE LISTING YEAR. THE BROKER/AGENT PROVIDING THE INFORMATION CONTAINED HEREIN MAY OR MAY HAVE NOT BEEN THE LISTING AND/OR SELLING AGENT. THIS IS NOT INTENDED TO SOLICIT PROPERTY ALREADY LISTED. EQUAL HOUSING OPPORTUNITY. NEIGHBORHOOD BOUNDARY SOURCE: PUBLIC RECORDS, COMBINED LOS ANGELES WESTSIDE MULTIPLE LISTING SERVICE AND LOS ANGELES TIMES MAPPING L.A. https://maps.latimes.com/neighborhoods/index.html WESTWOOD
$2,137,500 $2,271,865 $2,500,000 $2,657,500 $2,700,000 $2,720,000 $2,945,000 $3,375,000 $3,897,500 $3,700,000 $4,350,000 $4,292,500 $$500,000 $1,000,000 $1,500,000 $2,000,000 $2,500,000 $3,000,000 $3,500,000 $4,000,000 $4,500,000 $5,000,000
$-
Jan 01 to Jun 30,
Jul 01 to Dec 31,
Jan 01 to Jun
Jul
Dec
Jul
36 61 33 31 17 13 14 3910 20 30 40 50 60 70 Jan 01 to Jun 30, 2019 Jul 01 to Dec 31, 2019 Jan 01 to Jun 30, 2020 Jul 01 to Dec 31, 2020 Jan 01 to Jun 30, 2021 Jul 01 to Dec 31, 2021 Jan 01 to Jun 30, 2022 Jul 01 to Dec 31, 2022 Number of Homes Sold 36 41 26 49 56 51 62 35 Days
Sold END OF WESTWOOD 6 PAGE REPORT SOLD HOME PRICE PER SQUARE FOOT - PRE & POST MAR 2020
WESTWOOD DAYS ON MARKET
SOLD-
POST
WESTWOOD
$954 $951 $966 $976 $1,019 $1,139 $1,157 $1,136 $956 $966 $956 $994 $1,027 $1,231 $1,237 $1,137
$200 $400 $600 $800 $1,000 $1,200 $1,400
2019
2019
30, 2020
01 to
31, 2020 Jan 01 to Jun 30, 2021
01 to Dec 31, 2021 Jan 01 to Jun 30, 2022 Jul 01 to Dec 31, 2022 Median Price Per Square Foot Average Price per SquareFt
on Market before
PANDEMIC
BEFORE
PRE &
MAR 2020 PANDEMIC