Japan Research|
August 2024
August 2024


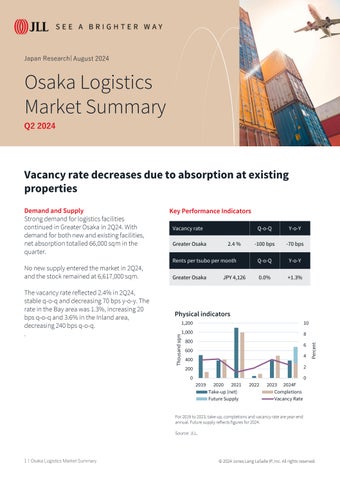
Strong demand for logistics facilities continued in Greater Osaka in 2Q24. With demand for both new and existing facilities, net absorption totalled 66,000 sqm in the quarter.
No new supply entered the market in 2Q24, and the stock remained at 6,617,000 sqm.
The vacancy rate reflected 2.4% in 2Q24, stable q-o-q and decreasing 70 bps y-o-y. The rate in the Bay area was 1.3%, increasing 20 bps q-o-q and 3.6% in the Inland area, decreasing 240 bps q-o-q.
sqm Take-up (net) Completions Future Supply Vacancy Rate
2019 2020 2021 2022 2023 2024F
For 2019 to 2023, take-up, completions and vacancy rate are year-end annual. Future supply reflects figures for 2024.
Source: JLL,
Asset Performance
Gross rents in Greater Tokyo averaged JPY 4,126 per tsubo, per month in 2Q24, remaining flat q-o-q and increasing 1.3% y-o-y. Rent growth was driven by newly completed facilities, followed by existing facilities registering moderate growth.
Investment Market
Capital values continued to register a growth trend in 2Q24, reflecting investment yield compression and moderate rent growth.
In the leasing market, the vacancy rate is expected to increase in 2025 and onwards as new supply accelerates, bringing the vacancy rate to around 6–8%. Nevertheless, future supply with good locations, specifications and rents will see higher pre-commitment rates, and is expected to achieve a high occupancy rate upon completion.
Rent growth is expected to continue due to new supply commanding higher rents on the back of surging construction costs, which will stimulate moderate rent growth in submarkets in the vicinities. While rent affordability remains a concern, with a continued high occupancy rate in new completions to date, rent growth is expected to continue.
In the investment market, investment yields are expected to compress, reflecting strong interest from investors.
Financial Indices
Global Property Clock
Source: JLL
Source: JLL US positions relate to the overall market
Tokyo Headquarters Kioi Tower, Tokyo Garden Terrace Kioicho 1-3 Kioi-cho Chiyoda-ku, Tokyo 102-0094 +81 3 4361 1800
Fukuoka Office
Daihakata Bldg. 2-20-1 Hakata-ekimae, Hakata-ku, Fukuoka-shi Fukuoka 812-0011 +81 92 233 6801
Osaka Office Nippon Life
Yodoyabashi Building 3-5-29 Kitahama Chuo-ku, Osaka 541-0041 +81 6 7662 8400
Nagoya Office
JP Tower Nagoya 1-1-1 Meieki, Nakamura-ku, Nagoya-shi
Aichi 450-6321 +81 52 856 3357
Contact
Takeshi Akagi
Head of Research Research - Japan takeshi.akagi@jll.com
Manabu Taniguchi
Senior Director Research - Japan manabu.taniguchi@jll.com
Takeshi Yamaguchi
Research Director
JLL Japan Osaka Office takeshi yamaguchi@jll.com
Edward Liang Manager Research - Japan edwardl.liang@jll.com
About JLL
For over 200 years, JLL (NYSE: JLL), a leading global commercial real estate and investment management company, has helped clients buy, build, occupy, manage and invest in a variety of commercial, industrial, hotel, residential and retail properties A Fortune 500® company with annual revenue of $20 8 billion and operations in over 80 countries around the world, our more than 108,000 employees bring the power of a global platform combined with local expertise Driven by our purpose to shape the future of real estate for a better world, we help our clients, people and communities SEE A BRIGHTER WAYSM JLL is the brand name, and a registered trademark, of Jones Lang LaSalle Incorporated For further information, visitjll com
About JLL Research
JLL’s research team delivers intelligence, analysis and insight through marketleading reports and services that illuminate today’s commercial real estate dynamics and identify tomorrow’s challenges and opportunities. Our more than 550 global research professionals track and analyze economic and property trends and forecast future conditions in over 60 countries, producing unrivalled local and global perspectives. Our research and expertise, fueled by real-time information and innovative thinking around the world, creates a competitive advantage for our clients and drives successful strategies and optimal real estate decisions.