‘Jersey – The Most Profitable and Sustainable Cow?’ – Literature Review for Jersey Australia
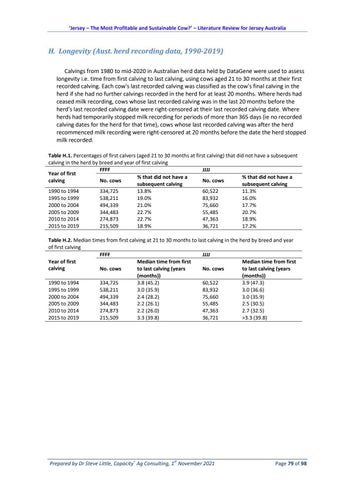
H. Longevity (Aust. herd recording data, 1990-2019) Calvings from 1980 to mid-2020 in Australian herd data held by DataGene were used to assess longevity i.e. time from first calving to last calving, using cows aged 21 to 30 months at their first recorded calving. Each cow's last recorded calving was classified as the cow's final calving in the herd if she had no further calvings recorded in the herd for at least 20 months. Where herds had ceased milk recording, cows whose last recorded calving was in the last 20 months before the herd's last recorded calving date were right-censored at their last recorded calving date. Where herds had temporarily stopped milk recording for periods of more than 365 days (ie no recorded calving dates for the herd for that time), cows whose last recorded calving was after the herd recommenced milk recording were right-censored at 20 months before the date the herd stopped milk recorded. Table H.1. Percentages of first calvers (aged 21 to 30 months at first calving) that did not have a subsequent calving in the herd by breed and year of first calving FFFF JJJJ Year of first % that did not have a % that did not have a calving No. cows No. cows subsequent calving subsequent calving 1990 to 1994 334,725 13.8% 60,522 11.3% 1995 to 1999 538,211 19.0% 83,932 16.0% 2000 to 2004 494,339 21.0% 75,660 17.7% 2005 to 2009 344,483 22.7% 55,485 20.7% 2010 to 2014 274,873 22.7% 47,363 18.9% 2015 to 2019 215,509 18.9% 36,721 17.2% Table H.2. Median times from first calving at 21 to 30 months to last calving in the herd by breed and year of first calving FFFF JJJJ Year of first Median time from first Median time from first calving No. cows to last calving (years No. cows to last calving (years (months)) (months)) 1990 to 1994 334,725 3.8 (45.2) 60,522 3.9 (47.3) 1995 to 1999 538,211 3.0 (35.9) 83,932 3.0 (36.6) 2000 to 2004 494,339 2.4 (28.2) 75,660 3.0 (35.9) 2005 to 2009 344,483 2.2 (26.1) 55,485 2.5 (30.5) 2010 to 2014 274,873 2.2 (26.0) 47,363 2.7 (32.5) 2015 to 2019 215,509 3.3 (39.8) 36,721 >3.3 (39.8)
+
st
Prepared by Dr Steve Little, Capacity Ag Consulting, 1 November 2021
Page 79 of 98


