1 minute read
D. Daily DM intake and plasma NEFA levels pre-calving (French et al., 2006


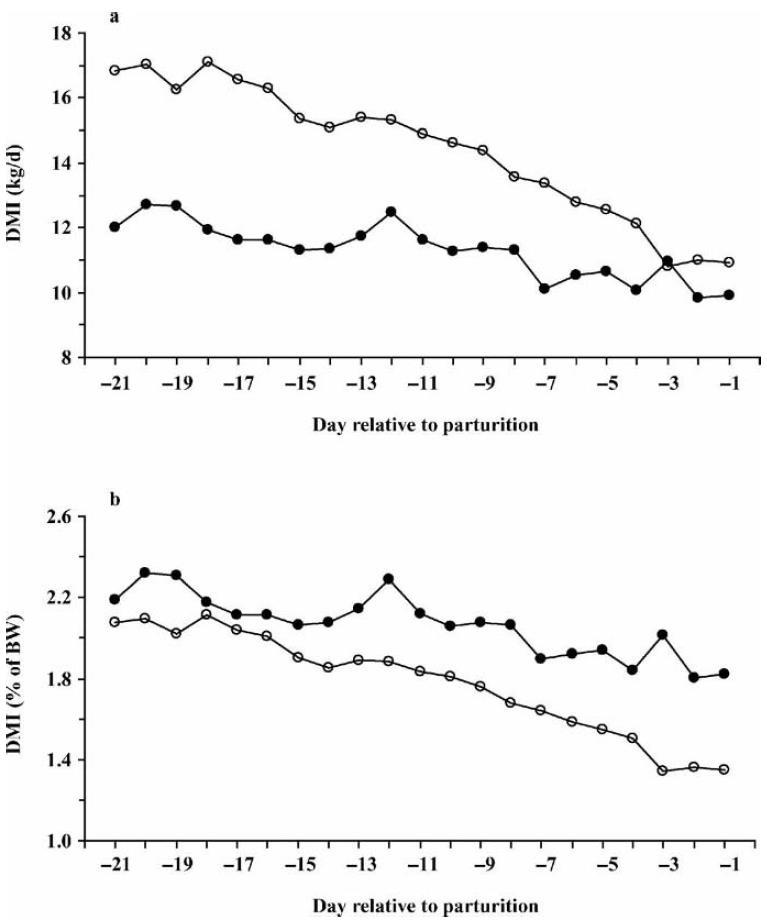
D. Daily DM intake and plasma NEFA levels pre-calving (French et al., 2006)
Figure D.1. Least squares mean daily DM intake expressed as kg/d (a) and percentage of BW (b) by day relative to parturition for Holsteins (○) and Jerseys (●). Interaction for breed by time was significant at the level of P < 0.001 (SE = 0.6, n = 14) and P < 0.05 (SE = 0.12, n = 14) for DMI expressed as kilograms/day and percentage of BW, respectively. [French, 2006].
Advertisement
Figure D.2. Least squares mean plasma NEFA by day relative to parturition for Holsteins (○) and Jerseys (●). Interaction for breed by time was significant at the level of P < 0.01 (SE = 67, n = 14). Nonesterified fatty acids (NEFAs) were greater for Holsteins from 3 d prepartum to 1 d postpartum relative to Jerseys. [French, 2006].