8 minute read
Milk composition


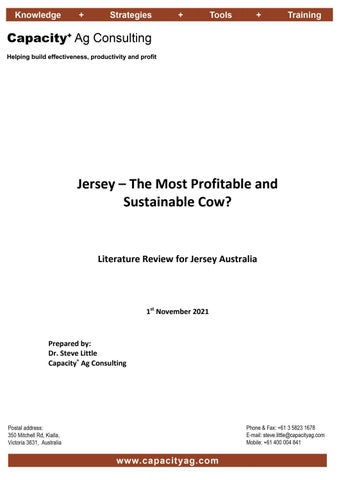
(b)
Figure 1. Average 305-day milksolids yield (kg) per cow by calving system, breed and year for (a) seasonal/split calving herds, and (b) year-round calving herds [DataGene, 2021].
Advertisement
Milk composition
The composition of milk varies due to breed, physiological, husbandry and seasonal factors [Soyeurt et al., 2006; Palladino et al., 2010], lactation stage [Craninx et al., 2008; Stoop et al., 2009], age [Haile-Mariam and Pryce 2015], animal health [Goncalves et al. 2020], nutrition [Larsen et al., 2010], milking interval [Quist et al., 2008], on-farm storage [Forsback et al., 2011] and seasonal changes [Heck et al., 2009; Li et al., 2019].
Fat and protein concentrations
Concentrations of fat and protein are higher in milk produced by Jersey cows than by HolsteinJersey cross-bred cows and Holstein cows [Beaulieu and Palmquist, 1995; Rastani et al., 2001; White et al., 2001; Palladino et al., 2010].
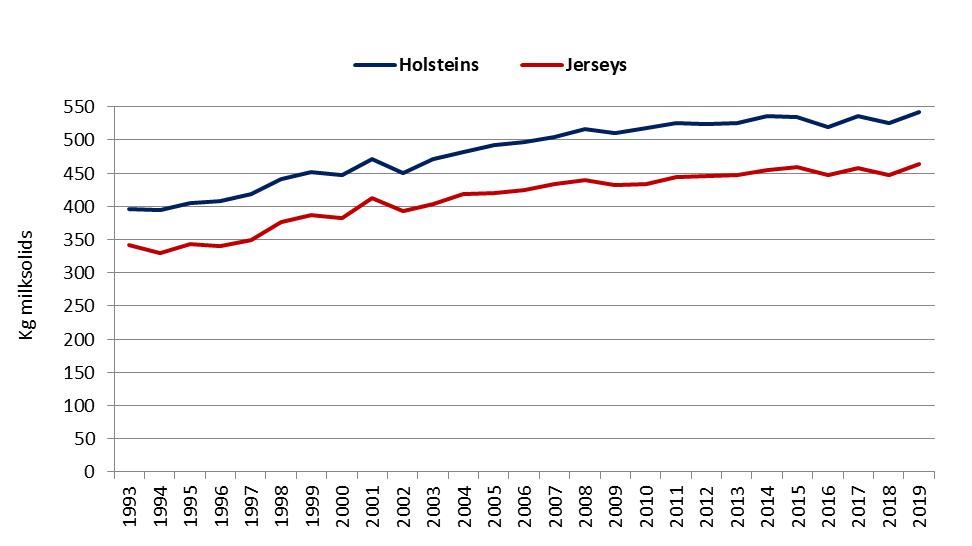
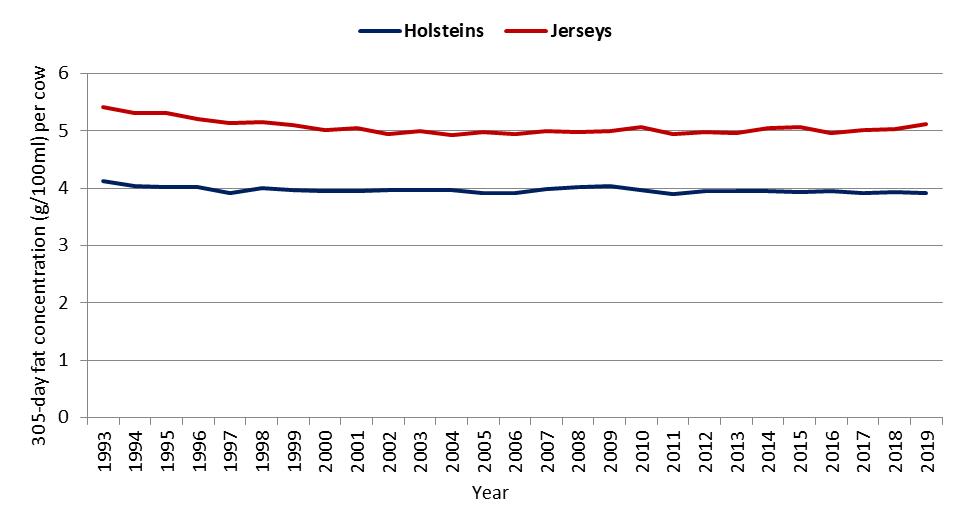
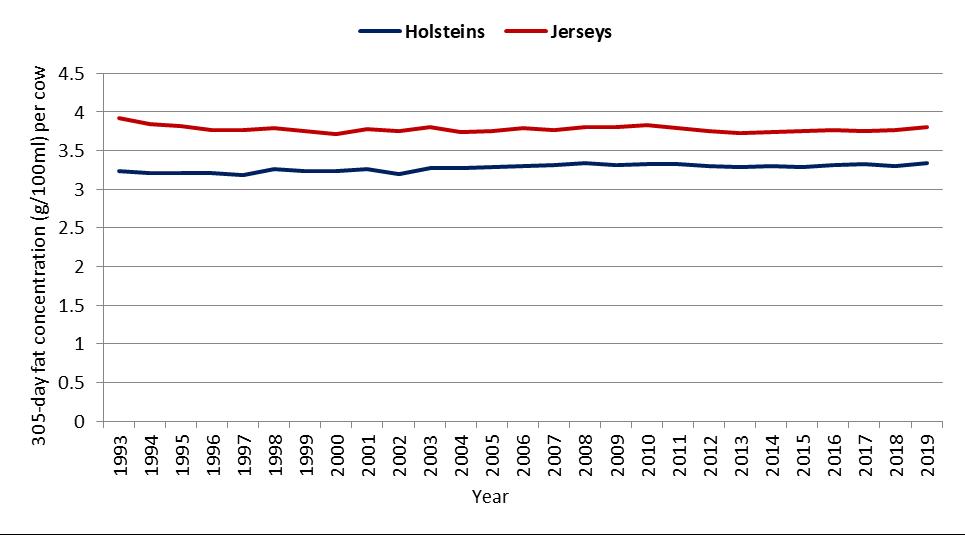
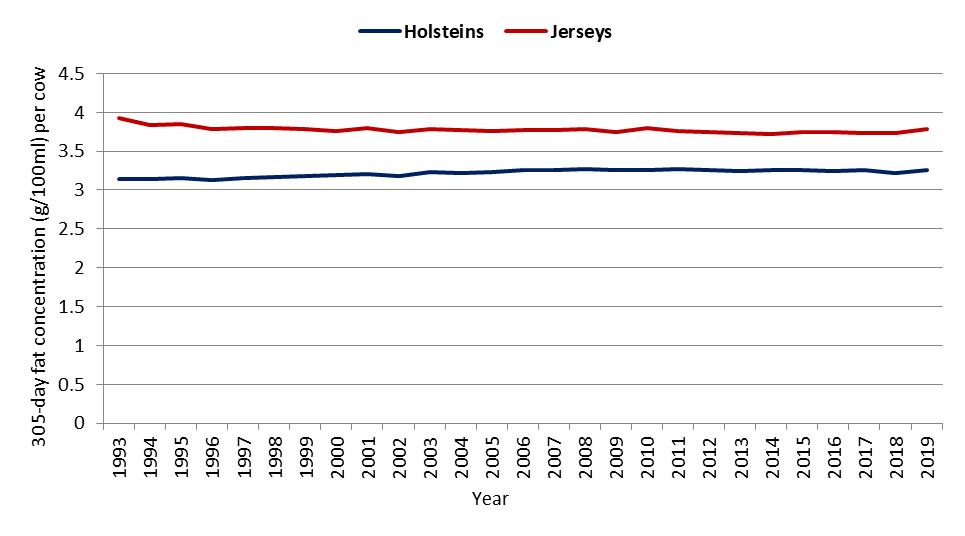
In Australia, based on herd recording data held by DataGene, the mean difference in the concentrations of fat in milk between Jersey cows and Holstein cows over a period of 27 years (1993 to 2019) was 1.1 g/100 ml in seasonal/split herds and 1.14 g/100 ml in year-round calving herds (Figure 2a,b).
(a)
(b)
Figure 2. Average 305-day fat concentration (g/100 mL) per cow by calving system, breed and year for (a) seasonal/split calving herds, and (b) year-round calving herds [DataGene, 2021].
The mean difference in the concentrations of protein in milk between Jersey cows and Holstein cows over a period of 27 years (1993 to 2019) was about 0.5 g/100 ml in seasonal/split herds and 0.56 g/100 ml in year-round calving herds (Figure 3a,b).
(a)
(b)
Figure 3. Average 305-day protein concentration (g/100 mL) per cow by calving system, breed and year for (a) seasonal/split calving herds, and (b) year-round calving herds [DataGene, 2021].
Fatty acid profile of milk fat
Milk fat comprises a large number of individual fatty acids (FAs). About 70% of total milk FAs have no double bounds, i.e. saturated FAs (SFAs), 25% of FAs have one double bound, i.e., mono unsaturated FAs (MUFAs) and about 5% of FAs have multiple double bounds, i.e. poly unsaturated FAs (PUFAs). The groups of fatty acids and indices can be confusing. Table 2 is therefore provided [Van Eijndhoven, 2014].
Table 2. Groups of fatty acids and indices [from Van Eijndhoven, 2014].
Group Fatty acids
Saturated fatty acids C4:0; C5:0; C6:0; C7:0; C8:0; C9:0; C10:0; C11:0; C12:0; C14:0 iso; C14:0; C15:0 iso; C15:0 ante iso; C15:0; C16:0 iso; C16:0; C17:0 iso; C17:0 ante iso; C17:0; C18:0; C19:0; C20:0
Unsaturated fatty acids C10:1; C12:1; C14:1; C16:1; C17:1; C20:3 cis-8-11-14; C18unsat
C6-12 C14-16 C18 unsaturated (unsat)
C18 trans
n-3 n-6 Branched
Unsaturation index
Unsaturation index C12 Unsaturation index C14 Unsaturation index C16 Unsaturation index C18 C6:0; C8:0; C10:0; C12:0 C14:0; C16:0 C18:1 trans-6; C18:1 trans-9; C18:1 trans-10; C18:1 trans11; C18:1 trans-12; C18:1 cis-9; C18:1 cis-11; C18:1 cis-12; C18:2 cis-9-12; C18:3 cis-9-12-15; C18:2 cis-9; trans-11 (CLA) C18:1 trans-6; C18:1 trans-9; C18:1 trans-10; C18:1 trans11; C18:1 trans-12 All omega 3 fatty acids All omega 6 fatty acids C14:0 iso; C15:0 iso; C15:0 ante iso; C16:0 iso; C17:0 iso; C17:0 ante iso (C10:1 + C12:1 + C14:1 + C16:1 + C17:1 + C18:1 cis-9 + C18:2 cis-9, trans-11) / (C10:0 + C10:1 + C12:0 + C12:1 + C14:0 + C14:1 + C16:0 + C16:1 + C17:0 + C17:1 + C18:0 + C18:1 cis-9 + C18:2 cis-9, trans-11) C12:1 / (C12:0 + C12:1) C14:1 / (C14:0 + C14:1) C16:1 / (C16:0 + C16:1) C18unsat / (C18:0 + C18unsat)
The concentrations of individual fatty acids in milk fat are influenced by cow breed [DePeters et al., 1995; Croissant et al., 2007], stage of lactation [Craninx et al., 2008; Nantapo et al., 2014], energy balance [Auldist et al., 1998], genetics [Soyeurt et al., 2007], diet and udder health. Diet is especially relevant when comparing concentrate-fed and pasture-based systems. Milk fatty acid composition in pasture-based systems is, additionally, subject to seasonal variations that influence the quantity and quality of available forages.
Differences have been found in the concentrations of fatty acids in the milk fat of Jersey vs. Holstein cows fed the same diet under the same environmental conditions. However, these differences between breeds are small relative to those between different stages of lactation. Furthermore, the range of values between individual cows for concentrations of all fatty acids in milk is greater than the variation across five selected breeds [Soyeurt et al., 2006].
Jersey milk fat contains a higher proportion of short-chain fatty acids (C4:0, C6:0, and C8:0) and medium-chain fatty acids (C10:0, C12:0, and C14:0) than Holstein milk fat, and a lower proportion of C16:1, C18:1, and conjugated linoleic acid (CLA) (Table 3) [DePeters et al., 1995; White et al., 2001; Bainbridge et al., 2016]. Jerseys have been found to produce slightly less CLAs than Holsteins in grazing and housed dairy production systems [White et al., 2001; Palladino et al., 2010].
Table 3. Content (g/kg milk) of major fatty acids in milk from three breeds of dairy cow over four time points; 5 days in milk (DIM), 95 DIM, 185 DIM, 275 DIM [Bainbridge et al., 2016].

Milk fat depression (MFD)
Milk fat depression (MFD) tends to occur in grazing systems when cows consume substantial quantities of fresh, high quality pasture rich in polyunsaturated fatty acids (PUFA). Incomplete bio-hydrogenation of excessive dietary PUFAs by rumen microbes leads to synthesis of many alternate CLA isomers, including trans-10, cis-12 CLA; trans-9, cis-11; and cis-10, trans-12, that are transported to the mammary gland where they impair the production of essential fat synthesis enzymes, inhibiting milk fat synthesis [Baumgard, 2001; Harvatine et al., 2008; Jenkins et al., 2014; Lock, 2010]. MFD is caused not only by the presence of significant levels of PUFAs in the rumen, but also by alterations in rumen fermentation involving both the microbial fermentation of dietary carbohydrates and the microbial bio-hydrogenation of fatty acids. Only a very small amount of trans-10, cis-12 CLA is required to reduce the milk fat concentration by 25%.
There is currently no definitive evidence available as to whether Jerseys are more or less susceptible to MFD than other breeds. Assessing any breed differences is difficult due to the high level of variation (threefold) in PUFAs and CLA between animals fed the same diet. The activity of the enzyme Δ9 -desaturase is key to understanding the differences in milk CLA between animals and breeds, as it converts vaccenic acid to CLA [Lock and Garnsworthy, 2003]. Kelly et al. (1998) found that between-animal variation in Δ9 -desaturase activity was higher in grazing and housed dairy production systems, meaning that any differences between breeds would be harder to detect in grazing systems. More research is required on the effect of heterosis on milk fatty acid (FA) concentration [Palladino et al., 2010].
In the absence of any evidence on how different breeds respond to high MFD risk diets, it is worth considering how they respond to fat supplementation. Sears et al. (2020) conducted a study to understand how palmitic acid supplementation affected milk fat yield and composition in Holstein and Jersey cows. (Previous studies of responses to palmitic acid supplementation had only involved Holstein cows). They found that feeding palmitic acid consistently increased milk fat content and yield in both Holstein and Jersey cows. Jersey cows were more efficient at converting supplemental fat added into additional milk fat yield than Holsteins (36% vs. 21% respectively). Sears et al. (2020) concluded that this was due to differences in mammary gland extraction and incorporation of fatty acids into milk fat, as they did not observe any treatment or breed differences in fatty acid digestibility.
To understand if there are any breed differences in susceptibility to MFD it would be useful to conduct research studies in which lactating Jersey cows and Holstein cows managed under identical conditions were fed the same diets with low and high risk of MFD. Cows participating in each study would need to be at similar days in milk and milk yields. Given the large betweenanimal variability in susceptibility to MFD, these research studies would require large numbers of cows to enable any statistically significant breed difference to be identified. Another approach to understand if there are any breed differences in susceptibility to MFD would be to conduct a survey of commercial mixed-breed herds that had suffered periods of MFD. Herds recruited would need to be able to provide detailed, individual cow data on milk components, ideally recorded daily by an in-parlour milk metering system. Jersey cows and cows of other breeds within each of these herds that were at a similar stage of lactation and level of production would be selected, and their milk fat concentrations analysed to see if they are significantly different.
Casein
Casein is the predominate protein group in milk (about 80%), with whey protein making up the remaining 20%. Casein forms the building blocks of large colloidal particles called casein micelles that provide insoluble calcium phosphate to the suckling calf [Timlin et al., 2021]. Beta-casein is the second most abundant protein in cows’ milk, comprising 209 amino acids. The two main variants of beta-casein are A1 and A2, that differ at only one position in their amino acid sequence, position 67, which is histidine in A1 or proline in A2 milk. A1 beta-casein is a major form