3 minute read
E. Individual cow cell counts (Aust. herd recording data, 2000-2019


E. Individual cow cell counts (Aust. herd recording data, 2000-2019)
Table E.1. Percentages of lactations where the cow had at least one individual cow cell count >250,000 cells/mL; only individual cow cell counts by 400 days in milk were included and only lactations with 4 to 10 such counts were used. [DataGene, 2021].
Advertisement
FFFF JJJJ
Year No. lactations
2000 83,889 2001 86,034 2002 84,234 2003 83,230 2004 85,669 2005 87,141 2006 83,649 2007 81,648 2008 83,441 2009 79,826 2010 80,546 2011 85,795 2012 82,300 2013 79,471 2014 77,661 2015 74,488 2016 56,588 2017 57,078 2018 53,740 2019 48,060
% of lactations where atleast one individual cow cell count was >250,000
47.7% 42.8% 44.4% 43.6% 43.7% 45.6% 46.7% 48.1% 46.3% 46.0% 47.9% 45.7% 45.1% 42.1% 40.5% 38.9% 41.2% 38.6% 36.6% 32.0%
No. lactations
9,288 8,747 8,662 8,508 8,931 8,660 8,874 9,588 8,392 8,025 8,102 9,012 9,273 9,112 8,772 9,158 7,691 8,395 7,670 6,458
% of lactations where atleast one individual cow cell count was >250,000
48.1% 44.1% 43.9% 43.2% 44.3% 44.4% 47.5% 49.2% 45.9% 45.3% 49.0% 48.5% 46.1% 42.3% 42.7% 39.9% 43.3% 41.3% 37.9% 32.0%
Table E.2. Averages of peak individual cow cell counts for lactations; only individual cow cell counts by 400 days in milk were included and only lactations with 4 to 10 such counts were used. [DataGene, 2021].
FFFF JJJJ
Year No. lactations
Average of peak individual cow cell counts for lactations No. lactations
Average of peak individual cow cell counts for lactations
2000 83,889 2001 86,034 2002 84,234 2003 83,230 2004 85,669 2005 87,141 2006 83,649 2007 81,648 2008 83,441 2009 79,826 2010 80,546 2011 85,795 2012 82,300 2013 79,471 2014 77,661 2015 74,488 2016 56,588 2017 57,078 2018 53,740 2019 48,060 587.5 523.3 534.4 546.8 552.2 587.0 622.8 655.6 612.8 593.5 620.2 615.3 618.6 589.4 568.5 564.0 638.3 606.5 552.5 518.3 9,288 8,747 8,662 8,508 8,931 8,660 8,874 9,588 8,392 8,025 8,102 9,012 9,273 9,112 8,772 9,158 7,691 8,395 7,670 6,458 533.6 528.3 479.5 494.7 518.1 507.5 529.9 571.0 530.0 516.8 583.8 585.8 583.1 541.2 528.0 501.8 576.5 543.0 493.7 455.4
Table E.3. Averages of arithmetic average individual cow cell count for lactations; only individual cow cell counts by 400 days in milk were included and only lactations with 4 to 10 such counts were used. [DataGene, 2021].
FFFF JJJJ
Year No. lactations Average of average individual cow cell count for lactations No. lactations Average of average individual cow cell count for lactations
2000 83,889 2001 86,034 2002 84,234 2003 83,230 2004 85,669 2005 87,141 2006 83,649 2007 81,648 2008 83,441 2009 79,826 2010 80,546 2011 85,795 2012 82,300 2013 79,471 2014 77,661 2015 74,488 2016 56,588 2017 57,078 2018 53,740 2019 48,060 228.0 201.6 205.7 208.6 213.9 221.0 228.8 239.9 223.6 220.0 228.2 223.9 221.5 208.2 200.5 194.6 217.4 202.0 183.9 175.0 9,288 8,747 8,662 8,508 8,931 8,660 8,874 9,588 8,392 8,025 8,102 9,012 9,273 9,112 8,772 9,158 7,691 8,395 7,670 6,458 215.0 202.2 192.5 197.5 200.4 197.9 205.7 225.6 208.3 201.8 228.5 227.2 224.7 208.3 203.2 186.6 218.7 192.7 179.8 169.1
F. Relationship between ambient temperature and rectal temperature (Muller and Botha, 1993)
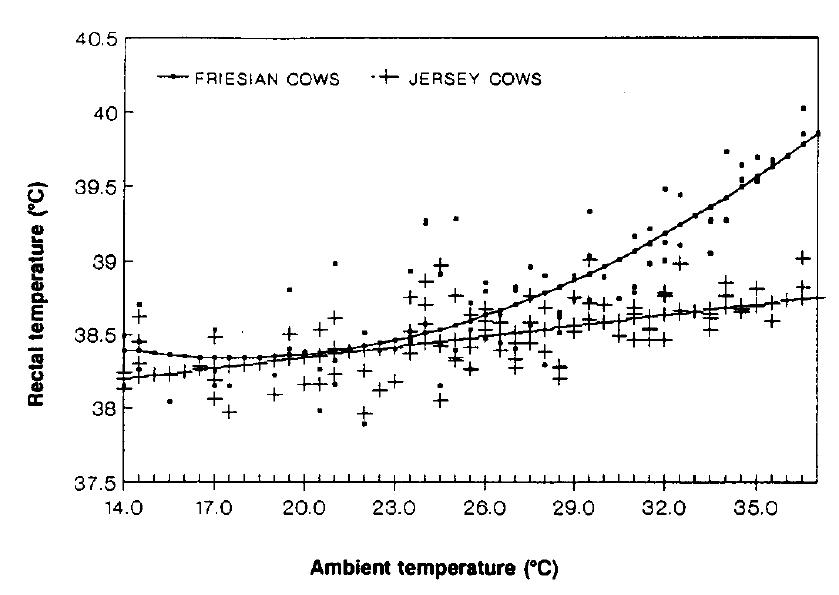
Figure F.1. The relationship between ambient temperature(x) and rectal temperature (y) of Friesian [y = 39.57 0.1403(SE = 0.0354)x+ 0.004(SE = 0.OOO7)xx2; R2 = 0.63] and Jersey cows [y = 37.86 - 0.02405(SE= 0.OO36)x;R2 = 0.30]. [Muller and Botha, 1993].
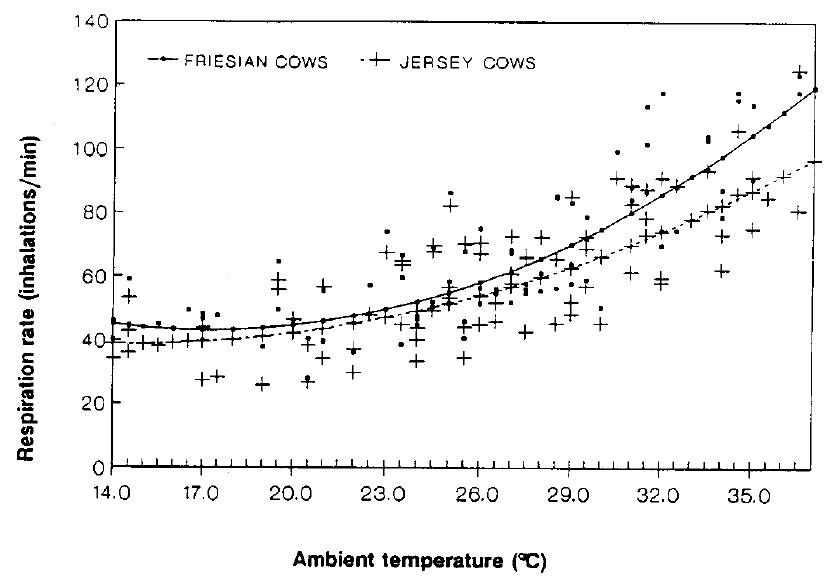
Figure F.2. The relationship between ambient temperature (x) and respiration rate (y) of Friesian [y = lOLl 6.728(SE = 1.511)x + 0.195(SE = 0.030)x2; R2 = 0.708] and Jersey cows [y = 62.80 - 3.315(5£ = 1.614)x + 0.115(5£ = 0.032)x2; R2 = 0.556]. [Muller and Botha, 1993].