5 minute read
Energy balance


Energy balance
Energy balance during the transition period and early lactation is the major driver of reproductive success in dairy cows. When a freshly-calved cow has inadequate intake of metabolic fuels and is in negative energy balance (NEB), various hormonal signals from the pancreas, liver and fatty tissues such as insulin, IGF-1, leptin etc. are inhibited, leading to reduced secretion of gonadotropin in the brain, which leads to: no FSH and LH pulses & pre-ovulatory LH surge, reduced ovarian secretion of hormones (oestrogen, progesterone), inhibiting hormonedependent reproductive behaviours, follicular development and ovulation. So NEB in early lactation, as exhibited by body condition loss post-calving, therefore manifests itself in more days to resumption of normal cycling activity, lower first service conception rate, and lower in-calf rates [Butler, 2003; LeRoy et al., 2008]. The duration and the magnitude of negative energy balance in early lactation appear to both be important. As shown by Santos et al. (2010), the relationships between energy secreted in milk (i.e. milk yield) and energy balance, and between energy required for maintenance (body size) and energy balance, are very weak, whereas the relationship between energy intake (i.e. feed intake) and energy balance is fairly strong.
Advertisement
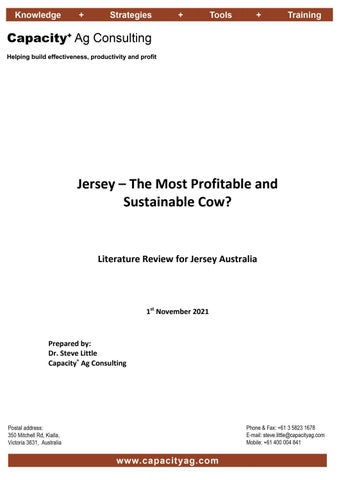
Few studies have been done that have compared energy balance in dairy cows of different breeds. Rastani et al. (2001) reported that in a confinement system Jerseys remained in NEB for a shorter period of time post-calving relative to Holsteins (8 weeks vs. 11 weeks) and that the magnitude of Jerseys’ NEB was less than that of Holsteins. Jerseys had a greater EB for the first 7 weeks of lactation relative to Holsteins (Figure 10).
Figure 10. Estimated tissue energy balance of Jersey cows (○) and Holstein cows (●) from week 1 to week 17 of lactation. Tissue energy balances calculated according to NRC (1989). Asterisks indicate that the tissue energy balance differed (P < 0.05) between the two breeds at that time point [Rastani et al., 2001].
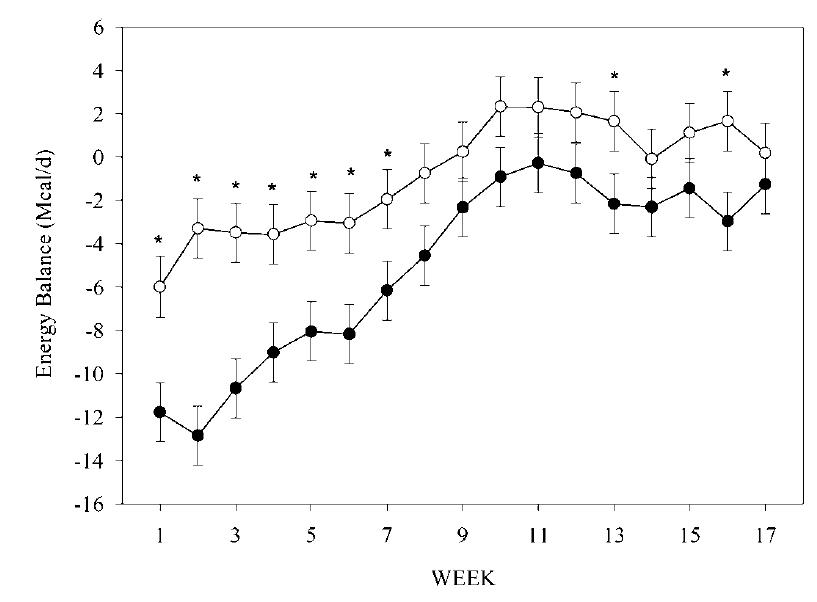
This is consistent with Brown et al. (2012), who found that plasma NEFA levels in second lactation cows were lower in Jerseys than in Holsteins. Washburn et al. (2002) conducted a multiple-year study in which groups of Jersey and Holstein cows were run in a pasture-based production system and a confinement system using a total mixed ration (TMR). They found that in each system, Jerseys had higher body condition scores (BCSs) than Holsteins cows throughout lactation, and that cows of both breeds in pasture-based system had lower BCSs than cows in the confinement system. They also found that the difference between the BCSs of Jerseys in the pasture-based system and the confinement system was less than that of Holsteins, indicating that Jerseys ate more than Holsteins relative to their body weight and milk production in the pasture-
based system (Figure 11). However, in a study of first-calvers, Olson et al. (2010) found that Jerseys took 12.8 weeks post-calving to first enter positive energy balance whereas Holsteins took 9.8 weeks.
Figure 11. Mean BCS (5-point scale, Y-axis) across lactation for cows calving in fall, 1996. Four treatment and breed groups are identified as follows: Holsteins fed a TMR in confinement (○), Holsteins fed pasture plus supplement (●), Jerseys fed a TMR in confinement (∆), and Jerseys fed pasture plus supplement ( ). In this example, treatment, breed, date, breed × date, treatment × date, and treatment × breed × date were all significant. (P < 0.05) [Washburn et al., 2002].
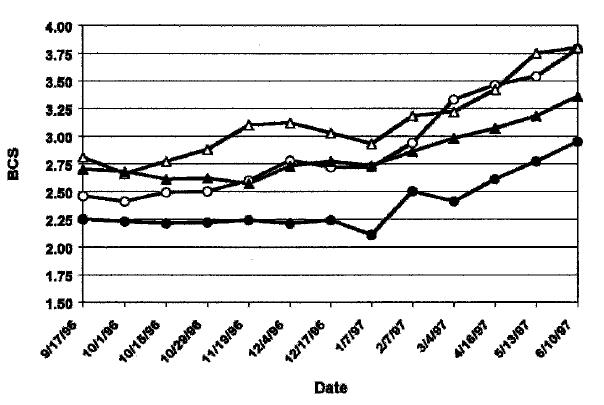
The extent to which cows’ appetites are depressed in the pre-calving transition period (last 3 weeks before calving) is important as it sets the trajectory for energy balance post-calving. French (2006) found that in a confinement system, while Holsteins’ feed intake dropped 35% in the last 3 weeks before calving, Jerseys cows’ feed intake only dropped 17%. NEFA concentrations in plasma were similar for the two breeds up to day 5 pre-calving, but greater for Holsteins compared with Jerseys thereafter. Energy balance was numerically greater for Holsteins at week 3 pre-calving, similar for breeds at week 2 pre-calving, and tended to be greater (P < 0.10) for Jerseys during the last 3 days pre-calving (Figure 12). (For charts of daily DM intake and plasma NEFA levels precalving from French et al., see Appendix D, Figures D.1 and D.2).
Figure 12. Least squares mean daily energy balance by day relative to parturition for Holsteins (○) and Jerseys (●). Interaction for breed by time was significant at the level of P < 0.01 (SE = 1.2, n = 14) [French, 2006].
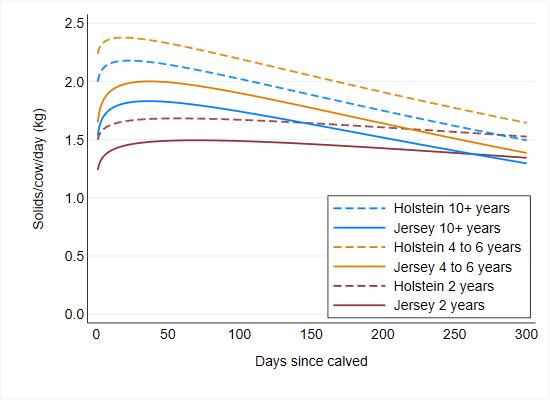
Analysis of Australian herd recording data held by DataGene shows that post-calving, Jersey cows take more days to reach peak milk yield than Holstein cows of the same age. This is particularly so in cows aged between 4 to 9 years (Figure 13) (Table 7). This provides further indirect evidence to support the theory that Jerseys are less reliant on body tissue reserves than Holsteins to supply nutrients to support milk production in early lactation. More research is required to quantify and compare the feed intakes, milk yields and daily energy balances of Jerseys and Holsteins through the transition period and early lactation in grazing systems.
Figure 13. Lactation curves of Jersey and Holstein cows (kg milksolids/cow/day) of different age groups, based on test days up to 400 days in milk for cows calved from 2011 [DataGene, 2021].
Table 7. Summary data - peak solids yield and time to peak solids by breed and age group (DataGene, 2021)
No. test Breed Age at calving
days
Day 1 milksolids yield (kg/cow/day)
Peak milksolids yield
(kg/cow/day)
Time to peak yield
(days)
JJJJ 2 years 158,375 1.24 1.49 69.7
FFFF 2 years 1,386,185 1.50 1.68 57.0
JJJJ 3 years FFFF 3 years 133,204 1.51 1,134,749 1.92 1.78 40.5 2.06 25.1
JJJJ 4 to 6 years
282,395 1.65 FFFF 4 to 6 years 2,413,372 2.24 2.00 37.1 2.38 18.8
JJJJ 7 to 9 years FFFF 7 to 9 years 100,030 1.64 891,265 2.22 2.00 36.8 2.38 19.9
JJJJ 10+ years FFFF 10+ years 21,701 1.54 187,338 2.00 1.83 36.3 2.18 23.0