4 minute read
9. Environmental footprint


Key points: Several studies have suggested that the emission intensity of milk production is about 8-12% lower with a Jersey herd compared to a Holstein herd when the life cycle analysis (LCA) approach was used to calculate GHG emissions However, there may be little difference between the breeds in emission intensity of milk production, as Jerseys emit more methane per kg DM intake compared to Holsteins
When respondents to the Jersey Australia survey were asked to give their level of agreement with the statement ‘Jerseys are more environmentally friendly than other breeds’, 80% agreed or strongly agreed, and 20% were unsure.
Advertisement
The livestock sector is responsible for about 18% of the total global greenhouse gas (GHG) emissions. As methanogenesis is inevitable and essential for rumen functioning, methane (CH4) emissions will account for a considerable amount of greenhouse gas emissions in the dairy industry.
One of the earliest greenhouse gas studies on the comparison between dairy breeds was conducted by Capper and Cady (2012) to investigate the environmental impact of milk from Jersey and Holstein cows for cheese production in USA. They found that for Jersey and Holstein herds to produce the same amount of protein, milkfat and other solids (500,000 t of cheese), the Jersey herd’s total GHG emissions (carbon dioxide + methane + nitrous oxide emissions) were 21% lower than the Holstein herd’s (6,442 × 103 t vs. 8,104 × 103 t).
These observations are in agreement with other studies. Bangani et al. (2019) examined a kikuyu based pasture system in South Africa and found that despite Jersey’s having higher carbon emissions when expressed as proportions of dry matter intake or body weight, Jerseys produced lower methane emissions/kg energy-corrected milk (ECM) across all parities and all stages of lactation. (See Appendix I for more information). Dalla Riva et al. (2014) found greater CO2 equivalent emissions per unit ECM production in Holsteins compared to Jerseys, when examined in an intensive Italian dairy system; the results being 0.80 kg CO2eq/kg ECM for Jerseys, and 0.96 kg CO2eq/kg ECM for the Holstein herd (a 17% difference). Kristensen et al. (2014) found that Jerseys produced 1.26 kg of ECM per MJ of CH4 compared to 1.12 kg of ECM per MJ of CH4 for Holstein-Friesians (a 12.5% difference).
In contrast, the results of Olijhoek et al. (2018) suggested that there were little differences between Holstein and Jersey cows in methane production per kilogram ECM. However it must be noted that in the study by Olijhoek et al. (2018) respiration chambers were used to measure CH4 production, as opposed to the national inventory approach used by Dalla Riva et al. (2014). Olijhoek et al. (2018) also found the Jersey cow had a higher CH4 production, relative to dry matter intake, postulating a difference in microbial community structure between the two breeds.
There is little comparative data from Australia. In one of the early modelling studies conducted for the dairy industry in Australia, Bell et al. (2013) reported that the enteric CH4 emissions were 340 g/day for Holsteins and only 281 g/day for the Jersey cow. However, when the enteric CH4 emissions (which contribute about 77% of the total CO2-eq emissions) were expressed on an ECM basis, there appeared to be little difference between the breeds.
The Australian Dairy Carbon Calculator (ADCC), which incorporates the International Panel on Climate Change and Australian inventory methodologies, algorithms and emission factors, has been used to estimate the total greenhouse gas emissions from dairy farms in Australia [Christie et al., 2012, 2018]. Using the average production values reported by Bell et al. (2013) the total GHG emissions from a Jersey herd were compared to a Holstein herd, using the ADCC. Karen Christie (personal communication, 2021) calculated the total farm GHG emissions and expressed them as tonne CO2 equiv/year (2,231 and 2,298, for Holstein and Jersey farms, respectively), or emission intensity in kg CO2 equiv/kg fat and protein corrected milk (0.94 and 0.87, for Holstein and Jersey farms, respectively). This represents an 8% decline in emission intensity for the Jersey herd. The energy intensity of milk production results of this study was also similar to other published Australian studies, based on real-farm data (Christie et al., 2018), confirming any assumptions made in the current study align with real farm data.
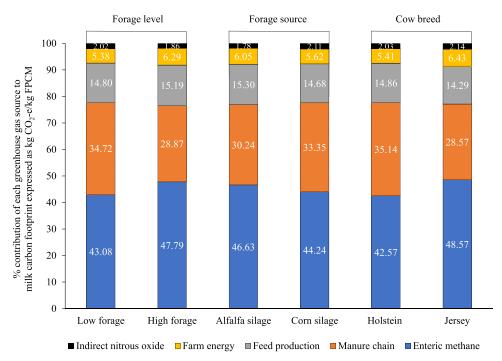
In summary, the results of several international studies suggest that the emission intensity of milk production is about 10% lower with the Jersey herd compared to a Holstein herd when the lifecycle analysis (LCA) approach is used to calculate GHG emissions. However, the Jerseys were only lower because the LCA approach assumed the same methane emission per kg dry matter intake. Several recent experimental studies measuring enteric CH4 in respiration chambers such as those reported by Olijhoek et al. (2018) and Uddin et al. (2020) have found that this is not the case, and that Jerseys emit more CH4 per kg DM intake compared to Friesians (Figure 23). Therefore, if the LCA methodology reflected this higher CH4 emission per kg of DM intake for Jerseys, compared to Holsteins, there may have been little difference between the breeds. Further research is required.
Figure 23. Percentage contribution of different greenhouse gas sources to cradle-to-farmgate carbon footprint [kg CO2-e/kg fat-and-protein corrected milk (FPCM)] for different dietary and breed scenarios [Uddin et al., 2020].