‘Jersey – The Most Profitable and Sustainable Cow?’ – Literature Review for Jersey Australia
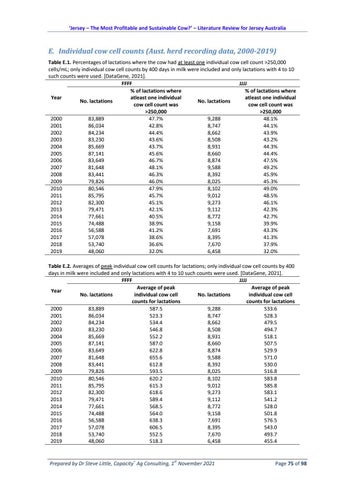
E. Individual cow cell counts (Aust. herd recording data, 2000-2019) Table E.1. Percentages of lactations where the cow had at least one individual cow cell count >250,000 cells/mL; only individual cow cell counts by 400 days in milk were included and only lactations with 4 to 10 such counts were used. [DataGene, 2021]. FFFF JJJJ % of lactations where % of lactations where Year atleast one individual atleast one individual No. lactations No. lactations cow cell count was cow cell count was >250,000 >250,000 2000 83,889 47.7% 9,288 48.1% 2001 86,034 42.8% 8,747 44.1% 2002 84,234 44.4% 8,662 43.9% 2003 83,230 43.6% 8,508 43.2% 2004 85,669 43.7% 8,931 44.3% 2005 87,141 45.6% 8,660 44.4% 2006 83,649 46.7% 8,874 47.5% 2007 81,648 48.1% 9,588 49.2% 2008 83,441 46.3% 8,392 45.9% 2009 79,826 46.0% 8,025 45.3% 2010 80,546 47.9% 8,102 49.0% 2011 85,795 45.7% 9,012 48.5% 2012 82,300 45.1% 9,273 46.1% 2013 79,471 42.1% 9,112 42.3% 2014 77,661 40.5% 8,772 42.7% 2015 74,488 38.9% 9,158 39.9% 2016 56,588 41.2% 7,691 43.3% 2017 57,078 38.6% 8,395 41.3% 2018 53,740 36.6% 7,670 37.9% 2019 48,060 32.0% 6,458 32.0% Table E.2. Averages of peak individual cow cell counts for lactations; only individual cow cell counts by 400 days in milk were included and only lactations with 4 to 10 such counts were used. [DataGene, 2021]. FFFF JJJJ Average of peak Average of peak Year No. lactations individual cow cell No. lactations individual cow cell counts for lactations counts for lactations 2000 83,889 587.5 9,288 533.6 2001 86,034 523.3 8,747 528.3 2002 84,234 534.4 8,662 479.5 2003 83,230 546.8 8,508 494.7 2004 85,669 552.2 8,931 518.1 2005 87,141 587.0 8,660 507.5 2006 83,649 622.8 8,874 529.9 2007 81,648 655.6 9,588 571.0 2008 83,441 612.8 8,392 530.0 2009 79,826 593.5 8,025 516.8 2010 80,546 620.2 8,102 583.8 2011 85,795 615.3 9,012 585.8 2012 82,300 618.6 9,273 583.1 2013 79,471 589.4 9,112 541.2 2014 77,661 568.5 8,772 528.0 2015 74,488 564.0 9,158 501.8 2016 56,588 638.3 7,691 576.5 2017 57,078 606.5 8,395 543.0 2018 53,740 552.5 7,670 493.7 2019 48,060 518.3 6,458 455.4
+
st
Prepared by Dr Steve Little, Capacity Ag Consulting, 1 November 2021
Page 75 of 98


