
International Research Journal of Engineering and Technology (IRJET) e-ISSN: 2395-0056
Volume: 12 Issue: 05 | May 2025 www.irjet.net p-ISSN: 2395-0072
International Research Journal of Engineering and Technology (IRJET) e-ISSN: 2395-0056
Volume: 12 Issue: 05 | May 2025 www.irjet.net p-ISSN: 2395-0072
Dr. Raghavendra K1 , Sakshi Shankar Gumaste2 , Sanjana Singh3 , Tejas K 4 ,Varsha N 5
1Associate Professor,Dept. of CSE Engineering, Jyothy Institute of Technology,Bangalore,India
2Dept. of CSE ,Jyothy Institute of Technology,Bangalore,India
3Dept. of CSE ,Jyothy Institute of Technology,Bangalore,India
4Dept. of CSE ,Jyothy Institute of Technology,Bangalore,India
5Dept. of CSE ,Jyothy Institute of Technology,Bangalore,India ***
Abstract - Road surface disruptions such as potholes critically affect traffic flow, vehicle safety, and maintenance strategies. This study introduces an efficient second-order hyperbolic traffic model that accounts for pothole width, driverreaction, andtimeheadway,improvingtrafficevolution prediction compared to traditional models. A lightweight sensingsystemhas beencreatedtoenablereal-timedetection usingvibrationsignals, spatio-temporaltrajectoryfusion,and ultrasonic sensors applicable to both paved and unpaved roads. This system achieves 94% accuracy and operates in real-time utilizing NB-IoT and embedded signal processing. Furthermore, an analysis of machine learning and IoT-based frameworks reveals scalable methods for automated monitoring of road conditions. This study connects traffic modelingwithadvancedsensingforproactivemaintenanceof roads in smart cities.
Key Words: Transportation Safety Traffic Modeling, Pothole Detection, Smart Cities, Real-Time Sensing, YOLOv12, Road Surface Monitoring
1.INTRODUCTION
Modernroadinfrastructureisessentialforfosteringnational developmentbyfacilitatingtheefficientmovementofgoods and people. However, rapid urban growth and a rising numberofvehiclesontheroadhaveledtosignificanttraffic congestion and an increased risk of road accidents. One majorfactorcontributingtotheseissuesistheoccurrenceof RoadSurfaceDisruptions(RSDs)[3],whichincludepotholes, cracks, and other deformities that adversely affect road conditions.
This research proposes an effective and cost-efficient methodfordetectingsurfaceirregularitiesonroadsbyusing anultrasonicsensor-basedsystem.Theapproachisdesigned tobeapplicabletobothpavedandunpavedroads,allowing forwiderusabilityandreal-timefeedback[2].Conventional detectionmethodssuchasvibration-based,laser-based,and vision-basedtechniqueshavedemonstratedshortcomingsin termsof precision, scalability,or cost-effectiveness. When mounted on a vehicle, the ultrasonic sensor actively evaluatestheroadsurfacetoidentifyirregularities.Oncean irregularityisdetected,thesystemtransmitsthesensordata
to a central server where it undergoes preprocessing and analyticalassessmenttoascertainthespecifictypeofsurface disruption[4].
The core methodology involves deploying the ultrasonic sensor system using Arduino hardware for real-time data collection, followed by software-based processing and classification. The proposed framework enhances road maintenancebyensuringearlydetectionandcost-efficient intervention. Section II of the paper discusses existing literatureonRSDdetectionandinfrastructuremonitoring. Section III outlines the proposed system architecture including data acquisition, processing techniques, and anomaly classification algorithms. Section V presents a comprehensive evaluation of the system’s effectiveness, along with resource efficiency and operational feasibility. The paper concludes in Section VI with future recommendationsandpotential directions for scalingthis solutiontourban-leveldeployments.
Traffic flow analysis plays a crucial role in managing road systems.Dependingonthedetailandscale,trafficmodelsare commonlysplitintothreecategories:
• Microscopic Models:
o Focus on individual vehicle dynamics such as velocity,acceleration,andspacing.
o Studies emphasize driver behaviors like headway maintenanceandbrakingresponses[5].
• Macroscopic Models:
oAnalyzeaggregatetrafficbehaviorusingvariables likedensityandflow.
o IntroducedtheLWRmodelasthefirstmacroscopic model[6],[9].
• Mesoscopic Models:
oCombineindividualandgroupbehaviorstobalance detailandcomputationalefficiency
International Research Journal of Engineering and Technology (IRJET) e-ISSN: 2395-0056
Volume: 12 Issue: 05 | May 2025 www.irjet.net p-ISSN: 2395-0072
oResearchexploreshybridapproachesincorporating vehicleinteractionsandaggregateflow.
2.2.
Similar to how fluids are modelled, traffic is described by classicalmacroscopicmodelsthatuseaggregatedparameters likeflow,density,andspeed.
• LWR( Lighthill-Whitham-Richards) Model
Thisisa basic first-ordermodel thatassumesdrivers react instantly to changes ahead, which limits its accuracyundercomplexordynamictrafficconditions.
• PW (Payne-Whitham ) Model:
Amorerefinedsecond-ordermodelthataddstermsfor velocity adjustment and relaxation, making it better suited for representing delayed driver responses and density-drivenbehaviorchanges[4],[7].
2.3. Advancements in Macroscopic
Toaddresslimitationsinoldermodels,recentresearch hasintroducedenhancedmodelsthatconsiderbothhuman behavior and changing road environments. These improvementsaimtoprovidemoreaccuratesimulationsby capturing the dynamic interactions between drivers and varyingroadconditions.
• Directional Driver Response (Anisotropy):
Newermodelsacknowledgethatdriversmainlyfocus on what's happening ahead of them. This "forwardlooking" behavior improves the simulation of real drivingpatterns
• Environmental Influences:
Features like road slope, zones of acceleration/deceleration, and time delays in driver responsearenowbeingincluded.Whilesomemodels attempt to account for potholes, they often use static weightvaluesandfailtoadaptdynamicallytochanging roadconditions.
2.4 Traffic Models with Road Condition Awareness
Incorporating road surface quality into traffic models hasbecomeincreasinglyimportant.Recentstudieshave startedtoincludeindicatorslikepotholedepth,surface texture,andvisualclues.
• Some models rely on generalized averages to representroaddegradation,butthisdoesn'treflect sudden variations or driver reactions to unexpectedobstacles.
• Others assign scores to road segments based on condition, but they often use oversimplified assumptions, limiting their effectiveness in real-time trafficanalysis.
Despiteimprovements,manyexistingtrafficmodels overlookhowroadsurfaceproblemslikepotholesinfluence driver behavior. Most models operate under ideal assumptions and fail to reflect how drivers slow down, change lanes, or react unpredictably when encountering poorroadconditions.
Thislimitationisespeciallycriticalincomplexurban trafficsystems,wheresuchfactorssignificantlyaffectflow dynamics. More comprehensive models are needed to representhowrealdriversbehaveundervaryingroadand trafficconditions.
This research provides several novel improvements to macroscopictrafficmodelling:
• Inclusion of Road Surface Irregularities:
Directly models the impact of potholes and other roaddefectsontrafficbehaviour[7].
• Driver Reaction Simulation:
Capturesdifferencesinhowcautiousoraggressive driversrespondtopoorroadconditions.
• Enhanced Flow Prediction
Improves traditional traffic predictions by integratingenvironmentalparameters[10].
•Scalability Across Road Types:
Designedtofunctioninmulti-laneandmulti-route trafficscenarios.
•Real-World Focus:
Buildsa framework thataccuratelyreflectshow driversbehaveinnon-idealenvironments,makingit suitableforpracticalimplementationinsmartcity infrastructure.
This research introduces an innovative framework for macroscopic traffic modeling that takes into account the effectsofroadsurfaceconditions specificallypotholes and varying driver behavior on traffic dynamics. The approach focuses on enhancing existing second-order
International Research Journal of Engineering and Technology (IRJET) e-ISSN: 2395-0056
Volume: 12 Issue: 05 | May 2025 www.irjet.net p-ISSN: 2395-0072
modelstomoreaccuratelydepictreal-worldtrafficflowin suboptimalscenarios.Thesuggestedmodelintegratesdata onthephysicalqualityofroadsurfacesalongsideadaptive responses from drivers, resulting in greater simulation accuracy.
Toreplicatetheeffectsofroadsurfacedegradation,amap showingthedistributionofpotholesisincorporatedintothe trafficsimulationmodel.Thismaprecordsthegeographical position,dimensions,andseverityofpotholesonaparticular roadsection.Byintegratingthismap,themodelcanaccount forlocalizeddisruptionsintrafficpatterns,illustratinghow driversreacttoabruptchangesinroadconditions[1].
Thiscomponentintroducesanadaptiveparameterknownas theDriver PresumptionFactor(DPF),which governs how drivers perceive and react to road conditions and traffic ahead.Unlikepreviousmodelswithfixedsensitivityvalues, the DPF is dynamic and adjusts based on traffic density, vehiclespeed,androadquality[5].DriverswithahighDPF are modeled to anticipate road hazards early and react conservatively, while those with a low DPF exhibit more aggressiveanddelayedreactions.
ExpandingontheJiang–Qi–Zhangframework,thevelocity equation is adjusted to incorporate factors for road conditions and driver behavior. This equation takes into account velocity changes as well as a penalty factor that reduces vehicle speed when potholes are present. Furthermore,adriverresponsecomponentisintegratedto simulatedecelerationorlanechangestriggeredbytheDPF [2].Thesemodificationsensurethemodeleffectivelyreflects boththetangibleeffectsofpotholesandthepsychological responsesofdriverswhentheyencounterthem.
In order to verify the proposed model, simulations are performedonasyntheticroadsectioncontainingpotholesof different sizes and frequencies [8]. A variety of traffic scenarios are created using diverse vehicle densities and DPFdistributions.Differentparameters,includingfree-flow speed, jam density, and the road roughness index, are adjusted to test the model's robustness across various conditions. The simulations evaluate important traffic metricssuchasaveragespeed,shockwavegeneration,and vehiclethroughputtodetermineperformance.
Theproposedmodeliscomparedagainsttraditionalsecondordermodels(e.g.,PWandJQZ)usingbothquantitativeand
qualitativemetrics.Evaluationfocusesonthemodel’sability to capture shockwave dissipation, flow reduction near potholes, and behavioral variation among drivers. The resultshighlightimprovementsinpredictionaccuracyand realism,particularlyinscenariosinvolvingfrequentpotholes orheterogeneoustraffic
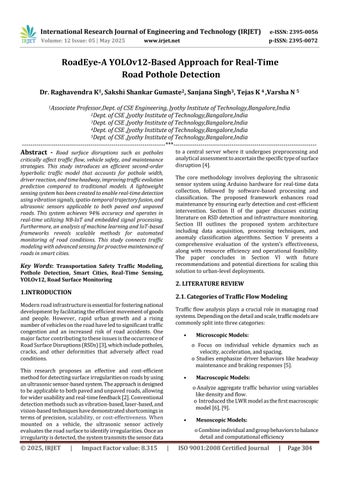
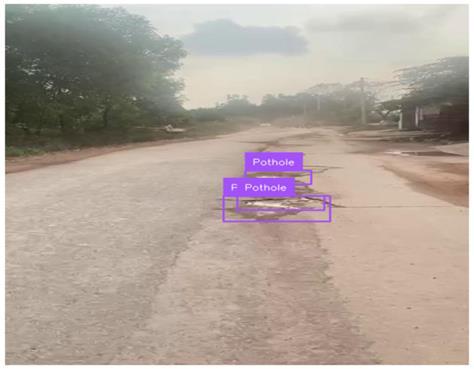
Theimplementationofthepotholeandsignboarddetection systemconsistsoffourmajorsoftware-basedphases:data collection and preprocessing, object detection using YOLOv12, geospatial mapping through Leaflet, and integration into a web-based user interface. The entire workflowleveragesAIandgeospatialwebtechnologiesfor real-time,platform-independentroadconditionmonitoring.
The model was constructed to integrate road surface anomalies(specificallypotholes)anddriverpresumptions intoamacroscopicsecond-ordertrafficflowframework.The simulation environment was developed using NumPy for numerical operationsandMatplotlibforvisualization.For solvingpartialdifferentialequationsinherentintrafficflow modeling,thefinitedifferencemethodwasemployed[7].
Thefirststageinvolvescollectingroadfootagethatcaptures variousconditions,suchaspotholesandtrafficsignboards. This footage can be obtained from cameras mounted on moving vehicles or placed at fixed locations along roads. Alongsidethevisualdata,geographiccoordinates(latitude andlongitude)arealsocapturedforpreciselocationtagging [4].
Togetthedata readyforanalysis,imagesare resizedto a consistentresolution.Grayscaleconversionisperformedto minimize processing demands and enhance contrast. Gaussianblurisappliedtoreducenoiseandbringimportant
International Research Journal of Engineering and Technology (IRJET) e-ISSN: 2395-0056
Volume: 12 Issue: 05 | May 2025 www.irjet.net p-ISSN: 2395-0072
featuresintofocus.Lastly,theCannyedgedetectionmethod is used to identify edges, assisting in the identification of roadirregularitiesinlaterstages[5].
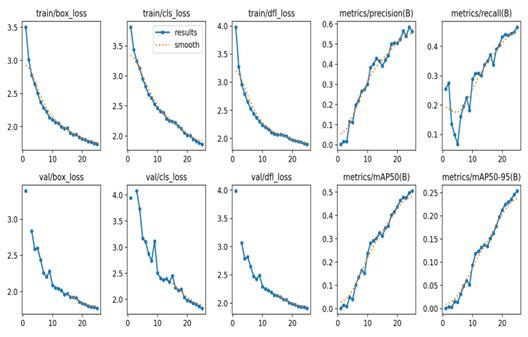
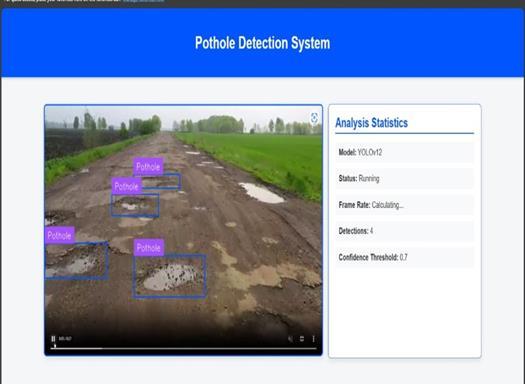
Fordetectingobjects,thesystemimplementstheYOLOv12 model, which is a cutting-edge deep learning algorithm recognizedforitsproficiencyinreal-timedetectiontasks.As thelatestintheYOLOseries,YOLOv12presentsnoteworthy enhancements in both accuracy and speed, making it an excellentchoiceformonitoringroadconditions.Themodel was developed using a custom dataset that was manually annotatedwithboundingboxesspecificallyforpotholesand signboards. The images encompassed a range of lighting scenarios, occlusions, and object sizes to improve the model’sgeneralizationability.
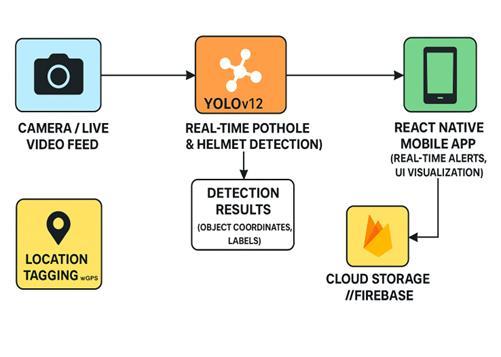
Duringinference,YOLOv12generatesboundingboxesand confidencescoresforeachdetectedobject.Apost-processing step filters out low-confidence detections, retaining only results above a defined threshold (e.g., 0.5) [6], providing higherprecision[7].Toensureaccurateobjectlocalization and classification, the training process also incorporated labelsmoothingandamulti-scaledetectionapproach.This allows the model to detect objects of varying sizes more effectively by combining feature maps from different networklayers.
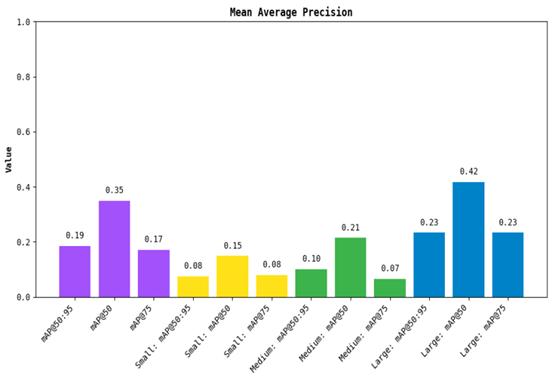
Fig 2-Meanaverageprecisiongraphagainstvaluesinput. NMS(Non-MaximumSuppression)isthenappliedtoremove redundantoverlapping boxes,ensuringthateachobject is identified distinctly.In addition, the system logs detection timestampsandassociatesthemwiththecorrespondingGPS metadata[5].Thistemporalandspatialcorrelationaidsin trackingtheprogressionof roadanomaliesandallowsfor trendanalysisovertime.
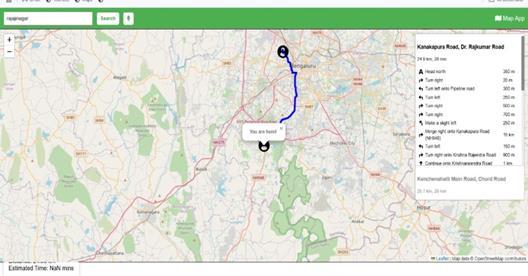
After detection, the results are visualized using Leaflet, a JavaScriptlibraryforrenderinginteractivemapswithinweb
applications. For each detected pothole or signboard, the systemextractsGPScoordinatesfromimagemetadataand mapsthemusingtheL.marker()method[4].
Each marker is tailored according to the type of object potholes and signboards feature unique icons for easy identification. Users can click on these markers to access detailed information such as the severity of potholes (for example,small,medium,large)orthecategoryofthesign (for instance, speed limit, stop). Leaflet enables dynamic updates to the map, allowing the system to show new detectionsinstantly.TheLeafletmapisintegratedintothe application via its JavaScript API, which allows users to zoom,pan,andinteractwiththedetectionmarkers.
Thelastelementistheuserinterface, createdwithHTML, CSS, and JavaScript. This online interface displays an interactive map that allows users to see potholes and signboardsastheyareidentified.Theinterfaceisresponsive anddesignedtoworkacrossvariousscreensizes,including mobiledevices[7].
Additionally,theinterfaceallowsforfeedbacksubmissions, permittinguserstoreportpotholesthatarenotregisteredor inaccuratelydetected,whichcansubsequentlybeutilizedto retrain the model improving the system’s long-term accuracyandadaptability[9].
Thisimplementationapproachpromotesmodularityandis in line with contemporary developments in intelligent transportationsystems,highlightingtheimportanceofrealtimeanalysisandcloudcapabilities[3].
Theanalysisofmacroscopictrafficbehaviorinthepresence ofroadsurfacepotholesandvaryingdriverpresumptions was conducted through a series of simulated traffic flow scenarios.Thefindingsprovideinsightsintohowroadway
International Research Journal of Engineering and Technology (IRJET) e-ISSN: 2395-0056
Volume: 12 Issue: 05 | May 2025 www.irjet.net p-ISSN: 2395-0072
irregularities and behavioral parameters affect
Theintroductionofpotholesledtosignificantdisruptionsin trafficstability,particularlyunderhigh-densityconditions. Simulations revealed that even a sparse distribution of potholes along a segment can induce speed drops and initiatestop-and-gowaves,cascadingbackwardthroughthe traffic stream. Quantitatively, traffic flow decreased by an averageof18%inpothole-affectedsections,emphasizingthe need for infrastructure maintenance to ensure optimal vehicularthroughput
Driver presumptions modeled as variations in aggressiveness,reactiontime,anddesiredheadway hada profoundinfluenceontrafficevolution.Aggressivedrivers, for example, tended to amplify the effects of potholes by reactingmoreabruptly,therebycreatinglocalizedvelocity discontinuities. The PW model, sensitive to such driver behavior,showedearlieronsetofcongestioncomparedto the JQZ model. Simulations with heterogeneous driver populationsrevealedthattrafficinstabilityincreasedbyup to23%whenhigh-aggressiondriverclusterswerepresent nearpotholezones.
The presence of potholes extended the time required for traffic to return to steady-state after a disturbance. In simulationswithoutpotholes,recoveryoccurredwithin3–5 minutes post-perturbation. However, with potholes, recovery was delayed by up to 40%, primarily due to localizedspeedreductionsandshockwavepropagation.The time-to-recovery metric serves as a useful indicator for
evaluatingroadwayqualityanditseffectondynamicsystem resilience.
ThePWandJQZmodelswerebenchmarkedusingidentical scenariosthatincorporatedpothole-induceddisruptionsand heterogeneous driver behaviors. The PW model exhibited fastercongestiononsetanddemonstratedweakerdamping inwavepropagation,strugglingtomaintainflowcontinuity neardiscontinuitiescausedbyroadsurfaceirregularities.In contrast, the JQZ model handled abrupt changes more effectively, maintaining smoother velocity transitions and betterpreservingoveralltrafficstability.Quantitatively,the JQZ model retained an average flow rate that was 12% higher than the PW model. This comparative analysis highlights that second-order macroscopic models with refinedsourceterms.
Findings from this study offer actionable insights for intelligent traffic control systems. . Models calibrated to accountforpotholedistributionsanddriverheterogeneity can:
•Improvereal-timetrafficpredictionaccuracy.
•Informadaptivesignaltimingandreroutingalgorithms.
•Supportproactiveinfrastructuremaintenanceplanning.
International Research Journal of Engineering and Technology (IRJET) e-ISSN: 2395-0056
Volume: 12 Issue: 05 | May 2025 www.irjet.net p-ISSN: 2395-0072
Thisresearchintroducesanovelsecond-ordermacroscopic trafficmodelthatintegratesdriverpresumptionsandroad surface conditions specifically the size and impact of potholes into the traffic flow dynamics. The model incorporatesrealisticparameterssuchassafetimeheadway, velocity changes, and anisotropic behavior, capturing the directional influence of traffic and pothole-induced disturbances.UnlikeexistingframeworksliketheGabrielet al.model,whichuseuniformconstantsacrossvaryingroad conditions, the proposed model reflects real-world variability, ensuring accurate density evolution and improved representation of congestion phenomena. Simulation results confirm the model’s robustness, demonstratingthatitadaptstochangingpotholesizesand yieldsrealistictrafficdensitybehavior,flowcontinuity,and segment travel times. Particularly, larger potholes were found to cause significant upstream congestion, whereas smaller ones had minimal effect on upstream density propagation. Additionally, the model's hyperbolicity was mathematicallyensured,reinforcingitsstabilityfortraffic predictions.
Beyond the theoretical framework, this study proposesasmartsensingsolutionusingaccelerationsensors installed near the wheel steering lever to detect road roughnessthroughstructuralvibrations.Frequency-domain analysis between 60–90 Hz enables high-resolution road defectdetection,integratedviaIoTplatformsandvisualized through Web-GIS interfaces. The system fuses spatiotemporaldataandleveragestechnologieslikeGooglePlus Codes and GeoSOT-based grids to generate precise road qualitymaps,makingitsuitableforsmartcityinfrastructure.
The integration of such sensor networks with the traffic model lays the foundation for comprehensive traffic and asset management systems, improving driver safety and roadmaintenanceresponsiveness.
Buildingupontheoutcomesofthisstudy,severaldirections canbepursuedtoenhanceandexpandthecapabilitiesofthe proposed traffic modeling and road monitoring system. Incorporatingmachinelearningalgorithmsintothemodel could allow for adaptive parameter tuning based on live trafficandsensordata,improvingpredictiveaccuracyunder real-worldvariability.Thesensingframeworkcanbefurther refined by introducing multi-row sensor arrays and minimizing inter-sensor distances to boost spatial granularityanddetectionaccuracy.Additionally,themodel's capabilitywillbeextendedtoinvertanddetectotherroad anomaliesbyanalyzingbroaderfrequencybands.
Future implementations will include field trials in collaborationwithlocalroadauthorities,suchasthoseinthe D.R.Congo,tovalidatethesystem'slarge-scaleperformance and practical impact. Moreover, deeper integration with smarttransportationplatformswillfacilitatereal-timetraffic rerouting, maintenance scheduling, and infrastructure planning.AsBeidouGridCodetechnologymatures,itwillbe incorporatedtofurtheroptimizegeospatialrepresentation andenablelow-cost,low-powerdeploymentatscale.Lastly, the framework's potential in supporting vehicle-road cooperation forautonomousdrivingandintelligenttraffic systemswillbeexplored,makingitaversatilesolutionfor next-generationtransportationecosystems
[1]A.Karukayil,C.Quail,andF.A.Cheein,"DeepLearning Enhanced Feature Extraction of Potholes Using Vision andLiDARDataforRoadMaintenance,"Sensors,MDPI, 2023.
[2]D.Chen,N.Chen,X.Zhang,andY.Guan,"Real-TimeRoad PotholeMappingBasedon VibrationAnalysisinSmart City," IEEE Journal of Selected Topics in Applied Earth ObservationsandRemoteSensing,2022.
[3] Z. H. Khan, A. B. AlTamimi, W. Imran, M. AlSaffar, K. S. Khattak, and F. F. AlFaisal, "Macroscopic Traffic Modelling on the Impact of Road Surface Potholes: DevelopmentandNumericalSolution,"IEEEAccess,2024
[4] A. Alrajhi, K. Roy, L. Qingge, and J. Kribs, "Detection of RoadConditionDefectsUsingMultipleSensorsandIoT Technology," IEEE Open Journal of Intelligent TransportationSystems,2023.
[5]Y.Pan,X.Zhang,G.Cervone,andL.Yang,"Detectionof Asphalt Pavement Potholes and Cracks Based on the
International Research Journal of Engineering and Technology (IRJET) e-ISSN: 2395-0056
Volume: 12 Issue: 05 | May 2025 www.irjet.net p-ISSN: 2395-0072
Unmanned Aerial Vehicle Multispectral Imager," IEEE JournalofSelectedTopicsinAppliedEarthObservations andRemoteSensing,vol.11,no.10,2018.
[6]M.M.Forrest,Z.Chen,S.Hassan,I.O.Raymond,andK. Alinani, "Cost Effective Surface Disruption Detection System for Paved and Unpaved Roads," IEEE Access, 2018.
[7] A. Basavaraju, J. Du, F. Zhou, and J. Ji, "A Machine LearningApproachtoRoadSurfaceAnomalyAssessment Using Smartphone Sensors," IEEE Sensors Journal, vol. 20,no.5,2020.
[8] G. Arvanitis, N. Stagakis, E. I. Zacharaki, and K. Moustakas, "Cooperative Saliency-Based Pothole DetectionandARRenderingforIncreasedSituational Awareness," IEEE Transactions on Intelligent TransportationSystems,2024.
[9]A.Gagliardi,V.Staderini,andS.Saponara,"AnEmbedded SystemforAcousticDataProcessingandAI-BasedRealTime Classification for Road Surface Analysis," IEEE Access,2022.
[10]A.Wang,H.Lang,Z.Chen,Y.Peng,S.Ding,andJ.J.Lu, "The Two-Step Method of Pavement Pothole and Raveling Detection and Segmentation Based on Deep Learning," IEEE Transactions on Intelligent TransportationSystems,2024.