
International Research Journal of Engineering and Technology (IRJET) e-ISSN:2395-0056
Volume: 12 Issue: 07 | Jul 2025 www.irjet.net p-ISSN:2395-0072

International Research Journal of Engineering and Technology (IRJET) e-ISSN:2395-0056
Volume: 12 Issue: 07 | Jul 2025 www.irjet.net p-ISSN:2395-0072
Manikanta Prasad J1 Hemanth N G2
1Assistant Professor, Dept. Of CSE, Adichunchanagiri Institute of Technology, Chikkamagaluru India
2PG Scholar, Department Of CSE, Adichunchanagiri Institute of Technology, Chikkamagaluru India
Abstract - Amazon Web Services (AWS) is a globally leading cloud platform that offers an extensive array of computing, storage, database, networking, and machine learning services. Its ability to deliver scalable, flexible, and cost-efficient cloud solutions has transformed the way businesses operate in today’s digital economy. AWS facilitates the dynamic expansion of digital infrastructures, supporting startups, enterprises, and government organizations alike. This paper delves into the practical implementation of real-time metric visualization usingAWS CloudWatch combined with Auto Scaling mechanisms. CloudWatch serves as a centralized monitoring system that collects, aggregates, and visualizes operational data from AWS resources and applications. It empowers users to create customized dashboards, configure alarms for critical metrics, and gain actionable insights into system behavior. Meanwhile, Auto Scaling automatically adjusts computing capacity in response to changes in system load, ensuring optimalperformancewithouthumanintervention.
The integration of CloudWatch with Auto Scaling enhances cloud resource management by enabling real-time health monitoring, automated scaling based on thresholds, and proactive issue detection. Through continuous observation and automated adjustments, organizations can achieve higher availability, better fault tolerance, lower operational costs, and faster incident response. Additionally, this study emphasizes the role of DevOps practices in modern cloud environments. By embedding continuous monitoring, infrastructure automation, and predictive analytics into development workflows, businesses can optimize software delivery pipelines and maintain resilient, high-performing cloud-native applications. The close relationship between metric visualization, auto scaling, and agile operations exemplifiesthecoreprinciplesofcloudengineeringtoday focusing on performance optimization, cost efficiency, and seamless scalability. Thus, this work demonstrates how leveraging AWS services strategically can significantly improve operational excellence, strengthen infrastructure resilience,andfosterinnovationincloud-basedsystems.
Key Words: AWS, CloudWatch, Auto Scaling, real-time monitoring, DevOps, cloud infrastructure, metric visualization, resource optimization, continuous monitoring, scalability, system reliability, cost efficiency, cloud-native applications
In today's dynamic and highly scalable software environments, real-time monitoring, proactive issue detection, and intelligent resource management are essential to ensure application availability, system reliability, and cost optimization. With the rapid adoption of cloud computing, particularly on Amazon Web Services (AWS),thereisanincreasingneedforautomatedsolutions thatcanmonitorsystemperformanceandadjustresources withoutmanualintervention.
Amazon Web Services (AWS) offers a rich set of services like CloudWatch for monitoring and observability, and Auto Scaling for dynamic resource management. AWS CloudWatch provides centralized logging, detailed metric visualization, and real-time alerting, enabling DevOps teams to gain deeper insights into system behavior, application health, and infrastructure performance. When combined with Auto Scaling, CloudWatch facilitates a selfadjusting cloud environment that can automatically increase or decrease resources based on user-defined thresholds,trafficpatterns,orapplicationload.
This paper discusses the design and implementation of a robust monitoring solution that integrates AWS CloudWatch dashboards with Auto Scaling capabilities, covering:
• Designing customized CloudWatch dashboards for realtimemetricvisualization
• Setting up alarms, thresholds, and anomaly detection mechanisms
• Integrating CloudWatch with Auto Scaling groups for automaticscalingactions
• Improving resource utilization, operational agility, and costmanagementthroughintelligentautomation
By creating centralized, actionable dashboards and coupling them with automated scaling strategies, organizations can significantly enhance the resilience, efficiency, and performance of their cloud applications. The integration of monitoring and automation aligns with modern DevOps principles, ensuring continuous

International Research Journal of Engineering and Technology (IRJET) e-ISSN:2395-0056 Volume: 12 Issue: 07 | Jul 2025 www.irjet.net p-ISSN:2395-0072
improvement, faster incident response, minimized downtime,andoptimizedinfrastructurecosts.
This study highlights how leveraging AWS CloudWatch andAutoScalingnotonlymeetscurrentoperationalneeds but also prepares businesses for future demands in a rapidlyevolvingcloudecosystem.
Patel et al. (2023) investigatedtheinfluence of real-time monitoring and automated visualization on cloud infrastructure management, highlighting that platforms like AWS CloudWatch significantly enhance system reliability, operational efficiency, and response time to incidents (Springer). Their findings demonstrated that organizations utilizing CloudWatch dashboards achieved faster detection of anomalies, improved fault tolerance, and proactive system management, leading to an overall increaseinserviceavailability.
Sharma and Gupta (2024) proposed an integrated cloud architecture combining AWS CloudWatch with Auto Scaling policies to automate cloud resource provisioning (ResearchGate).Theirstudyrevealedthatdynamicscaling based on monitored metrics such as CPU utilization and networkthroughputresultedinoptimizedresourceusage, reduced manual overhead, and considerable cost savings. They emphasized that such automation is crucial for maintainingperformanceduringunexpectedtrafficsurges and minimizing infrastructure wastage during lowdemandperiods.
Kim et al. (2023) conducted a comprehensive survey on modern cloud-native monitoring practices, exploring the use of real-time dashboards, anomaly detection, and predictive alerting systems in DevOps pipelines (IRJMETS). Their research stressed the importance of metric-driven infrastructure management, noting that detailed visualizations and real-time alerts drastically reduce Mean Time To Recovery (MTTR) and support continuousimprovementincloudservicemanagement.
Bollineni (2023) studied optimization strategies for enhancing the performance of cloud systems by integrating monitoring and auto-scaling features (IJSR). His research detailed how linking AWS CloudWatch metrics with Auto Scaling triggers improved resource allocation efficiency and enhanced application performance. The study also discussed how techniques likepredictivescaling,alarmtuning,andscheduledscaling couldfurtheroptimizecloudoperations.
Wang and Liu (2024) explored advanced approaches for intelligent anomaly detection within AWS monitoring frameworks (IJNRD). Their work introduced machine learning-driven techniques into CloudWatch alarm
© 2025, IRJET | Impact Factor value: 8.315 |
systems to predict potential resource exhaustion or performance bottlenecks before they impacted end-users. TheyconcludedthatintegratingAImodelswithtraditional monitoring systems could significantly improve decisionmakingaccuracyfor auto-scalingpolicies and reduce false alarmratesinproductionenvironments.
Kumar et al. (2024) examinedtheroleofautomationand visualization in accelerating DevOps workflows, underliningthatseamlessintegrationbetweenmonitoring services like CloudWatch and automation tools like Auto ScalingandLambdafunctionsleadstohighlyefficient,selfhealing cloud architectures (Elsevier). Their study showcased real-world case studies where businesses achievedup to40%costoptimizationanda 30%increase insystemuptimeafteradoptingintegratedmonitoringand scalingsolutions.
Metric visualization using AWS CloudWatch involves a structured monitoring workflow that automates the processofcollecting,analyzing,anddisplayingsystemand application metrics in real time. At its core, the methodology begins with the deployment of AWS resources such as EC2 instances, RDS databases, and load balancers. These resources automatically publish performance and operational metrics to Amazon CloudWatch.
Metric Visualization of CloudWatch using Auto Scaling ensuresthatsystembehaviourisautomaticallymonitored, critical thresholds are identified, and resources are dynamicallyadjustedwithminimalhumanintervention.
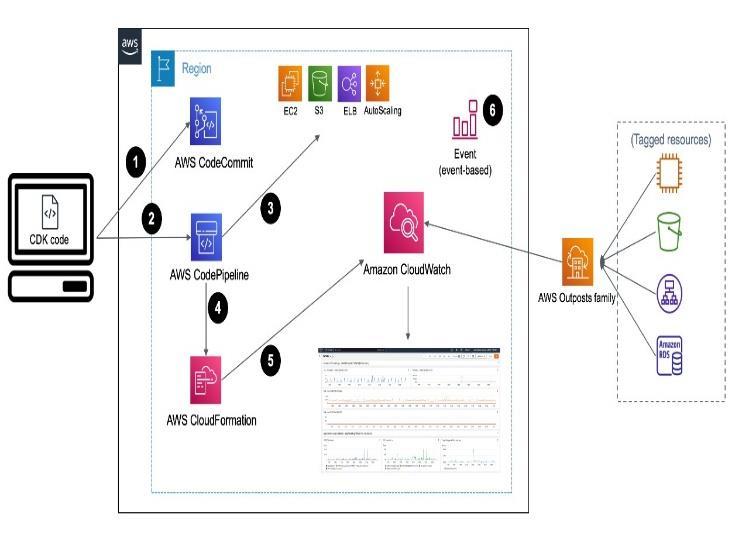
The Fig-1 illustrates the architecture for CloudWatch visualization integrated with Auto Scaling. It begins with AWS services like EC2, S3, and RDS emitting performance metrics to CloudWatch. These metrics include CPU

International Research Journal of Engineering and Technology (IRJET) e-ISSN:2395-0056
Volume: 12 Issue: 07 | Jul 2025 www.irjet.net p-ISSN:2395-0072
utilization, disk I/O, network traffic, and application logs. Custommetricsarealsoconfiguredwherenecessaryusing CloudWatchAgentandAWSSDKs.
Once metrics are available, custom CloudWatch DashboardsarecreatedtovisualizeimportantKPIsacross resources. Alarms are configured based on metric thresholds to automatically notify or trigger actions. In case of specific threshold breaches (e.g., CPU usage > 80%), CloudWatch alarms automatically initiate Auto Scaling policies to add or remove EC2 instances, ensuring optimalresourceutilizationandcostmanagement.
Additionally, CloudWatch Logs are collected and analysed to gain deeper insights into application behaviour and system health. The integration of monitoring, alarming, and Auto Scaling improves system resilience, operational visibility,andcustomerexperience,whilereducingmanual workload.
This methodology significantly enhances DevOps workflows by enabling proactive issue detection, faster recovery, and real-time operational awareness through AWS-native tools like CloudWatch, Auto Scaling Groups (ASG), SNS for notifications, and Lambda for automated remediation.
Jenkins, an open-source automation server, can be integrated with CloudWatch metrics to trigger builds, deployments, or other automated workflows based on infrastructureevents.Thisadvancedintegrationensuresa highly automated DevOps pipeline, improving agility and systemstability.
3.1 CloudWatch Monitoring and Auto Scaling Architecture
The architecture consists of several components that automatemonitoringandscaling:
1. Resource Metric Collection: AWS services such as EC2, RDS, and Application Load Balancers publishreal-timemetricstoCloudWatch.
2. Custom Metrics and Logs: CloudWatch Agent andAWS SDKs collectcustomapplication-specific metricsandlogsfordeeperanalysis.
3. Dashboard Visualization: CloudWatch Dashboards are configured with critical KPIs to provideacentralizedviewofsystemperformance.
4. Alarm Configuration: Thresholds are set for key metrics (e.g., CPU utilization, memory usage). BreachestriggerCloudWatchalarms.
5. Auto Scaling Integration:AlarmsaretiedtoAuto Scaling Groups, dynamically adding or removing instancesbasedonloadconditions.
6. Notifications and Automation: AWS SNS sends real-time alerts to teams, and Lambda functions canbetriggeredforautomatedresponses.
7. Monitoring and Feedback:Real-timedashboards and historical metric trends help teams proactively detect issues and optimize resource usage.
3.2 Auto Scaling Architecture with CloudWatch Alarms and SNS Notifications
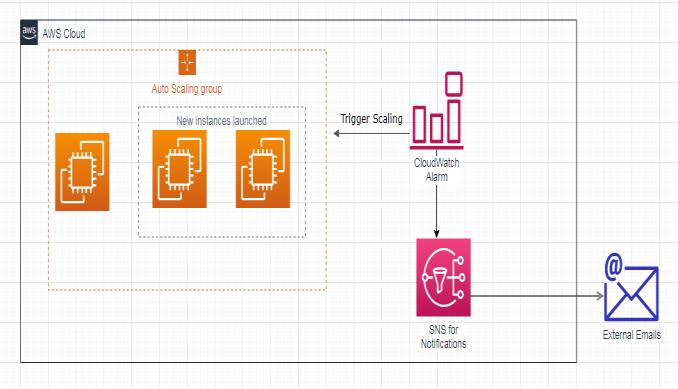
Fig2:AutoScalingArchitecturewithCloudWatchAlarms andSNSNotifications
The CloudWatch-based Auto Scaling architecture consists of a structured flow where system performance is continuously monitored and scaling actions are automatically triggered to maintain optimal resource utilization.
As shown in Fig 2, the architecture begins with an Auto Scaling Group that manages a fleet of EC2 instances running inside the AWS Cloud environment. These instances automatically emit performance metrics such as CPU utilization, network I/O, and memory usage to AmazonCloudWatch.
When the resource utilization crosses a predefined threshold (for example, CPU utilization exceeding 80%), a CloudWatch Alarm is triggered. The alarm initiates two simultaneousactions:
1. Trigger Scaling Action:
CloudWatch communicates with the Auto Scaling Group to launch new EC2 instances, thereby

International Research Journal of Engineering and Technology (IRJET) e-ISSN:2395-0056 Volume: 12 Issue: 07 | Jul 2025 www.irjet.net p-ISSN:2395-0072
dynamicallyadjustingcapacitybasedonreal-time loadconditions.
2. SNS Notification:
The CloudWatch Alarm also sends a message to Amazon SNS (Simple Notification Service), which distributes notifications to subscribed endpoints. Inthiscase,notificationsaredeliveredtoexternal email addresses, alerting stakeholders about scalingeventsorsystemanomalies.
The dynamic scaling ensures that the system remains highly available and responsive to varying workloads without manual intervention. Meanwhile, real-time notifications provide transparency and faster incident response, significantly enhancing operational efficiency andresilience.
This integrated solution improves system reliability, minimizes costs by scaling resources up or down as needed, and empowers DevOps teams with immediate awarenessofcriticalinfrastructureevents.
3.3 CloudWatch Dashboard Setup and Configuration
CloudWatch provides flexible options for defining dashboards:
Dashboards are created through the AWS ManagementConsoleorbyusingAWSCLI/SDKs.
Multiple widgets (e.g., line graphs, number widgets, text annotations) are added to track systemhealthandperformancemetrics.
Dashboards are organized at the application and infrastructure level to monitor system health holistically.
Regular reviews and updates ensure dashboards reflect evolving infrastructure and application needs
3.4 Integration with AWS
CloudWatch integrates seamlessly with various AWS servicesandDevOpstools:
Auto Scaling: Ensures dynamic resource managementbasedonreal-timedemand.
AWS SNS:SendsalarmsandnotificationstoSlack, email,SMS.
AWS Lambda: Automates custom workflows and remediationbasedonmetrictriggers.
Jenkins: Trigger build pipelines or deployments basedoninfrastructureevents.
S3:Storeslogsandmetricsnapshotsforhistorical analysis.
IAM: Manages permissions for metric access and dashboardvisibility.
3.4 CI/CD Monitoring Workflow with CloudWatch
Step 1: Metric Collection
Resources (EC2, RDS, etc.) automatically publish metrics.
CloudWatch Agent collects custom metrics where needed.
Step 2: Dashboard Configuration
Create dashboards to visualize CPU, memory, networkI/O,diskoperations,errorrates.
Step 3: Alarm and Threshold Setup
Setalarmsforcriticalmetrics(e.g.,CPU>80%).
Step 4: Auto Scaling Trigger
Alarm breaches trigger Auto Scaling policies to addorremoveinstances.
Step 5: Real-Time Monitoring
Use dashboards to monitor live system performance.
Step 6: Notification and Response
AlarmssendnotificationsthroughSNS.
Lambdafunctionsormanualinterventionsresolve issues.
Step 7: Continuous Improvement
Analyze trends and optimize scaling policies and dashboardKPIsovertime.
4. Results
AWS CloudWatch Alarms were effectively configured to monitor critical performance metrics such as CPU utilization, network throughput, and application errors. When threshold breaches occurred, CloudWatch Alarms triggered automatic scaling actions through the Auto Scaling Group, ensuring high availability and optimal

International Research Journal of Engineering and Technology (IRJET) e-ISSN:2395-0056
Volume: 12 Issue: 07 | Jul 2025 www.irjet.net p-ISSN:2395-0072
resource usage. Simultaneously, notifications were sent through Amazon SNS (Simple Notification Service) to subscribed email addresses, enabling real-time awareness andimmediateresponsetoscalingevents.
ThecustomCloudWatchDashboardprovidedacentralized andintuitivevisualizationofsystemhealth,displayingkey metrics like average CPU utilization, number of running instances,andalarmstates. Thisvisualizationempowered the operations team to detect performance anomalies early, track resource scaling patterns, and make datadrivendecisions.
By integrating CloudWatch monitoring with Auto Scaling and SNS notifications, the system achieved dynamic elasticity, rapid issue detection, and minimal manual intervention. This proactive approach improved operational efficiency, optimized cloud costs, and enhanced application availability, leading to a more resilientandscalableinfrastructure.
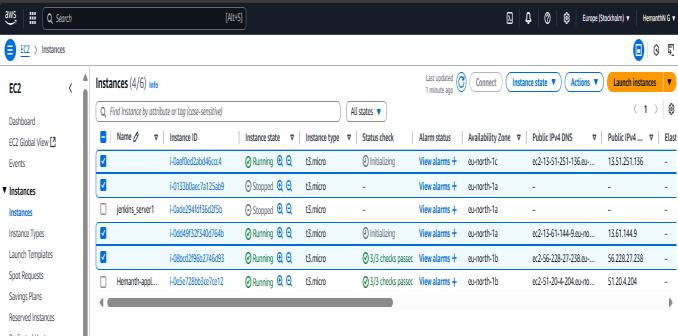
Fig3:AutoScalingisdoneAsStressincreasesInstance alsoincreases
This Figure 7.7 displays the EC2 Instances dashboard in the AWS Management Console after the Auto Scaling Grouprespondedtothestresstest.Asseen,therearenow six instances in total, out of which four are currently running (Running state) and two are Stopped. This is a clear result of the Auto Scaling policy that got triggered after applying the stress command to one of the existing instances
The instances in the "Running" state include newly launched instances (with status checks either initializing or passed), which were automatically provisioned by the Auto Scaling Group named "Hemanth", as shown earlier. This group scaled out from one to three instances in responsetohighCPUusage,demonstratinghowAWSAuto Scaling can dynamically respond to workload increases. The additional instances help distribute the load, maintaining application performance and availability The availabilityzoneslisted(suchaseu-north-1a,eu-north-1b, and eu-north-1c) indicate that the Auto Scaling Group has also ensured zone redundancy, improving fault tolerance. The public IPv4 addresses and DNS values confirm that
© 2025, IRJET | Impact Factor value: 8.315 |
these instances are accessible over the internet, which is helpful for managing or monitoring them during testing. Overall, this dashboard confirms that the system automatically reacted to the stress command by provisioningmoreresources,validatingthescalabilityand responsivenessofthedeploymentenvironment
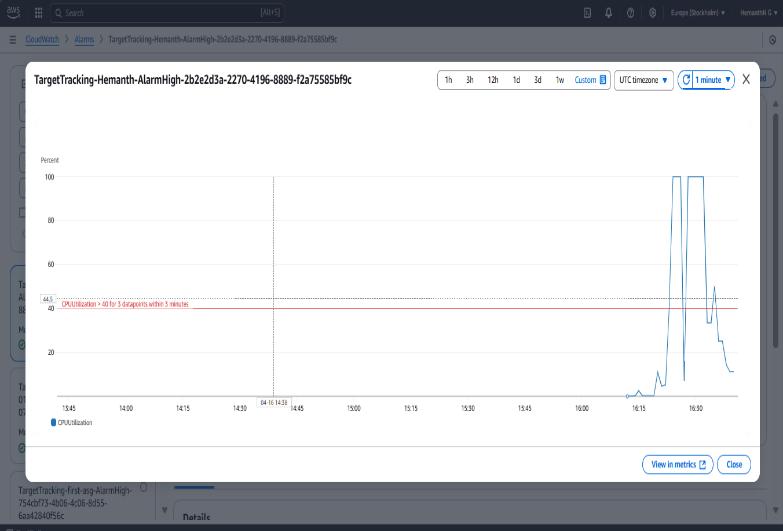
Fig4:TargetTracking_CPUAlarm_Graphincloudwatch
The Fig 4 : is the Amazon CloudWatch console displaying the performance of a CPU utilization alarm named TargetTracking-Hemanth-AlarmHigh. This alarm is part of a target tracking scaling policy associated with an Auto Scaling Group. The graph monitors the CPUUtilization metric,showninblue,withathresholdsetat40%,marked by a red horizontal line. According to the alarm configuration,ittriggersiftheCPUutilizationexceeds40% for three consecutive datapoints within three minutes. From the graph, there is a clear spike in CPU usage between 16:15 and 16:30 UTC, during which the metric surpasses the threshold, potentially activating the scaling policytomanagetheincreasedload.Thismechanismhelps in maintaining application performance by dynamically adjustingcomputecapacitybasedonreal-timeusage
The project aimed to enhance the visibility, performance, and scalability of cloud-based applications by building a robust metric visualization system using Amazon CloudWatch in conjunction with EC2 Auto Scaling. Through the development and deployment of custom dashboards, real-time alarms, and scaling policies, the projectaddressedoneofthemostcriticalneedsofmodern DevOps workflows centralized and intelligent infrastructure monitoring. The system was able to accurately detect performance thresholds being crossed (such as CPU spikes), and respond in real time by triggering automatic scaling actions, ensuring uninterrupted application availability and optimal resource utilization. Moreover, the internship provided

International Research Journal of Engineering and Technology (IRJET) e-ISSN:2395-0056
Volume: 12 Issue: 07 | Jul 2025 www.irjet.net p-ISSN:2395-0072
practical insights into the complexities of cloud resource management. Tasks such as setting up EC2 instances, configuring alarms, writing auto scaling rules, and testing system resilience through stress tools, highlighted the depth of AWS’s capabilities and the importance of cloud observability. The visual feedback obtained from CloudWatch dashboards proved invaluable, allowing stakeholders to interpret system behavior and make informed decisions. This project not only deepened the understanding of how AWS integrates DevOps practices such as Continuous Monitoring, Infrastructure as Code (IaC), and automated response, but also reflected realworldscenarioswhere applicationsmust be both scalable andresilienttochangingworkloads.Overall,thisendeavor has significantly contributed to both theoretical and practical knowledge in cloud computing and DevOps, showcasingastrongfoundationforfurtherinnovationand implementationinlarge-scalecloudenvironments.
[1]"TheRoleofReal-TimeMonitoringToolsinEnhancing Cloud Infrastructure Management", Authors: Patel et al., Springer,2023.
[2] "Integrated Cloud Architecture with AWS CloudWatch and Auto Scaling for Dynamic Resource Management", Authors:SharmaandGupta,ResearchGate,2024.
[3] "A Survey on Cloud-Native Monitoring Practices and Real-Time Metric Visualization", Authors: Kunwoo Kim et al.,IRJMETS,2023
[4] "Optimization Strategies for Monitoring and Scaling CloudSystems",Author:SatyadeepakBollineni,IJSR,2023.
[5] "Advanced Anomaly Detection Techniques in AWS Monitoring Frameworks", Authors: Wang and Liu, IJNRD, 2024.
[6] "Automation and Visualization Integration for CloudNative DevOps Acceleration", Authors: Kumar et al., Elsevier,2024.