International Research Journal of Engineering and Technology (IRJET) e-ISSN:2395-0056

Volume: 09 Issue: 12 | Dec 2022 www.irjet.net p-ISSN:2395-0072
International Research Journal of Engineering and Technology (IRJET) e-ISSN:2395-0056
Volume: 09 Issue: 12 | Dec 2022 www.irjet.net p-ISSN:2395-0072
***
Abstract - The prime objective of this research is to develop an accurate and simplified model to forecast municipal solid waste generation. Because if the municipality can predict Municipal Solid Waste (MSW), then necessary steps can be taken to process it, and better waste management can be done. Further, a drastic increase in the waste can cause mismanagement and severe health complications. Various machine learning methods are available for predicting dependent variables from a single or bunch of independent variables. In many cases (like nonlinear dependence), pre-processing of the available data has to be performed to increase the accuracy and reliability of the linear model. This is also the case with the prediction of solid waste generation.
In this work, the multiple linear regression method is used as it tends to lower overfitting and gives a good level of generalization. Pandas data frame is used to store and perform different operations on data. Also, different linearity checks like multi-collinearity, homoscedasticity, and homogeneity are performed for the suitability of the linear model. The present work considers solid waste generation in different municipalities of Italy. Different errors like MAE, MSA & RMSE are calculated for predicting MSW and the necessary steps that are required. Further accuracy of the model is calculated for the reliability of the results. Such work can be helpful for any municipal body around the world for better waste management through the prediction of solid waste generation.
Key Words: Linear Regression, Solid waste generation, PopulationManaging and disposing of waste is one of the most significant environmental challenges of the 21st century for any municipal body. To create a waste disposal plan, the primary input that one must have beforehand is the amount of waste to be disposed of. Waste can be broadly classified as solid, liquid, organic waste, and recyclable rubbish like food and beverage containers, dry newspapers, etc. [1]. Out of these four major types of waste, this study is focused on the amount of solid waste generated.
There can be multiple sources of solid waste in a municipal region, and hence different factors must be consideredwhilepredictingtheoverallamountproduced. Solid waste management in a municipal region involves highcostsandeffortsfrom thegovernment. Furthermore, proper waste disposal is the prime requirement to keep the environment clean and people healthy. Hence, this research aims to predict municipal solid waste (MSW) generation. Various studies in literature, like NavarroEsbrı'etal.[2],suggestthatMSWgenerationisadynamic processanddependsonmultiplefactors.So,topredictthe same,atimeseriesmodelisusedforprediction.
Further time series modeling is used along with fuzzy logic, which is an application of an adaptive neuro-fuzzy interfacesystem(ANFIS).ANFISmodelisanimprovement over the traditional autoregressive moving average (ARMA) model. Beigl et al. [3] developed a procedural guideline for crucial design options with impact significance and cost efficiency of the waste generation model.
Analgorithmlikethetreewasdevelopedformethodology selection where inputs like total MSW, collection stream, and material stream give different method output as regression method or time series analysis, or group comparison and regression. Their work aims at providing only one methodology for selecting the best-suited method for solid waste prediction. Pires J. [4] aimed at selecting statistically valid parameters using multiple linear regression and principal component analysis. From independentvariablesliketemperature,relativehumidity, wind speed, wind direction, and solar radiation, the dependentvariable(concentrationoftroposphericozone) was derived. Estay-Ossandon, C [5] used the fuzzy Technique for Order Preference by Similarity to Ideal Solution(TOPSIS)forsolidwasteforecastingoftheCanary archipelago.TheauthorsusedDelphitechniquetocapture experts' knowledge, and subsequently, TOPSIS was applied.Themodeldevelopedfromthis methodwasused toforecastMSWgenerationfor2015-2030.
From the literature, it is deduced that using a non-linear forecasting model (like the one developed by EstayOssandon)notonlyincreasesthecomplexityofthemodel butalsomakesitchallengingtogatherrawdataaccording to the requirement of different models. Also, a slight
International Research Journal of Engineering and Technology (IRJET)
e-ISSN:2395-0056
Volume: 09 Issue: 12 | Dec 2022 www.irjet.net p-ISSN:2395-0072
change in the underlying data structure makes it difficult to modify the existing model. The model developed by Esbrı' et al. [2] explains the dependent variable more practically, but the research was explicitly aimed at forecastingriverflow.
Hence, this work focuses on developing a simple yet powerful model that is more generalized and can be used for any municipal body with minimal modifications. Data used for the present research was collected by "Centro StudiDipartimentaleinEconomiaeRegolazionediServizi, dell'Industria e del Settore Pubblico (CESISP)" [6] researchcenteroftheDepartmentofBusinessandLawof the University of Milano-Bicocca, Italy. The popular research in this domain utilizes highly complex models likeTOPSIS,ANN(ArtificialNeuralNetwork),LSTM(Long Short-term Memory), and fuzzy logic. These models are found to be overfitted and need more generalization. So, the present study aims at a multiple linear regression model, which primarily avoids overfitting, and therefore, modeling of the same is quick and reliable. Different linearity checks are explained and performed along with outlierdetectionusingaboxplot.Non-lineardependencies areconvertedtolinearmodelsbyusingalogarithm.Multivariable linear regression modeling is done using sklearn module of python, and finally, different errors are calculatedforcomparisonwithothermethods.
Inordertopredictdependentvariablesfromindependent variables, there are multiple machine learning methods available, like linear regression, decision trees, and random forest. Amongst these methods, linear regression is chosen in this work to give better generalization and simplification of the model. Multiple linear regression (MLR) can be the best model for this domain because multiplefactorsaffectthequantityoffinalwaste[7].Itcan bemodeledasbelow,
Here, y is the dependent variable, which depends on the independent variables While areregressionco-efficient,whicharetobecalculated.Eis an error or noise which cannot be derived or considered inthecalculationasitispurelyonachancebasis.
While selecting a linear model, the following assumptions needtobemade.
Linearity: It states that there exists a linear relationshipbetweendependentandindependent
variables. In this research, exploratory data analysis (EDA) is performed and it is found that municipal waste is linearly dependent or the logarithm of the dependent variable is linearly dependent on independent variables, hence this assumptionholdstrue.
Multi-collinearity: there should not be any relationshipbetweenindependentvariablesitself. It is checked by plotting pair plots between independentvariables.
Homoscedasticity: the error term must showcase constant variance. During the EDA process, a residual plot can be plotted to check thisassumption.
Exogeneity: Itstatesthattheerrortermmustnot be a function of independent variables ( ), this also can be confirmed by the residual plot, which shows no relation between theerrortermanddifferentfeatures.
Process followed for regression model from data collectiontomodelevaluation,isasbelow,
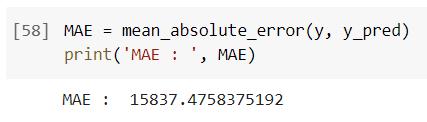
Mean Absolute Error (MAE): It is the absolute submission of the difference between the predicted value and actual value divided by the total number of observations. It is the predicted value, and n is the total number of observations then formula for the same is as below. It uses same weight for both small and significanterrors.

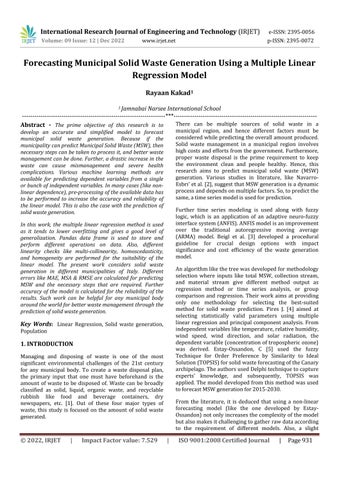
Mean Squared Error (MSE): Itis thesubmission of the squared difference between the predicted value and actual value divided by the total number of observations. It gives high importance to larger values due to the square term. If is the predicted value, and n is the total number of observations;theformulaforthesameisbelow.It putsahighweightonhighererrors.
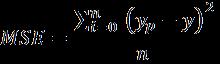
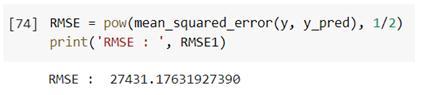
Root Mean Squared Error (RMSE): It gives high importancetolargervalueduetothesquareterm.
International Research Journal of Engineering and Technology (IRJET) e-ISSN:2395-0056
Volume: 09 Issue: 12 | Dec 2022 www.irjet.net p-ISSN:2395-0072
If is the predicted value, and n is the total number of observations, then, a formula for the same is as below. It puts higher weight on more significant errors and gives errors in the same unitastheoriginal.Itsmathematicalexpressionis givenbelow:

Fromthesedependentvariables,theindependentvariable of municipal solid waste has to be predicted as the dependent variable might be linearly or non-linearly dependent on independent variables [8]. The explanation andunitsforeachvariablearementionedintable1.
Table 1:Datasetcolumnsexplanation
Variable Unit Type Explanation
Population Inhabitants Independent
All three performance matrices will be used to evaluate themodel'sperformance[9].Theabsoluteaccuracyofthe modelcanbederivedbytheRsquaredvalue,whichgives accuracyinpercentageterms.Theformulaforthesameis asbelow,
R-Squared (R2): It is the proportion of the variation in the dependent variable that is predictable from the independent variable. It is alsocalledtheaccuracyofthemodel.IfRSSisthe sum of squares of residuals and TSS is the total sumofsquares,thenR2canbewrittenasbelow,
The data collection method depends on factors like the type, scale, and the area of study. It is generally obtained from information registered by different government agenciesormunicipalities.
The data used here is based on a study conducted by the Department of Business and Law of the University of Milano-Bicocca [6] for different cities of Italy. Out of the different columns available in the dataset, the variance inflation factor(VIF) is calculated for all columns, andthe chosen columns with a high VIF (higher than 10) are mentionedbelow.
Total number of populations in consideredcityorvillage
Population Density Inhabitants/ km2 Independent Densityofinhabitants
Average Education Discrete value Independent
In house Service Discrete value Independent
Per Capita Income PPPdollars Independent
Municipal SolidWaste Kg Dependent
Average education level on scaleof 0to4,where 4 indicated highest education like Masters or Ph.D. and 0 indicates noeducation
Whether any in house service provided or not. Itis0or1.
Per capita income of consideredcityorvillage inPPPdollars
Actual municipal solid wasteinkg
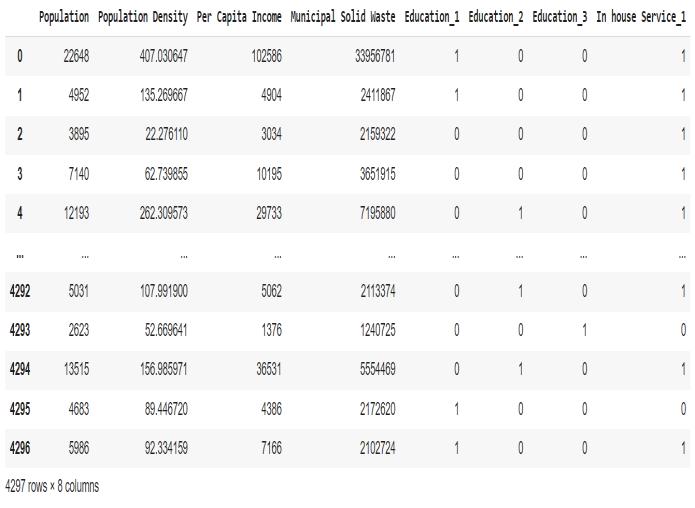
Theavailabledataisimportedusingpandasdataframefor the subsequent process. A sample of the same is shown below:
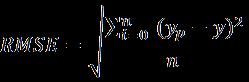
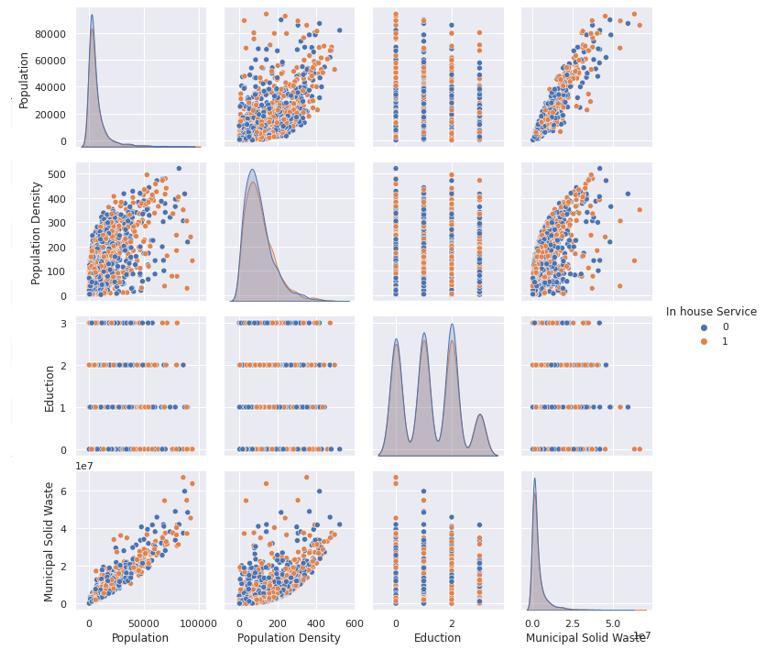
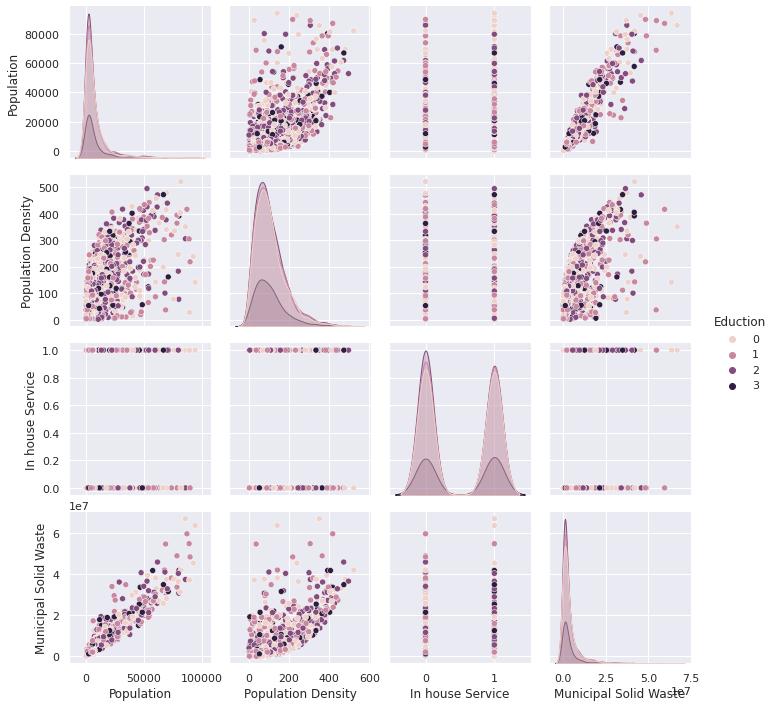
Figure 1:Pairplotofdependentvariablescategorizedby inhouseservice
International Research Journal of Engineering and Technology (IRJET)
e-ISSN:2395-0056
Volume: 09 Issue: 12 | Dec 2022 www.irjet.net p-ISSN:2395-0072
It can be seen from Figure 1 that MSW is linearly dependentonpopulation.Thoughithassomeoutliers,itis a safe assumption that it is linearly dependent [10]. In contrast,therelationshipofMSWwithpopulationdensity is not linear. Hence logarithm of population density is taken.
As education and in-house service are categorical variables, they have to be converted to a dummy variable to prepare data for linear regression. For this purpose, pd.det_dummiesfunctionisused.Asdummiesarecreated, a single education column is converted to Education_0, Education_1,…,Education_5.Ifallothercolumnshavezero values, the first column will have an actual or one value. Hence it introduces multi-collinearity in itself. To avoid this,drop_firstargumentinpd.get_dummiesissetasTrue. It will drop the first column, so the assumption of no multi-collinearityholdstrue.
Thesamepairplotis alsovisualizedtofindarelationship with the average education of the inhabitant as shown in fig. 2. Education of people also plays a vital role in MSW. Hence the same pair plot is also categorized by average education of region to gain insight for same. It was observed from fig 2 that the relationship between MSW and average education of the inhabitants was comparativelyweek.
Primary exploratory data analysis is performed on the variables, andtheboxplotforthesameisshowninfig. 3. From the box plot, it can be observed that outliers are there in some of the population and per capita income. From the exact figure, it can be seen that the population has a large no of outliers. However, from the data, it is verifiedthatsomecitieshavealargepopulationcompared to others; hence, this is not an anomaly but represents actual data. The same is valid for per capita income, as some cities have higher per capita income than others. Therefore, for this study, no data is dropped, considering that the outliers also pass accurate information. Populationdensitywasnotfoundtohaveanyoutliers.
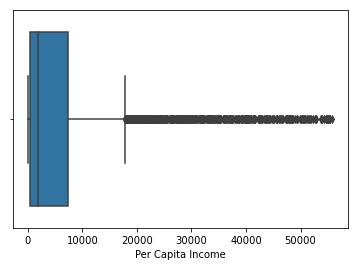
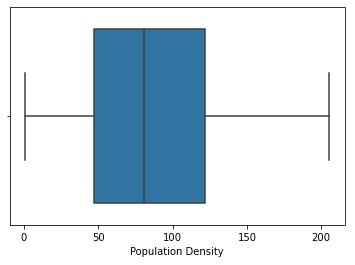
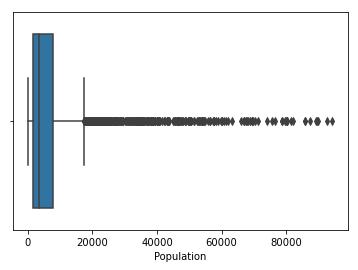
Figure 3:Boxplotforcontinuousvariables
International Research Journal of Engineering and Technology (IRJET) e-ISSN:2395-0056
Volume: 09 Issue: 12 | Dec 2022 www.irjet.net p-ISSN:2395-0072
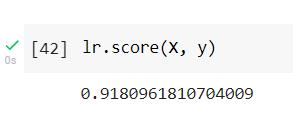
The score or R-squared value of the linear regression model is found for the authenticity and accuracy of the model. It is found as 0.918096, which is 91.81%. So, it is proventhatthedeveloped modelis reliableforpredicting municipalwasteformunicipalities.
As explained earlier, municipal solid waste is the dependent variable (y), and all other columns are independentvariables.
Inordertofitthisintoalinearmodel,Sci-kitlearnslibrary ofpythonisused.Thecodeusedforthesameisshownas follows,
There are different evaluation matrices like MAE, MSE, and RMSE as explained in section 3.1. The present study considers three types of errors for evaluation and inferences.
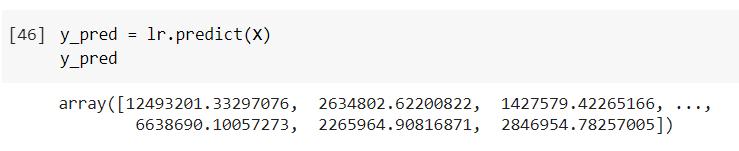
From the developed model (lr), prediction can be found with the use of lr.predict() for known and unknown municipalsolidwaste,asshownbelow,
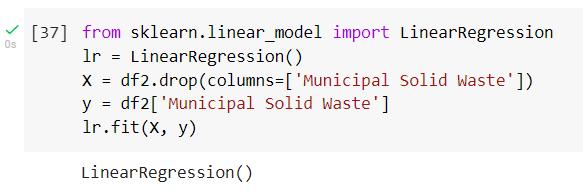
As per the above image, a linear regression model is first imported. Then linear regression object is created for performing the regression task. As mentioned, the model isfittedwiththeindependentanddependentvariables.
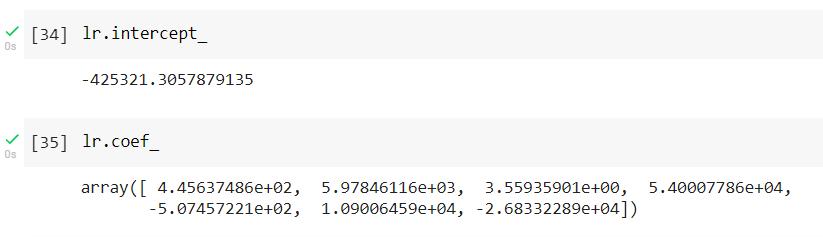
Co-efficient and intercept of the model are found and shownbelow,
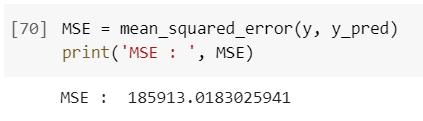
Here, the output array shows municipal solid waste generated in kgs considering different independent variables passed to it. Different errors for the calculated modelareshownbelow:
International Research Journal of Engineering and Technology (IRJET)
e-ISSN:2395-0056
Volume: 09 Issue: 12 | Dec 2022 www.irjet.net p-ISSN:2395-0072
From the above errors, inferences can be made by considering MAE as 15,837. Using this method, it can be concluded that the absolute error in predicting municipality waste correctly is 15,837 kgs. So, while considering this method, it is advisable to consider this errorwhilepredictingMSW.
In the present research, multiple linear regression was used to develop a model to predict municipality solid waste for the municipalities of Italy. Different social and economic factors like population density, education, inhouse service, and per capita income are considered. Out ofalltheseparameters,thepopulationfactorwasthemost impactful factor for waste generation. Other parameters alsoaffectthedependentvariable, buthaverelativelyless influenceonthefinalresults.Differentlinearitytestswere also performed to check the model for linearity, multicollinearity,homoscedasticity,andexogeneity.
Further, the model was developed to predict Municipal Solid Waste generated, given that users have a value of other independent variables. Different errors like MAE, MSA, and RMSE were also calculated to understand the data. Itis advised tousethis model forthevalue of range independent variable within the considered range. The present study uses limited data for the analysis due to its unavailability. The model is further improved by considering more data. Instead of using limited data, the modelgivesarelativelyhighaccuracyof91.81%.
1. Edjabou,M.E.,Jensen,M.B.,Götze,R.,Pivnenko,K., Petersen, C., Scheutz, C. and Astrup, T.F., 2015. Municipal solid waste composition: Sampling methodology, statistical analyses, and case study evaluation.WasteManagement,36,pp.12-23.
2. Nayak, P.C., Sudheer, K.P., Rangan, D.M. and Ramasastri, K.S., 2004. A neuro-fuzzy computing technique for modeling hydrological time series. JournalofHydrology,291(1-2),pp.52-66.
3. Beigl, P., Lebersorger, S. and Salhofer, S., 2008. Modelling municipal solid waste generation: A review.Wastemanagement,28(1),pp.200-214.
4. Pires, J.C.M., Martins, F.G., Sousa, S.I.V., AlvimFerraz,M.C.andPereira,M.C.,2008.Selectionand validation of parameters in multiple linear and principal component regressions. Environmental Modelling&Software,23(1),pp.50-55.
5. Izquierdo-Horna, L., Kahhat, R. and VázquezRowe, I., 2022. Reviewing the influence of
sociocultural, environmental and economic variablestoforecastmunicipalsolidwaste(MSW) generation. Sustainable Production and Consumption.
6. Dataset: Di Foggia, Giacomo (2022), “Municipal waste management cost and fee schemes”, MendeleyData,V1,doi:10.17632/w5f9kg7743.1
7. Pany, P.K. and Ghoshal, S.P., 2015. Dynamic electricity price forecasting using local linear wavelet neural network. Neural Computing and Applications,26(8),pp.2039-2047.
8. Estay-Ossandon,C.,Mena-Nieto,A.andHarsch,N., 2018. Using a fuzzy TOPSIS-based scenario analysis to improve municipal solid waste planning and forecasting: a case study of Canary archipelago (1999–2030). Journal of cleaner production,176,pp.1198-1212..
9. DeBaets,S.andHarvey,N.,2020.Usingjudgment to select and adjust forecasts from statistical models. European Journal of Operational Research,284(3),pp.882-895.
10. Azadi,S.andKarimi-Jashni,A.,2016.Verifyingthe performance of artificial neural network and multiple linear regression in predicting the mean seasonalmunicipalsolidwastegenerationrate:A case study of Fars province, Iran. Waste management,48,pp.14-23.
11. Ayeleru, O.O., Okonta, F.N. and Ntuli, F., 2018. Municipal solid waste generation and characterization in the City of Johannesburg: A pathway for the implementation of zero waste. WasteManagement,79,pp.87-97.