International Research Journal of Engineering and Technology (IRJET) e ISSN: 2395 0056 Volume: 08 Issue: 12 | Dec 2021 www.irjet.net p ISSN: 2395 0072 © 2021, IRJET | Impact Factor value: 7.529 | ISO 9001:2008 Certified Journal | Page1599 LANE MISBEHAVIOR DETECTION USING MULTI-LAYER PERCEPTRON WITH THE AID OF BACK PROPAGATION ALGORITHM Mr.SIVAKUMAR.T1, Dr.L. MANJUNATHA RAO2 1Research Scholar MCA Program, Dr.Ambedkar Institute of Technology, Bengaluru 2Professor, MCA Program, Dr.Ambedkar Institute of Technology, Bengaluru *** Abstract - With the proliferation of the Advanced Driver Assistance System, Lane line misbehavior detection is an essential procedure nowadays. In this letter, novel feature selection and classification approaches are incorporated. In most cases, a median filter is used to remove the image's noisy components submitted inanimage .Aftereliminatingthe noisy content in an image, binary whale optimization (BWOA) is introduced for selecting a relevant setoffeaturestomakeease the classification process. In this context, Multi layer preceptor based back propagation is introduced fordetecting misbehavior activities attained in the lane line image. The proposed system’s performance is evaluated based on accuracy and error function Key Words: Multi layer perceptron, Back Propagation, Lane line,Misbehaviourdetection,Whaleoptimization
1. INTRODUCTION
Several[13]. techniques existed for supervised machine learning algorithms and they are named as Naïve Bayes (NB), Linear regression (LR), Random Forest (RF), K nearest neighbor (KNN), Multilayer perceptron (MP), Support vector machine (SVM), etc. [14]. The performance of the machine learning techniques is developedinrecentdecadesstilltheperformance level is required to improve to achieve a high accuracy level in the process [15]. The enhancement of the machine learning techniques’ performance is executed by the hybridization method. Hybridization is the process of integrating two or more learning algorithms to minimize the drawbacks of each algorithm and increase the performance of the process. Therefore, lots of researchers are utilizing this hybridization method for their research works in recent days. This is motivating the present work to propose a novel hybrid learning method for detecting lane line misbehavior. The proposed technique is performed based on image processing for detecting the lane line misbehavior with high accuracy level.
The Advanced Driver Assistance System (ADAS) is playing a major role in driving and transportation in this digital environment which is automotive, flexible, and improved the experience of driving. In recent days, plenty of accidents are carried out due to the carelessness of the driver [1]. The ADAS is helping to minimize the workload of drivers and also ensures safety. When the hazardous circumstance occurs, the ADAS alert the driver or takes an effective role by functioning require corrective action to evade an accident [2]. Thissystem utilizes some technologies such as radar, computer vision methods, image sensors, and global positioning.Inthissystem, lane line detection is the most important factor to lead the vehicles towards the appropriate path [3]. Moreover, the lane line detection method is helpful to realize the current path condition and the driver can able to get ready forvariousroad trends in advance [4]. This method isperformedintermsofthe various lane line kind marks such as Broken white line, Continuous white line, Double continuous yellow line, Continuous yellow line, and shattered yellow line. Still, it requires rectifying some challenges and they are, blockages, interference, and defects of lane line mark [5]. Therefore, lots of researches are conductedtoovercomethesechallenges with the help of various traditional techniques. Here, machine learning techniques are playing a massive part to overcome these challenges [6, 7]. In recent decades, machine learning algorithms are widely utilized techniques for various applications like the medical field, automation, image processing, etc. Machine learning algorithms are performed based dataset which contains the information about the correspondent application [8, 9]. Moreover, this machine learning technique is categorizedinto four types and they are named unsupervised learning, Reinforcement learning, Supervised Learning, and Semi supervised learning [10]. Supervised machine learnings are utilizing characterized experience or information for performing which is mostly utilized for the applications of classification, Regression, and Forecasting [11]. Unsupervised machine learnings can identify the correlations and relationships with the help of investigating the input data. These techniques are mostly implemented for the clustering and dimension reduction process [12]. Semi supervised machine learnings are similar to supervised learning still this method utilizes both characterized and uncharacterized. Reinforcement machine learning methods are concentrating on organized information which provides the algorithmalong with a set of activities, parameters, and outputs. From these categories, the supervised machine learning algorithm is widely utilized due to its advantages in real world estimation
2. Literature review: Xinxin Du, et al [16] have offered a novel technique in terms of Robust vision to detect the lane line and vehicle localization.

The complete architecture of the proposed methodology is revealed in Fig.1. Based on mentioned procedure, the input image is recognized by two different classes namely misbehavior and normal activity. The proposed approach is applied in the Python programming platform which is investigated by statistical measurements such as precision,error,F measure,accuracy,and recalls. The detailed process of the proposed methodology is presented in the upcoming sections.
The data acquisition phase is done in the initial step by collecting input lane line images. Primarily, a median filter is applied to eliminate noisy contents present in an input image. While processing input images directly to the misbehavior prediction model, the proposed system lacks in attaining accurate outcomes. Henceforth noise reduction and quality enhancement steps are essential steps to be incorporated in computer vision applications. With the aid of a non linear noise destruction method named median filter, the original image gets improved. Following this procedure, edges get preserved and exact pixels of each imagefoundinthelane line image are obtained. By taking the median value of neighbor pixels, each pixel value tends to be replaced and is mathematically solved using the following equation,
Jingwei Cao, et al [18] have suggested the lane detection algorithm for autonomous vehicles to identify dynamic environments and complex road conditions. The presented technique utilized inverse perspective transformation and region of interest extraction to attain the aerial view of the lane. Thereafter, the third order B spline curve model based lane line fitting was performed with the help of a random sample consensus algorithm, and also the fitting validationandcurvatureradius estimation were conducted over thecurve.Theanalysisresults were proved that the suggested technique was detecting the lane effectively. Minho Lee, et al [19] have designed a novel deep learning based lane following techniqueforautonomous ground vehicles. The presented technique was utilized animproved convolutional neural network to compute the rightandleft lane lines’ 6 coefficients throughthe help of two quadratic functions. The whole process was performed based on the surround view of a vehicle image. The investigation results were showed that the presented technique was could able to drive the vehicle autonomously and steadily without any lane distraction.
3.1 Image quality enhancement using a median filter
The optimization technique modified the earthworm optimization algorithm (EWA) through the traits of the Crow Search Algorithm (CSA) which was called the Earth worm crow search algorithm (EW CSA). The experimental results were showed that the presentedtechniquewasperformedwell for the lane detection process with high accuracy.
3. Research Methodology: Lane line misbehavior detection is an essential process nowadays to discriminate the normal and misbehavior activities. Initially, input lane line images intersectedwiththe open source technology is used to collect automobiles. The collected images may have differentdistortionsso initially;the image enhancement procedure is incorporated. After that,for selecting a relevant set of features from the pre processed outcome, the binary whale optimization approach is introduced. Finally, to differentiate both the normal and misbehavior activity from lane line images, MLP based BP algorithm is presented.
The presented technique utilized the ridge detectortopool the lane line pixels. After that, the noises from the pixels were removed by implementing an efficient noise filtering mechanism. The capturing of each lane line that existed in the image was validated with the help of a modified sequential Random sample consensus. At last, the accuracy of the lane detection was enhanced by the parallelism reinforcement method. The experimental results were demonstratedthatthe presented technique wasperformedwell forlanelinedetection and vehicle localization.
International Research Journal of Engineering and Technology (IRJET) e ISSN: 2395 0056 Volume: 08 Issue: 12 | Dec 2021 www.irjet.net p ISSN: 2395 0072 © 2021, IRJET | Impact Factor value: 7.529 | ISO 9001:2008 Certified Journal | Page1600
Qin Zou, et al [20] have combined recurrent neural network (RNN) and convolutional neural network (CNN) for the lane prediction process. In the presented technique, the CNN was applied for gathering the data of each frame and holding the time series properties. Thereafter, the feature learning and lane prediction was performed by implementing RNN. The experimental results were showed that the implemented technique effectively detected the lane and also managed complex situations. WEI JONG YANG, et al [21] haveemployed deep learning techniques to attain robust lane detection. The presented technique was advanced from the Lane Net model which was performed based on semantic segmentation concepts with the help of the encoder’s multilevel features. Moreover, it was improved the binary segmentation and minimized the embedding branches of the pixel.Theoutcomes were proved that the suggested lane detection network was performed well for lane detection with better accuracy. JunLi, et al [22] have also executed two kinds of neural networks like multi task recurrent neural network(RNN)andconvolutional neural network (CNN) for lane detection in traffic scenes. In the presented technique, the information in the traffic scenes was gathered by implementing multi task CNN and the lane boundaries were automatically detected by utilizing RNN. Suvarna Shirke, et al [23] have presented a Deep CNN for discovering the lane based on bird images. The presented technique utilized a hybrid optimization technique for enhancing the accuracy level and attaining optimal weight.
Fang Zheng, etal[17]havedeveloped an algorithm in terms of Hough transform to detect lane line which was recognized the lane line directlyintheenvironment of Hough space. The presented work utilized an imagedataset that was performed with Hough transform and it was confirmed to the length and angle traits, intercept traits, and parallel traits were chosen in the Hough space. Those traits were directly transformed into the lane line equations. The experimental resultswereprovedthatthepresentedtechnique was recognizing the lane lines effectively.
Where , in the search space allsearch agentsaredenotedas,(4) WOA which consist of three stages they are listed below, Process of Encircling the Prey Process of Exploitation Phase Process of Exploration Phase 3.2.1 Process of Encircling the Prey Initially, the search agents take the encircle process which means the search agents used to define the best solution's location and encircle it. Furthermore, using the objective function found the current best solution. The current best candidate solution is the best obtained solution, thus it's close to the optimal solution. Other search agents adjust their positions in the direction of the best candidate solution after receiving the best candidate solution. The updated position of the search agents is, (6)(5)
3 2 Lane
The Swarm based optimization technique of the global strategy is the Whale OptimizationAlgorithm(WOA).Herethe search agents are represented by the population of the candidate solutions which exist in the WOA. Thesearchagents can be denoted as, (2) For the specific optimization problem’s candidate solution is represented as the location of the search agent. The objective function of the WOA is . Each search agents have position vector art at any point of time, which is denoted as and associated with search agents. Amid the search agents concerning the objectivefunction isrepresentedasthe , this is the best level that search agents have visited up to the current level Process: For the search space dimension is represented as in addition to is the search agents consist of the swarm.(3)
The problem of finding redundant information systems has been attracted by many researchers. The expensive basic solution is only applicable in the simple dataset for the problems such as creating all feasible subsets, discovering a subset, and reclaiming those through the least function value. Maximum only one redundant is needed, in traits rarely one subset is used to minimize the dataset, thus discovering the rest of all the estimations is pointless. For the FS problem, the current subset is described by the binary vector which is the solution. In the subset randomly a small number altering of embers that leads the WOA's specific version is perturbed a subset. The objective function is measuring the solution which includes redundant traits or not. In addition, between the computational burden and efficiency of attribute extraction, the accuracy of classification or other criteria is considered the best trade off. In this paper, BWOA is employed to choose the traits for the best traits combinationandachieveoptimum solution capably. This work introduces a new novel algorithm which is the binary WOA algorithm because of simple and useful to discover global solutions in WOA. In addition, for the Feature Selection (FS) problem, this algorithm is to enhance the discovering the best solutions, that have precision and reliability. The range of the agents or in binary version the whale’s positionis 0 to 1.Preservingthe proposedalgorithmis the principal purpose of this algorithm as same as the simple original WOA.Thebubble nethuntingapproachforhumpback whales is known as WOA's humpback whale hunting method in which within the shrinking circle and with a spiral shaped path, the humpback whales are swim around the prey and create bubbles. To select between the spiral model and the shrinking encircling mechanism, the probability of imitation behavior in WOA is 50% and then this proposedBWOAchange this probability in search space for the spiral model into 40% to provide further intensification.
.
International Research Journal of Engineering and Technology (IRJET) e ISSN: 2395 0056 Volume: 08 Issue: 12 | Dec 2021 www.irjet.net p ISSN: 2395 0072 © 2021, IRJET | Impact Factor value: 7.529 | ISO 9001:2008 Certified Journal | Page1601 (1)
Where estimates the neighborhood location of an image at The noise destructed lane lineimagesareobtainedfor the further feature analysis process. Line Feature Selection using BWOA
Where = Current Iteration number, and = Coefficient vectors, = Best candidate solution’s position vector. = Current search agent’s position vector, | | = Used values are absolute in nature. (8)(7)


International Research Journal of Engineering and Technology (IRJET) e ISSN: 2395 0056 Volume: 08 Issue: 12 | Dec 2021 www.irjet.net p ISSN: 2395 0072 © 2021, IRJET | Impact Factor value: 7.529 | ISO 9001:2008 Certified Journal | Page1602
During execution, which is decreased from 2 to 0. In addition, = Random vector which is a range of 0 to 1. 3.2.2 Process of Exploitation Phase
After the process of encircling the prey, the exploitation process is done. The attack mechanism of the humpback whales is inspiring this phase which is also known asabubble net mechanism. In the humpback whales modelingthebubble, net behavior consists of two types of mechanisms. Mechanism of Shrinking Encircling: Reducing the value of which means the value of is decreased from 2 to 0 linearly leads to modeled this mechanism. Moreover, the value of the is in the range of to Mechanism of Spiral Updating Position: The distance between the calculation of the best search agent and the estimation of the current search agent.is done in this mechanism. In addition, the spiral shape movement of the humpback is represented by the spiral equation. The spiral equation is given below, (9) = , The distance between the location of best and current search agent location, = Constant, = Arbitrary Number, in between 1 to 1.
Algorithm Parameters1
Initialization: Input Parameters: No. of humpback whales = , No. of variables = , No. of Iterations = , Max. No. of Iterations = . Output Parameters: Optimal position = . Best fitness = Initialization. of the binary population for the number of humpback whales;
While Stop conditions do for to do Fitness of the agent is calculated; if then fix current fitness value by and update the best leader so far; ifend then From the best leader is selected randomly; End Update , and ; Random number generation in between the 1 to 1 range and is in between the 0 to 1 range. for to do if then if <1 then
Furthermore, to choose betweenthesetwomechanismshereis 50% probability, so it is using both mechanisms. The exploitation phase is represented as, (10)= Random number ranges from 0 to 1. 3.2.3 Process of Exploration Phase: This is the last phase of this WOA, where randomly the search agents search the best solution over the search space, and the changedsearch agents’positionis revisedconcerningtheother agent's position. When moving the search agents left from the reference search agent, the value of is either more than 1 or less than 1 (11) (12) The above equations are the numerical model of the exploration phase.


For finding the optimum solution, add the new procedure to BWOA to improve the search performingandimprovethenew solution quality through the goal of shifting to a provide hope research field centered on the best solutions that have been shown. More than one optimal solution is available for the solution of the feature selection problem. The memory structure is used in the implementation of this procedure
International Research Journal of Engineering and Technology (IRJET) e ISSN: 2395 0056 Volume: 08 Issue: 12 | Dec 2021 www.irjet.net p ISSN: 2395 0072 © 2021, IRJET | Impact Factor value: 7.529 | ISO 9001:2008 Certified Journal | Page1603
#Mechanism of Shrinking encircling preys search agents’position is revised concerning to best solution; else #Mechanism of Search of preys search agents’position is revised concerning to random agent; end else #Spiral bubble net attacking search agent’sspiral position is revised; Give as the minimal reduct.
= Walk step derived from equation 9. = Constant value; In addition, divided by 4 is maintain the value in the range of 0 to 0.5. Then the below calculation is denoted the upgrading the whale position or trait of spiral bubble net feeding (17)
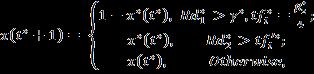
3.2.4 Prey search: In BWOA, using the transfer function, for arbitrarily chosen search feature rather of best search feature the search agent revised when the is greater than 1. The position of the whale on randomly chosen search features is given as(18)follows,
= The random number consistently shared in between range 0 to 1; = Random whale from the population.
Mechanism of Spiral bubble net feeding maneuver: Between the position of prey and whale, the spiral equation is used to copy the helix shaped movement of humpback whales.
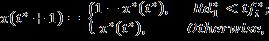
Mechanism of shrinking encircling preys: In the BWOA, like in the WOA, the best candidate solution is deemed the target prey, and the remaining search agents improve their locations in the BWOA.In equation (4) into new value range by converting step values which are in 0 to 1 as follows, (13) = Constant value; which is equal to ; = The new parameter is added to avoid is equaltozero in the case of are zeros. The new position of the BWOA depends on equation (5) in WOA. The new updating position of BWOA, (14) = Random number which is consistently shared in the range 0 to 1.
= Uniformly distributed number [0,1];
endendendend
= The parameter which makes the difference in results and updates current solution if in current population more than one of the same solutions.
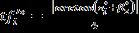
Equation 9 is described by another transfer function in BWOA as follows, (16)(15)


4.1. Performance Metrics
Accuracy The term of accuracy is described as theamountof misbehavior detection made correctly. The mathematical representation is below, (23) Precision Precision is defined as the detection of positive class values by the proposed model accurately. The equation for the precision is given below, (24) Recall The sensitivity or measure recall is defined as the correctly detected misbehavior and non misbehavior data by the proposed approach. The formulafortherecallisasfollows,(25)
International Research Journal of Engineering and Technology (IRJET) e ISSN: 2395 0056 Volume: 08 Issue: 12 | Dec 2021 www.irjet.net p ISSN: 2395 0072 © 2021, IRJET | Impact Factor value: 7.529 | ISO 9001:2008 Certified Journal | Page1604 which means they visited best solutions (short term= consideringthe best solution’srecentset).Thebestsolutionset is represented as and is the length of this set. In suboptimal regions maybe stick to the approach which is the traits of poor quality during the search. Furthermore, apply this procedure after the one bythirdofmaximumiterations,so that the best optimal solution gets. The best solution is selected by BWOA in as the set of minimum traits at the end of the search.
3.3 Lane line misbehavior detection using MLP_BP Typically, for detecting the misbehavior activity of vehicles, lane line images with the interaction of vehicles are considered in the proposed system. The proposed model incorporates a new framework named Multilayer Perceptron integrated through the back propagation algorithm (MLP_BP). The MLP framework containsthreelayers:aninput layer, a hidden layer, and an output layer that processes labeled data. The weight values present in the network model are tuned based on the BP training model. The output error function of the hidden layer cannot be estimated due to the unknown actual measure. That’s why the back propagation based training model is adopted in the proposed system for classification purposes. The input of MLP is a total number of selected features acquired from proposed meta heuristic values. The focus of this study is to discriminate both the misbehavior and normal activity of vehicles present in the lane line image. Each selected feature is divided to get its representative level in discriminating between misbehavior and non misbehavior activity. The steps followed in the network model is detailed as follows, Primarily, the MLP_BP network model takes input and yield target as . Each neuron present in the learning algorithm incorporates the summation of weight function and is mathematically formulated as follows, (19) Here the weight term represents the connection among node and . The output of the precedingnodeis denotedas .The summation function present in the above equation is converted to a sigmoid form of activation function and is formulated as follows, (20) The above equation is determined for getting the activation output in the node . The further step is to evaluate the error function using the output estimated function and the target function . The back propagation model is incorporated in the proposed network model for choosing the weight values and to get the derivative function of each hidden layer and is formulated as, (22)(21) With the aid of the backpropagation algorithm, the obtained output is equated with the estimated and target output by which the error function is evaluated. The back propagation model updates the minimal error function to the network model by updating weight values. Henceforth, the outcome achieves very closer to the estimated or target outcome. The procedure gets repeated until the final iteration and the error gets minimized.
This segment describes the proposed model’s performing metrics, some metrics are validatedandtested.Theevaluation of the performance metrics taken for the suggested and present analysis are elaborated and mathematically represented as follows,
A detailed explanation of the outcomes is discussed in this section. The major focus of this study is to detect the lane line misbehavior of the vehicles. The suggested approach is implemented in the python tool, in addition, compared with the present approach to prove the suggested method is more perfect than the other techniques. Furthermore, this portion evaluates the performing metrics of the proposed MLP BP approach in terms of accuracy, precision, F Measure, recall, and Loss function through existing techniques. The below section explained the performance matrices of this approach.
4. Results and Discussion


4.3. Comparison of Performance metrics
This section detailly explained the comparison for the performing metrics of the proposed and existingmethodssuch as CA DC MDS, MARV X, and PF MDS. For analyzing the proposed detection system, primarily confusion matrix is generated for the taken source code dataset based on statistical measures. To show the clarityoftheproposedbased detection of lane line misbehavior in vehicle, its obtained results of training and validation processforthetakendataset are graphically displayed in the following figures. The performance parameters of the proposed and existing approaches, like accuracy, precision, recall, f measure, and loss, are compared in the following figures.
F measure means the computation of mean value using accuracy and recallwhichprovidestheF measure. It varies from 0 (worst performance) to 1 (highest performance). The formula for F measure is as follows,(26) Loss This is one of the quality metrics which helps to detect the performance of the detection model. In addition, it is calculated through the error function. According to the above standard formulas, these statistical measures are evaluated. For each measure, the whole performance of suggested and presenttechniquesiscomputed and offered in the subsequent section.
Figure 2: The exactness of proposed and existing methods
Table 1: Performing comparison of the proposed and existing methods In table 1, For the proposed method (MLP+BP), 0.9194 is the accuracy, 0.8958 is the precision value, 0.8722 is the value of the recall, 0.8907 is the F Measure value and 0.2793 is the loss of the proposed method. For the Context aware data centric misbehavior scheme (CA DC MDS) method, 0.8902 is the accuracy value, 0.8865 is the value of the precision, 0.8695 is the recall value, 0.8512 is the F measure value and 0.3562 is loss value. For Man oeuvre evaluation for ReliableVerification of Mobility Data (MARV X) method, 0.8654 is the accuracy, 0.8545 is precision, 0.8456 is the recall, 0.8263 is F measure and 0.3826 is loss value. In addition, for Particle Filter (PF MDS) method, 0.8321 is the accuracy value, 0.8302 is the precision value, 0.8123 is the recall value, 0.8065 is the F Measure, and 0.4025 is the loss value.
Figure 1 demonstrates the comparison of the accuracy of the proposed and existing such as CA DC MDS, PF MDS,MARV X,and. For the proposed technique, 0.9194 is the accuracy value is better than the other existing techniques. For CA DC, 0.8902 is the accuracy, 0.8654 is the accuracy of the MARV X, and 0.8321 is the accuracy of the PF MDS. The proposed method is more accurate than the other techniques,according to the analysis.
4.2. Analysis of performance metrics for proposed and existing approaches: The performance metrics of the proposed and existing techniques are discussed in the below table. The evaluated performance metrics are accuracy, precision; recall, F Measure, and Loss of the suggested and existing are listed.
Figure 1: Accuracy of proposed and existing methods
From the analysis, it can be statedthattheproposedtechnique achieves a good prediction rate. Theabovefigurefurnishes the good accuracy for detecting the lane line misbehavior of the vehicle in earlier stage using proposedattributeselectionwith MLP model integrated with BP. Forinstance,whenthenumber of iterations gets increases, accuracy also graduallyincreases.
International Research Journal of Engineering and Technology (IRJET) e ISSN: 2395 0056 Volume: 08 Issue: 12 | Dec 2021 www.irjet.net p ISSN: 2395 0072 © 2021, IRJET | Impact Factor value: 7.529 | ISO 9001:2008 Certified Journal | Page1605
F measure
Furthermore, the Manoeuvre Assessment for Reliable Verification of Mobility Data (MARV X) Particle Filter (PF MDS), and Context aware data centric misbehaviour scheme (CA DC MDS) are considered the existing methods. Table 1 illustrates the performance comparison of the performance metrics of the proposed and existing techniques.
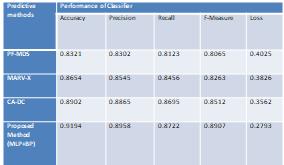
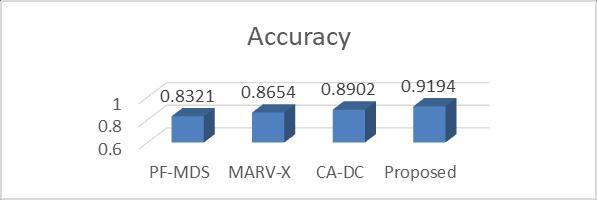
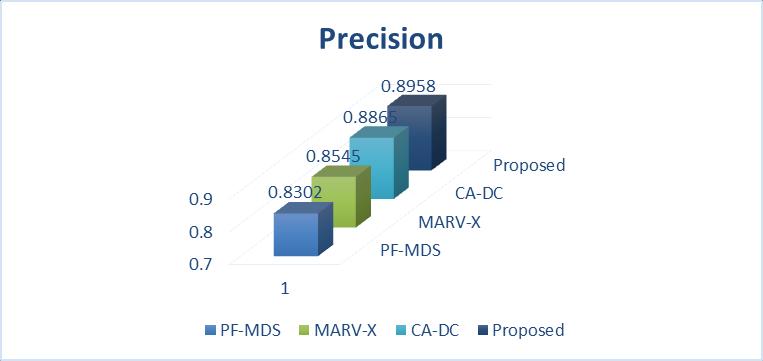
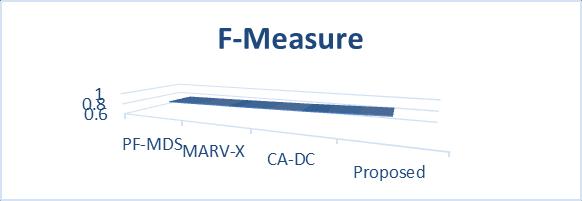
Figure 4 demonstrates the F Measure of the suggested and present methods such as CA DC, MARV X, and PF MDS. The proposed has a high F measure value which is 0.8907. The others are 0.8512, 0.8263, and 0.8065 for CA DC,MARV X, and PF_MDS.
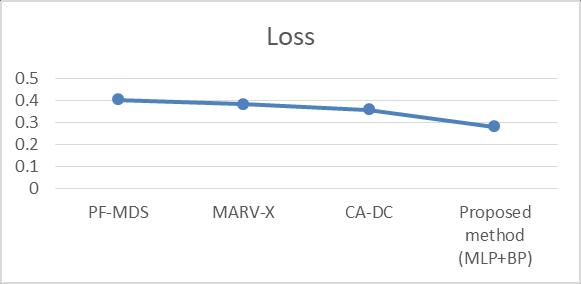
Figure 5: The loss of the proposed and existing methods the loss achieved by proposed attribute selection with MLP model attains minimum detection error and is shown in the above figure. Here, when the iteration is raised,thedetectionerrorof the proposed solution decreases. As a result,itisfoundthatthe suggested system improves accuracy and error function.
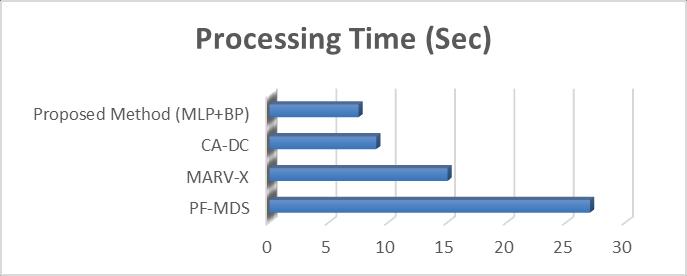
Figure 6 demonstrates that the processing time of the proposed and existing methods. The processing time of the suggested method is 7.5 secs, in addition, to the existing methods, 9 secs for CA DC, 15 secs for MARV X, and 27 for PF MDS.
The precision similarity of the proposed and existing methods is illustrated in figure 2. Furthermore, 0.8958 is the precision value of the proposed method, 0.8865 is the precision for CA DC, 0.8545 is for MARV X, and 0.8302 is for PF_MDS. The proposed method's precision value is better than the existing techniques.
From the achievable outcome, it is proven that selected
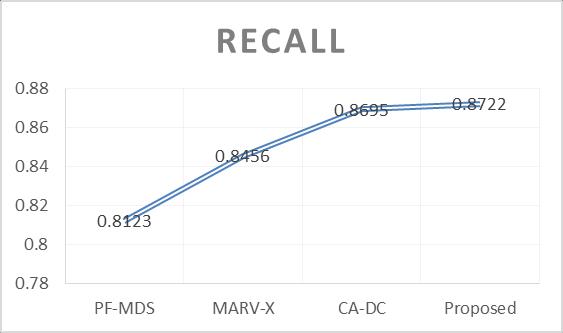
Figure 3 demonstrates the recall comparison, for the proposed method, 0.8722 is the value of the recall, 0.8695, 0.8456, and 0.8123 are recallvaluesoftheexistingapproaches such as CA DC, MARV X, and PF MDS. The recall of the proposed is greater than the other techniques.
International Research Journal of Engineering and Technology (IRJET) e ISSN: 2395 0056 Volume: 08 Issue: 12 | Dec 2021 www.irjet.net p ISSN: 2395 0072 © 2021, IRJET | Impact Factor value: 7.529 | ISO 9001:2008 Certified Journal | Page1606
Figure 6: The processing time of the proposed and existing techniques. When the loss acquired is reduced, then automatically the system performing will get enhanced this is fine recognized truth. The above fact by sustaining the proposed system works well by receiving the least loss value. Thus, from the analysis, it is resolved that general performing is enhanced sufficiently for discovering lane line misbehavior of vehicles. From the overall analysis, it is concluded that the suggested MLP attains the best solution for the prediction system due to the incorporationoftheoptimizationprocedure.
Figure 5 demonstrates the comparison of the loss of the suggested method and present approaches such as CA DC, MARV X, and PF MDS. For the proposed method, 0.2793 is the loss value, 0.3562 is the loss of the CA DC, 0.3826 is the loss of the MARV X, and 0.4025 is for PF MDS.
Figure 3: Recall of the proposed and existing methods
Figure 4: F Measure of the proposed and existing method
[11]Sharma,P.andLiu,H.,2020.AMachine Learning Based Data Centric Misbehavior Detection Model for Internet of Vehicles. IEEE Internet of Things Journal, 8(6), pp.4991
[14]Jahangiri,A.andRakha,H.A.,2015.Applyingmachine learning techniques to transportation mode recognition using mobile phone sensor data. IEEE transactions on intelligenttransportationsystems,16(5),pp.2406 2417. [15] Kim, I.H., Bong, J.H., Park, J. and Park, S., 2017. Predictionofdriver’sintentionoflanechangebyaugmenting sensor information using machine learning techniques. Sensors,17(6),p.1350. [16] Du, X. and Tan, K.K., 2016. Vision based approach towardslanelinedetectionandvehiclelocalization.Machine VisionandApplications,27(2),pp.175 191. [17] Zheng, F., Luo, S., Song, K., Yan, C.W. and Wang, M.C., 2018. Improved lane line detection algorithm based on Houghtransform.PatternRecognitionandImageAnalysis, 28(2),pp.254 260. [18]Cao,J.,Song,C.,Song,S.,Xiao,F.andPeng,S.,2019.Lane detectionalgorithmforintelligentvehiclesincomplexroad conditions and dynamic environments. Sensors, 19(14), [19]p.3166.Lee,M.,Han,K.Y.,Yu,J.andLee,Y.S.,2019.Anewlane following method based on deep learning for automated vehicles using surround view images. Journal of Ambient IntelligenceandHumanizedComputing,pp.1 14. [20]Zou,Q.,Jiang,H.,Dai,Q.,Yue,Y.,Chen,L.andWang,Q., 2019.Robustlanedetectionfromcontinuousdrivingscenes usingdeepneuralnetworks.IEEEtransactionsonvehicular technology,69(1),pp.41 54.
REFERENCES: IEEE.Internationalcommunicatdetection[8]oftechniques.using2017,[7](IV)algorithms.marking[6]boundary.detection[5]pp.1816warningillumination[4]warningindividualacceptability[3]pp.432ADASCoordinated[2]Safety,systemsA[1]Qiu,S.,Rachedi,N.,Sallak,M.andVanderhaegen,F.,2017.quantitativemodelfortheriskevaluationofdriverADASunderuncertainty.ReliabilityEngineering&System167,pp.184191.Lin,T.C.,Ji,S.,Dickerson,C.E.andBattersby,D.,2018.controlarchitectureformotionmanagementinsystems.IEEE/CAAJournalofAutomaticaSinica,5(2),444.Sun,Q.,Zhang,H.,Li,Z.,Wang,C.andDu,K.,2019.ADASimprovementbasedonselflearningofdrivingcharacteristics:acasestudyoflanechangesystem.IEEEAccess,7,pp.8137081381.Son,J.,Yoo,H.,Kim,S.andSohn,K.,2015.Realtimeinvariantlanedetectionforlanedeparturesystem.ExpertSystemswithApplications,42(4),1824.Li,J.,Shi,X.,Wang,J.andYan,M.,2020.AdaptiveroadmethodcombininglanelineandobstacleIETImageProcessing,14(10),pp.22162226.Chen,T.,Chen,Z.,Shi,Q.andHuang,X.,2015,June.RoaddetectionandclassificationusingmachinelearningIn2015IEEEIntelligentVehiclesSymposium(pp.617621).IEEE.Bailo,O.,Lee,S.,Rameau,F.,Yoon,J.S.andKweon,I.S.,March.RobustroadmarkingdetectionandrecognitiondensitybasedgroupingandmachinelearningIn2017IEEEwinterconferenceonapplicationscomputervision(WACV)(pp.760768).IEEE.Gyawali,S.andQian,Y.,2019,May.Misbehaviorusingmachinelearninginvehicularionnetworks.InICC20192019IEEEConferenceonCommunications(ICC)(pp.16).
The principal aim of the proposed system is to discover the misbehavior activity acquired from the original lane line image. The median filter is adopted to eliminate the noisy information contained in an image. The filtered outcome image is processed to the feature selection phase whereas a binary whale optimization algorithm is introduced to get the binary features. This tends to make the classification process easier. For categorizing the normal and misbehavior activity from the lane line image, MLP_BP is proposed by minimizing the error function. The performance measures exhibit the proposed methodology in an effective manner.
[9]Kamel,J.,Ansari,M.R.,Petit,J.,Kaiser,A.,Jemaa,I.B.and Urien, P., 2020. Simulation framework for misbehavior detection in vehicular networks. IEEE transactions on vehiculartechnology,69(6),pp.6631 6643.
[12]4999.Wahab, O.A., Mourad, A., Otrok, H. and Bentahar, J., 2016. CEAP: SVM based intelligent detection model for clusteredvehicularadhoc networks.ExpertSystemswith Applications,50,pp.40 54.
[10] Zhang, C., Chen, K., Zeng, X. and Xue, X., 2018. Misbehaviordetectionbasedonsupportvectormachineand Dempster ShafertheoryofevidenceinVANETs.IEEEAccess, 6,pp.59860 59870.
International Research Journal of Engineering and Technology (IRJET) e ISSN: 2395 0056 Volume: 08 Issue: 12 | Dec 2021 www.irjet.net p ISSN: 2395 0072 © 2021, IRJET | Impact Factor value: 7.529 | ISO 9001:2008 Certified Journal | Page1607 attributes are most appropriate in detecting the lane line misbehavior of the vehicles CONCLUSIONS :
[13]Kim,J.,Kim,J.,Jang,G.J.andLee,M.,2017.Fastlearning method for convolutional neural networks using extreme learning machine and its application to lane detection. NeuralNetworks,87,pp.109 121.
[21]Yang,W.J.,Cheng,Y.T.andChung,P.C.,2019.Improved lane detection with multilevel features in branch convolutionalneuralnetworks.IEEEAccess,7,pp.173148 [22]173156.Li,J., Mei, X., Prokhorov, D. and Tao, D., 2016. Deep neuralnetworkforstructuralpredictionandlanedetection intrafficscene.IEEEtransactionsonneuralnetworksand learningsystems,28(3),pp.690 703.
[23] Shirke, S. and Udayakumar, R., 2020. Hybrid optimisation dependent deep belief network for lane detection. Journal of Experimental & Theoretical Artificial Intelligence,pp.1 13.
International Research Journal of Engineering and Technology (IRJET) e ISSN: 2395 0056 Volume: 08 Issue: 12 | Dec 2021 www.irjet.net p ISSN: 2395 0072 © 2021, IRJET | Impact Factor value: 7.529 | ISO 9001:2008 Certified Journal | Page1608