
International Research Journal of Engineering and Technology (IRJET) e-ISSN: 2395-0056 p-ISSN: 2395-0072
Volume: 11 Issue: 08 | Aug 2024 www.irjet.net

International Research Journal of Engineering and Technology (IRJET) e-ISSN: 2395-0056 p-ISSN: 2395-0072
Volume: 11 Issue: 08 | Aug 2024 www.irjet.net
1,2Student, Department of Civil Engineering, NMAM Institute of Technology, Nitte, Udupi, Karnataka, India. 3Professor, Dept. of Civil Engineering, NMAM Institute of Technology, Nitte, Udupi, Karnataka, India
Abstract - Kavoor Lake, Mangaluru is one of the few remaining lakes in the city and is of significant historical and agricultural prominence. Rampant development and encroachment have led to several lakes in the city vanishing in the last 50 years. Kavoor lake too has been affected deeply, with the lake now reduced to a marsh and filled with silt. The Mangaluru Smart City Limited (MSCL), under the Government of Karnataka has undertaken the improvement of the lake. The key issues targeted in this study are the substantial drop in the level of water during peak summer and pollution aspects.Initial study involves delineation and mapping of the lake using Google Earth and Bhuvan. GIS is used to prepare land use/ land cover maps and various other thematic maps. GIS is further used to delineate the catchment area of the lake for hydro logical analysis like time of concentration, runoff estimation, etc. Water quality analysis of the lake at different intervals throughout the year is done. The results obtained after hydro logical and GIS analysis are used for limnological modelling of the lake. Cost estimation for the revival of the lake and lake front development considering its aesthetic, utility and environmental aspects is carried out.
Mangalore is the chief port city of Karnataka, India and over the last 50 years, has seen a haphazard and rampant increase in its population and subsequent land usage. One of the key issues unsettling the residents of this flourishing city is the grave and deep impact this has had on the lakes in the city. Excessive human activities have led to several lakes vanishing over the last few decades, and the few lakes that remain have undergone alarming degradation in terms of quality and quantity over a period of time. This study focuses on one such lake situated in Kavoor, Mangalore. Kavoor lake is a major and one of the few lakes remaining in the city. As a consequence of constant encroachment and neglect, the lake is now dry and has been filled with silt and converted into a marsh due to lack of facilities to hold back rainwater. Adjoining the old Mahalingeshwara temple in Kavoor, water from the lake was being used for many of the rituals in the temple. A Pushkarni (temple tank) was built in a part of the lake where these rituals were
performed. Being one of the closest lakes to a rapidly developing city, this lake has not only been used as dumping ground for various types of wastes but also has repeatedly faced De-siltation, rejuvenation and renovation programs. Drains that once brought water to the lake now dump medical, industrial and organic sewage into it. Kavoor lake has immense historical prominence. Many agricultural projects in the area depend on this lake and hence it is important to study and protect this fragile and rapidly shrinking wetland ecosystem before it is lost forever. In 2011, the State government took up the work of removing the silt and improving its aesthetics at the cost of Rs.1 crore but except for laying embankment and building a mud path on the bund, there has been no significant improvement in the lake or the surrounding conditions. The Mangaluru Smart City Limited (MSCL), under the Government of Karnataka (GoK), has proposed the Improvement of Kavoor lake. The key issues targeted in this study are the substantial drop in the level of water during peak summer and pollution aspects. Keeping these in mind, Geo-hydro logical studies are carried out and a GIS based sustainable model for the development of the lake and its surroundings is proposed.
To delineate and map the tank area along with its capacity contours
Prepare various thematic maps for the tank and surrounding area
Identify and target all the sources of inflow and outflow (hydro logical studies) in the tank in order to understand the water scarcity problems and pollution aspects (water quality).
To prepare a GIS model for the sustainable development of the tank and its surroundings and suggest methods and solutions for revitalizing the lake along with detailed estimation.
Volume: 11 Issue: 08 | Aug 2024 www.irjet.net
Initial study involves delineation and mapping of the lake using Google Earth, Bhuvan and Total station.
Total station and depth probing are used for capacity contouring, estimation of silt and storage capacity of the lake.
GIS and image processing software are used to prepare land use/ land cover maps and various thematic maps like ISO-variation maps, drainage network, water table contours, lithology, soil maps etc.
GIS is further used to delineate the catchment area of the lake for hydro logical analysis like time of concentration, runoff estimation and understanding inflow-outflow using additional data like rainfall analysis and water table fluctuation of nearby wells.
Water quality sampling and analysis at different locations of the lake at different intervals throughout the year is done.
The results obtained after hydro logical and GIS analysis are used for limnological modelling of the lake.
Cost estimation for the revival of the lake and lake front development considering its aesthetic, utility and environmental aspects is carried out.
The location of the lake with respect to Mangalore city is shown in Fig 2.1. The district is characterized by high humidity (58-75%) and temperature (25 - 35 ºC) and heavy rainfall (average 4119 mm). The seasons can be distinctively divided as summer (pre-monsoon), rainy (monsoon) and winter (post-monsoon).
2395-0072
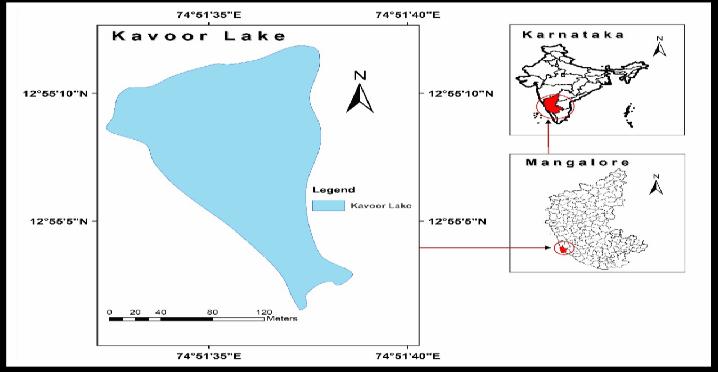
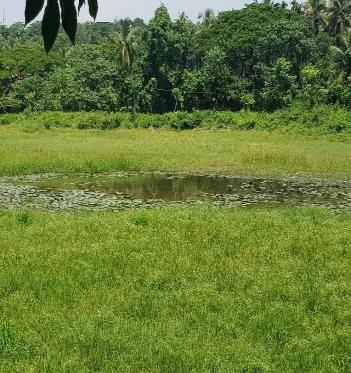
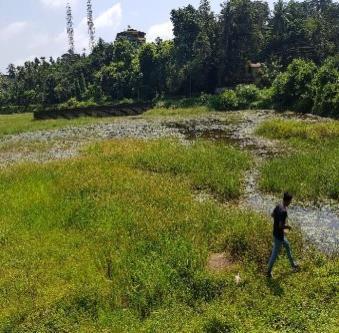
The lake is located at an altitude of 38m from the mean sea level. Mahalingeshwara temple lies on the northwest bank of the lake which has a history of 15th century. Hence, it is estimated that this lake was built during that period. The lake has a gradient towards the north-west region. During heavy rains, a large amount of silt and soil as well as other solids flow into the lake. They get accumulated on the banks year by year reducing the area of water shown in Fig 2.2.
Volume: 11 Issue: 08 | Aug 2024 www.irjet.net
The boundary of the lake as well as other features like the temple tank and the surrounding mud roads are delineated using Google Earth and Bhuvan and then mapped in QGIS. Fig. 2.3 shows the delineated lake and lake area giving a context of the present site situation, showing the inlet and outlet locations. GIS analysis shows the area of the lake to be about 6.2 acres. This was also verified using Google Earth and Bhuvan. The whole Lake area is approximately 6.8 Acres (estimated from latest Sentinel-2 satellite imagery in QGIS and also Google Earth) which is surrounded by residential built up structures and abundant greenery, providing the perfect opportunity of rejuvenating and redeveloping it as a means of a reliable water resource significant for the improvement of the recreation and water harvesting options for the residents of the city and beyond.
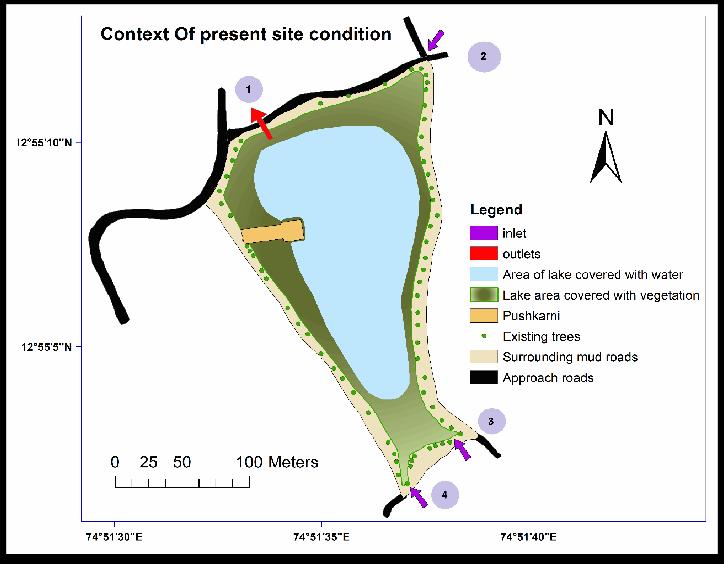
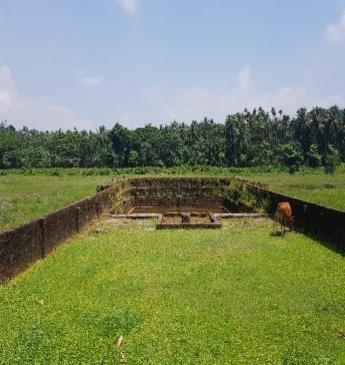
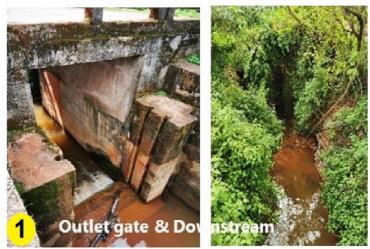
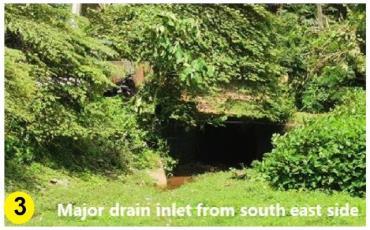
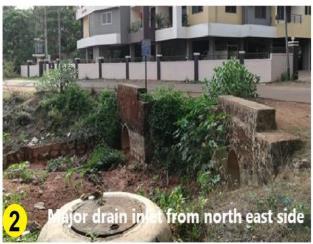
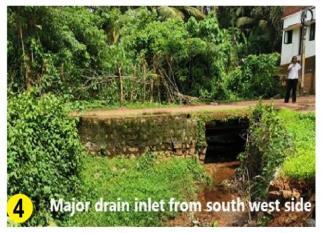
There is a total of three inlets into the lake (points 2, 3 and 4 as shown in Fig 2.3), through which water flows in, while there is only one outlet (point 1 as shown in Fig. 2.3), through which the water flows out. Major drains are present on the north eastern side of the lake. A step well is situated on the western side of the site, jutting out into the lake. Fig. 2.4 shows the photographs of inlets and outlets with reference to Fig. 2.3. The inlet/outlet will be referenced in the order as in Fig. 2.3 for every further analysis in the report.
2395-0072
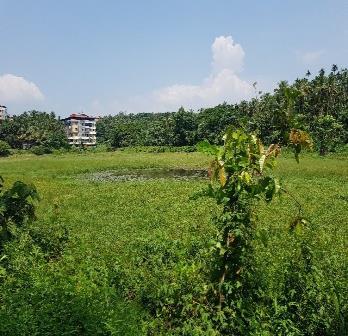
The area around the site has a substantial amount of greenery with a dense collection of coconut trees. The eastern side of the lake is occupied by areca nut and coconut plantations. The northern and southern banks had forest cover in the past but now it has been occupied by human settlement.
There are several issues present in and around the site, as noted below:
No mesh at the inlet to stop the garbage from upstream.
No gates or any mechanical system at outlet to stop the water.
No filtration system. Upstream channels need repair work.
Approach area around the lake is not properly developed.
Step well in the lake has become a garbage collection area due to the lack of water in the lake.
The lake is accessed through the Bajpe road along the north western edge. The site has a vehicular access with paved roads on the northern and southern edges, while the eastern and western edges are bound by kutcha roads. The width of all roads existing around the site ranges from 4 meters to 6 meters.
Volume: 11 Issue: 08 | Aug 2024 www.irjet.net
Regions in and around Mangalore witness heavy rainfall in the monsoons (June, July and August), while peak rainfall intensity is maximum in the month of October 35.93 mm/hr. The average yearly rainfall over a period of last 36 years come to 3395.2 mm, which is quite high as compared to the neighbouring regions.
The land use and Land cover is analyzed using latest Sentinel-2 thematic image using image classification in ArcGIS. The resolution of the bands used were the highest available for public use, i.e. 10m. This reduced the accuracy of the land use to an extent. To compensate for this, the land use and land cover of the catchment area were analyzed separately by digitizing in Google Earth and Bhuvan satellite imagery.
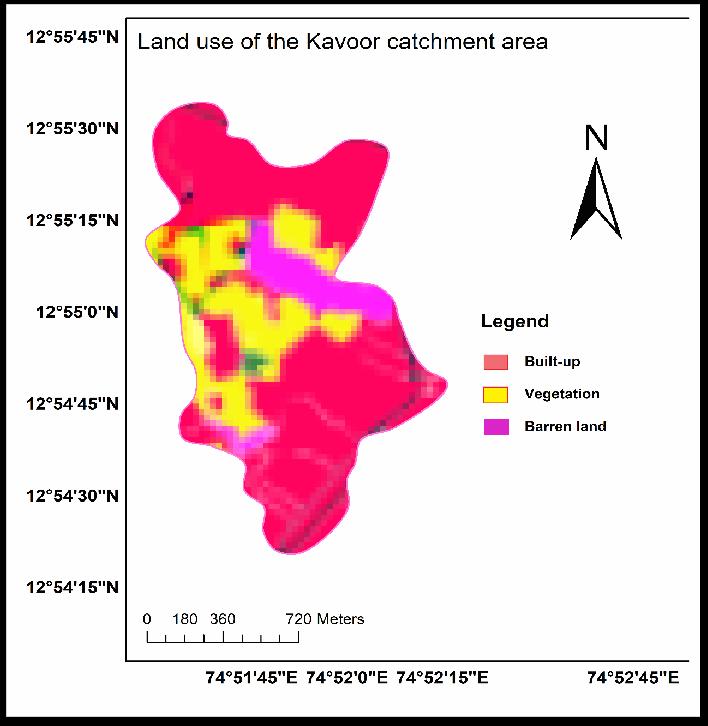
Fig -3.1
Fig. 3.1 shows the land use of the catchment area obtained after supervised image classification of the Sentinel-2 bands. The bands of Sentinel-2 used were Red, Green, Blue and Near-infrared. Infrared bands are useful in picking up traces of chlorophyll in plants and hence good for vegetation classification.
Google Earth and Bhuvan analysis were done keeping in mind the inputs required for the calculation of runoff into the lake. For roads, the total length of roads in each catchment zone is identified and then multiplied by an average width of 3.5m to obtain the area.
2395-0056 p-ISSN: 2395-0072
The total area of land draining into a lake or a water course at a given location is known as catchment area. To determine the total inflow into the lake, calculation of runoff is required. The catchment area contributes to the runoff into a lake and therefore run-off estimation requires delineation of the catchment and its area estimation. Additional factors influencing run-off are:
Shape and size of the catchment area
Distribution of rainfall over the catchment area
Surface conditions of the catchment area like drained, UN-drained, natural or cultivated, etc.
vegetal cover in the catchment area
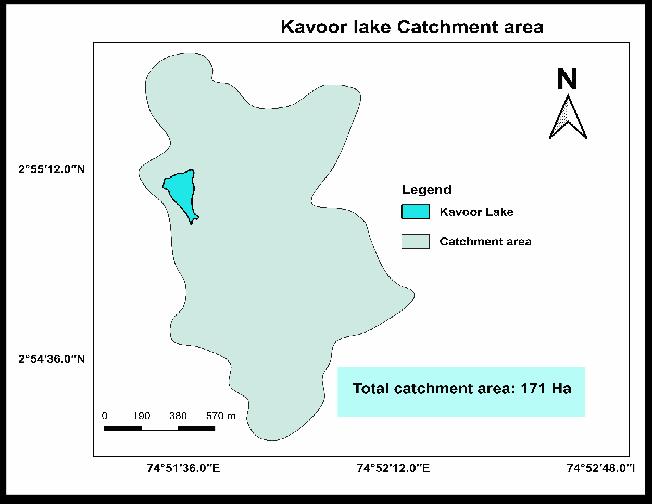
CARTOSAT Delivered Digital elevation model (DEM) of resolution 32m, obtained from Bhuvan database were used to delineate the catchment for Kavoor lake in ArcGIS. The accuracy of the boundary was verified in Google Earth by 3D terrain analysis. Initially the following DEM’s were used to delineate the catchment:
ALOS PALSAR 12.5m DEM
ASTER 30m DEM
SRTM 30m DEM
The catchments obtained from all the DEM’s, except ALOS PALSAR DEM, differed very slightly in shape or size and the difference in the area of the catchments was negligible. Although ALOS PALSAR DEM had higher resolution than the others, the data was inconsistent and hence its results UNreliable. CARTOSAT DEM being the most recent one (2014), gave the most accurate results.
Volume: 11 Issue: 08 | Aug 2024 www.irjet.net
The total catchment area of Kavoor lake is around 171 Ha. CARTOSAT DEM was further used to obtain the stream order and the stream network. Fig. 3.3 shows the stream network leading to the lake. Three distinct stream networks within the catchment area draining into each of the 3 inlets were identified.
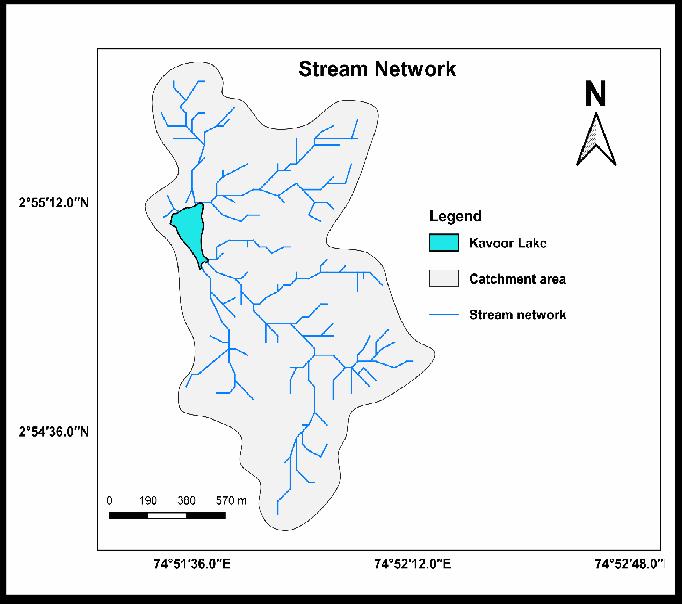
Fig -3.3:StreamNetwork
Based on the drainage network, the catchment area has been divided into three distinct zones, each basin draining separately into the three inlets. Fig. 3.4 shows the sub-basins or zones of the catchment and their areas. Calculation of time of concentration and discharge into the lake is done based on these three zones.
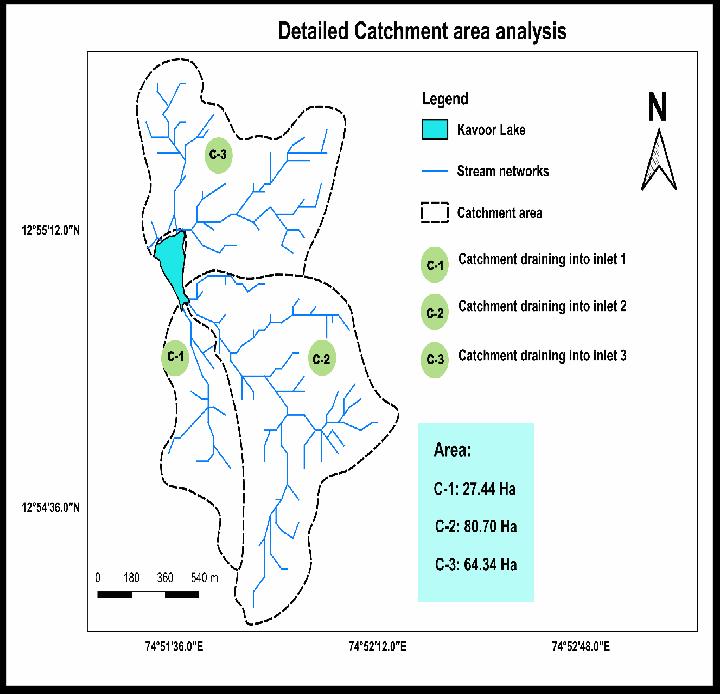
Fig -3.4:Zonesofcatchmentarea
2395-0056 p-ISSN: 2395-0072
Storm water runoff is that the portion of precipitation which flows over the ground during and a short time after a storm. The quantity depends on:
Surface drainage area (ha)
Intensity of the rainfall (L/s. ha)
The condition of surface (runoff coefficient, C)
The formula used to calculate storm water runoff is Q = C . I . A
where,
Q – Discharge in m/s
C – Run-off coefficient
A – Area of the catchment in m2
The weighted run-off coefficient for each catchment zone is calculated with the formula,
C = ((C1*A1) + (C2*A2) + (C3*A3)) /(A1 + A2 + A3)
where,
A1, A2, A3 – Area of Vegetation, roads, and residential and commercial structures in the catchment zones respectively
C1, C2, C3 – Impermeability factor for Vegetation, roads, and residential and commercial structures in the catchment zones respectively.
A1, A2 and A3 are obtained from land use and land cover maps in section 3.2.
The land use and land cover data from Google Earth and Bhuvan is also divided into three zones as per catchment to obtain A1, A2, and A3 in hectares.
The peak intensity of rainfall for calculation of the discharge is obtained earlier from rainfall data for the Mangalore region. Using this value, the total runoff into the lake is estimated.
International Research
Volume: 11 Issue: 08 | Aug 2024 www.irjet.net
of Engineering and Technology (IRJET) e-ISSN: 2395-0056 p-ISSN: 2395-0072
Sampling for hydro-biological parameters was done from six different locations of the lake on 25th October 2019 and the samples were preserved in air tight containers. The sampling locations are shown in Fig. 3.5
Turbidity is determined in the lab with a digital nephelometer.
Temperature (air and surface water) was recorded on the spot using thermometer.
The pH was measured by using the pH paper on the spot and then it was checked again in the laboratory using pH meter.
Total Dissolved Solids (TDS), Electrical conductivity (EC) and alkalinity were analyzed in the lab.
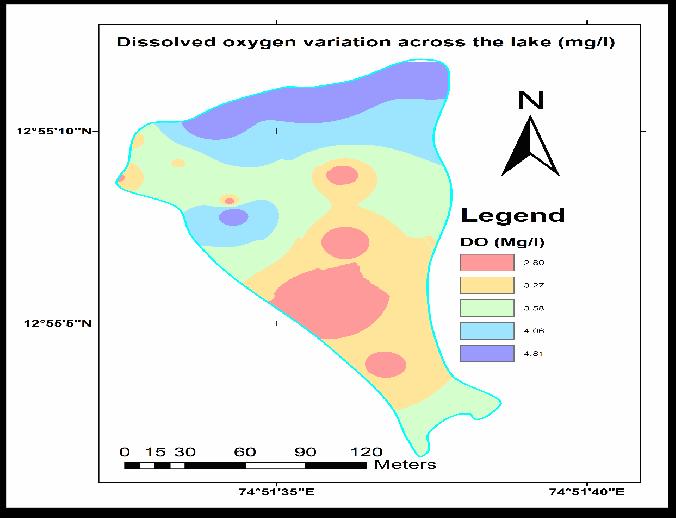
Dissolved oxygen and Biological Oxygen Demand were also analyzed according to standard procedure in the lab.
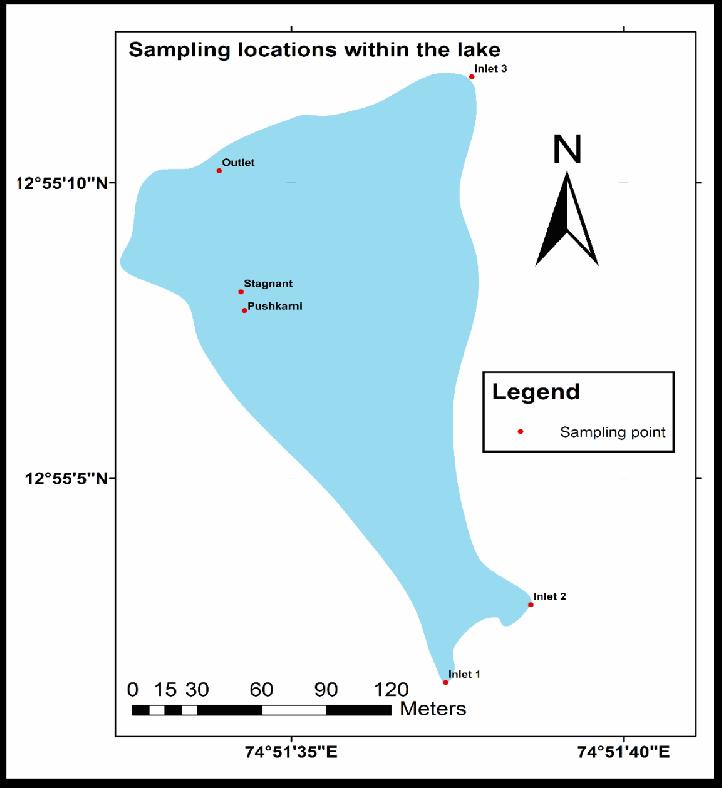
Fig -3.5:SamplingLocations
4.0
The highest intensity of rainfall was experienced during October, with an intensity of 35.93 mm/hr. This value is used for calculation of storm water runoff and to estimate time required to fill the lake during peak rainfall.
4.1 Land use and Land cover
The existing land use in the immediate vicinity of the lake shows the principal land use around the lake to be residential. There is a semi dense cover of trees all around. A temple present on the western end forms the place of social
interaction among the local people. The predominant land use around the lake is residential, with a few pockets of commercial along the approach roads. A patch of public and semi-public space around the site has also been demarcated. It is to be noted that the immediate area surrounding the lake has been demarcated as green as it forms an integral part of the lake ecosystem. The land cover classification of the entire catchment area showed the principal land use in the catchment to be vegetation and the rest built-up and barren land. The areas of the same are given below:
Area of Greenery = 98.14 Hectares
Area of built-up = 60.21 hectares
Area of barren land= 12.65 hectares
The total length of the roads for each zone was calculated as:
Length of roads in zone 1: 12.65m
Length of roads in zone 2: 30.85m
Length of roads in zone 3: 41.71m
The above values are used to calculate areas od roads for each zone of catchment which is tabulated in table 4.1
4.2 Calculation of Discharge into lake
Table -4.1:Catchmentareaandcumulativedata
The weighted average runoff coefficient is computed from the formula and value is found as 0.451. The value is then used in calculating runoff volume into each inlet
Volume: 11 Issue: 08 | Aug 2024 www.irjet.net
Table -4.2:DischargeofcumecsateachInlet
4.3 Water Quality Report
1
2
Table -4.3:WaterTestingReport
The pH of the water in the lake is under the permissible limit of 6.5-8.5 for drinking water.
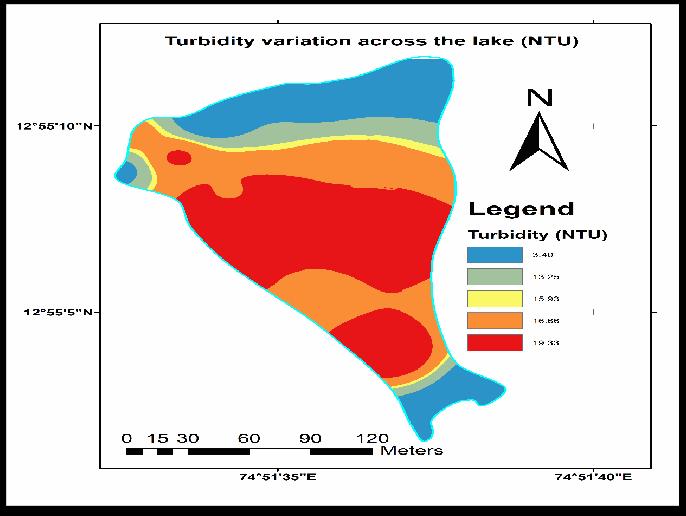
The turbidity varies from 3.5 NTU at the inlets to 17 NTU at the centre of the lake and is 29.2 NTU in the temple tank. The turbidity of water at the outlet is 7.62
NTU. The permissible limit of turbidity in drinking water is 5 NTU and desirable limit is 1 NTU.
The water flowing out the outlet needs to be coagulated to bring the turbidity within the permissible limit.
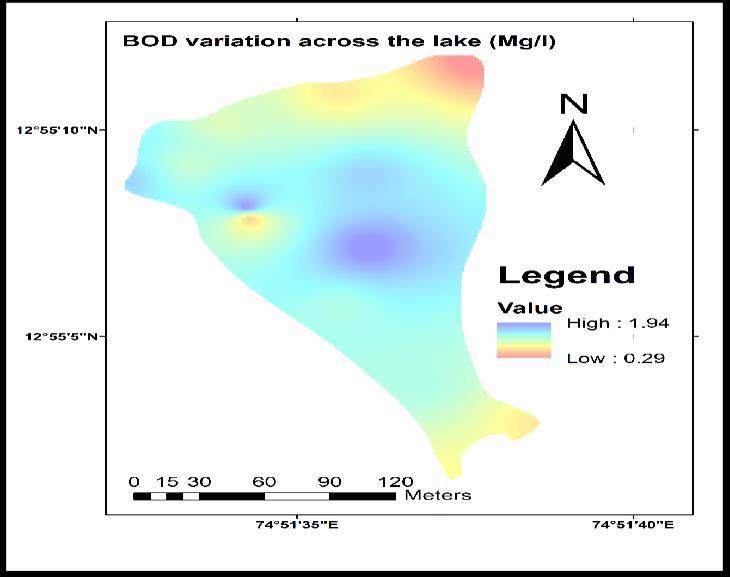
The BOD5 of the effluent is close to the permissible limit and can be used for drinking. The maximum BOD value recorded is in the stagnant waters at the centre of the lake. This value, 1.87 indicates only a slight contamination of the lake water.
The alkalinity is within the permissible limit of 20-200 Mg/L.
The variation of BOD, DO and Turbidity are visualized using ISO-variation maps made in QGIS.
International Research Journal of Engineering and Technology (IRJET) e-ISSN: 2395-0056 p-ISSN: 2395-0072
Volume: 11 Issue: 08 | Aug 2024 www.irjet.net
Based on the site conditions study, the lake is covered with vegetation and silt. De-siltation is a must for any undertaking to improve the lake. Inlets are in very poor condition and need to be repaired. The concrete has cracks with vegetation growing in them. The channel bed is irregular and needs to be reconstructed with proper slope. The outlet sluice gate has been damaged due to poor maintenance and needs to be repaired too.
Based on rainfall analysis for the Mangalore region, the region experiences heavy rainfall during the June and July season, enough to fill the lake.
Based on catchment area analysis, the vegetation cover is 58% of the total catchment area. The presence of high vegetal cover decreases the runoff volume into the lake. During the DE-siltation programme undertaken by the government, in the west side of the lake a new road has been formed which has given way for further encroachment of the lake area in view of widening of existing road.
Based on the water quality analysis, the lake can be used as a source of the city water supply chain after minimal treatment as most parameters fall under permissible limits. But, situated in the heart of Mangalore city, Kavoor lake faces great threat from pollution due to urban wastes. Nonbiodegradable materials like plastic covers, bottles, metal, glass pieces, garbage, etc., are thrown near the lake bund which gradually enters into the lake. The agriculture land nearby contributes substantially to inorganic pollution through surface run-offs. Thus, the lake is losing its original ecological characteristics that supported abundant biodiversity. Hence, there is an urgent need to protect this lake from further degradation.
I would like to express my sincere gratitude to the Manglore Smart City Ltd for their invaluable support in thisproject.Theirguidanceandcollaborationwerecrucial in overcoming challenges and achieving our goals. This project would not have been possible without their commitment to sustainable development, and we look forwardtocontinuingourpartnershipinfutureendeavors.
[1] Singh R, Bhatnagar M. Urban lakes and Wetlands (2012): opportunities and challenges in Indian citiescase study of Delhi, In: Worldwide workshop for young environmental scientists – Urban waters: resource or risks? Arceil, France, 2012 (10www-YES-2012-09-28DT.doc)
[2] Giriyappanavar BS, Shivali PB (2013): Assessment of water quality using CCME WQI for Hubli temple tank, Karnataka state, India. International Journal of Recent Scientific Research 2013; 4(10):1507-1511.
[3] Venkatesan J. Protecting Wetlands: Current Science 2007; 93:288-290.
[4] Nandini N, Bheemappa K, Vijay Kumar M, Raghavendra M. (2013): Policy Framework for Conservation of Water Bodies in Bangalore. International Journal of Advanced Research 2013; 1(4):42-45.
[5] Prasad SN, Ramachandra TV, Ahalya N, Sengupta T, Kumar A, Tiwari AK et al. (2002): Conservation of wetlands of India- a review. Tropical Ecology 2002; 43(1):173-186.
[6] Madhyastha MN, Shashikumar KC, Rekha PD (2000): Temporary ponds – a neglected ecosystem. Section 6: Limnology, Watershed Hydrology and Monitoring, Lake, 2000
[7] Basavarajappa SH, Raju NS, Hosmani SP, Niranjan SR (2009): Studies on the water quality parameters of four fresh water lakes of Mysore, Karnataka. Indian Journal of Environmental and Eco plan 2009;16(23):413- 418.