Load Forecasting Using LSTM Model
Abstract - This paper represents the application of LongShort Term Memory (LSTM) deep network study that is focused on load forecasting with long-short term memory. The LSTM enables generating a forecast for future loads and the requirement for operating a combination of generators in order to meet electrical demand. To achieve an accurate load forecasting, the load data for each generator is separated and used to train an LSTM model. The objective of the study is to develop an efficient and accurate method of forecasting the load by utilizing data for the past 4 years (i.e. from 2018 to 2021) in LSTM model to predict the future outcomes based on the past time series. Essentially, the final forecast is estimated using numerical code expressions of the peak load data collected in the past 4 years.
Key Words: LSTM Model, Load Forecasting, Generators, Electricity,Timeseries,Coding,Peakloaddata,RNN.
1. INTRODUCTION
Load forecasting has become a necessity in the power industry.Fortheenergyutilitiestomaintainthecontinuity of their services with minimum interruptions, certain measures ought to take place such as outage planning, energy storage management, market supply and demand, powerplantsmaintenanceschedules,andsoon.Allofwhich aredependentonloadforecasting[1].LSTMoffersthetools that could assist the power industry to maintain effective services by forecasting the future demand based on past data. LSTM model is one of the types of Recurrent Neural Networks (RNN) that has shown outstanding results in sequencelearningproblems[2].Thispaperaimstoutilize theLSTMmodeltoforecastloaddemandwiththeuseofpast dataof4consecutiveyears.Itwillfirstdiscussthegathered datafromthedifferentgenerators,thentheirbehaviordue tothevariedload,andlastlythecodingusedforLSTMmodel toachievethedesiredresults.
1.1 The Generators
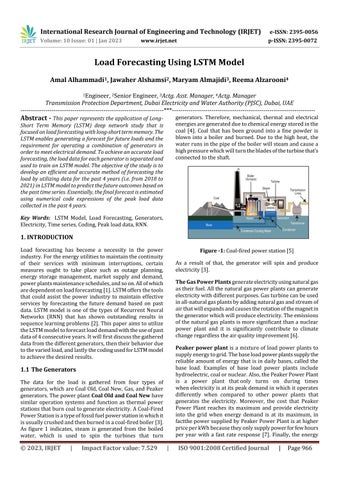
The data for the load is gathered from four types of generators,whichareCoalOld,CoalNew,Gas,andPeaker generators Thepowerplant Coal Old and Coal New have similar operation systems and function as thermal power stationsthatburncoaltogenerateelectricity.ACoal-Fired PowerStationisatypeoffossilfuelpowerstationinwhichit isusuallycrushedandthenburnedinacoal-firedboiler[3] As figure 1 indicates, steam is generated from the boiled water, which is used to spin the turbines that turn
generators. Therefore, mechanical, thermal and electrical energiesaregeneratedduetochemicalenergystoredinthe coal [4]. Coal that has been ground into a fine powder is blown into a boiler and burned. Due to the high heat, the waterrunsinthepipeoftheboilerwillsteamandcausea highpressurewhichwillturnthebladesoftheturbinethat’s connectedtotheshaft.
As a result of that, the generator will spin and produce electricity[3].
The Gas Power Plants generateelectricityusingnaturalgas astheirfuel.Allthenaturalgaspowerplantscangenerate electricitywithdifferentpurposes.Gasturbinecanbeused inall-naturalgasplantsbyaddingnaturalgasandstreamof airthatwillexpandsandcausestherotationofthemagnetin thegeneratorwhichwillproduceelectricity.Theemissions ofthenaturalgasplantsismoresignificantthananuclear power plant and it is significantly contribute to climate changeregardlesstheairqualityimprovement[6].
Peaker power plant is a mixtureofloadpower plants to supplyenergytogrid.Thebaseloadpowerplantssupplythe reliable amountof energythatisin dailybases, calledthe base load. Examples of base load power plants include hydroelectric,coalornuclear.Also,thePeakerPowerPlant is a power plant thatonly turns on during times whenelectricityisatitspeakdemandinwhichitoperates differently when compared to other power plants that generates the electricity Moreover, the cost that Peaker Power Plant reaches its maximum and provide electricity into the grid when energy demand is at its maximum, in factthepowersuppliedbyPeakerPowerPlantisathigher priceperkWhbecausetheyonlysupplypowerforfewhours per year with a fast rate response [7] Finally, the energy

sourceusedforPeakerPlantsisfossilfuel,whichisnatural gas[7].
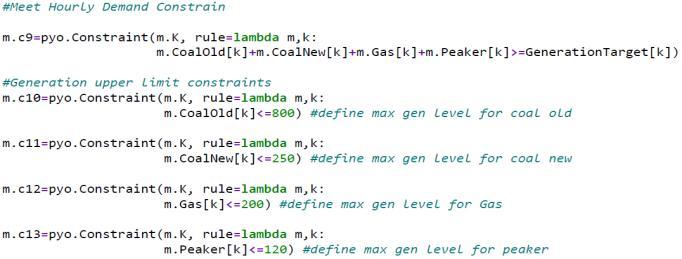
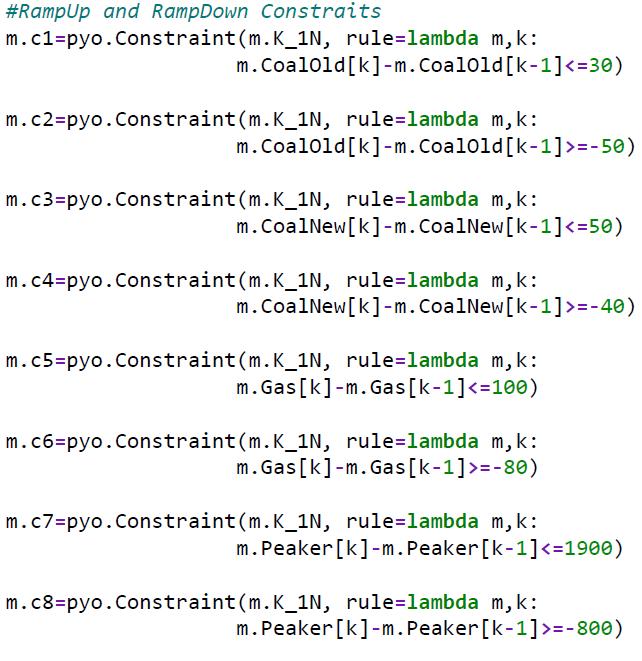
Needless to say, each of the generators have different constraintsassociatedwithit,suchasFuelCost($/MWh), MaintenanceCost($/h),EngineCost($/switch),Minimum andMaximumGenerationLevel(MW),RampUpandRamp Down(MW/h),MinimumUpperandLowerTime(h)arethe constraintsand have beencollected for each power plant. Thedetailsofwhichareshownintable-1.
(2018to2021).Thetotalpowergeneratedversustimewill beimplementedfromtheresultsinpythoncodingprogram.
Table
ThePowerPlantpropertiesareenteredinthepythoncoding programasshowninfigure2.
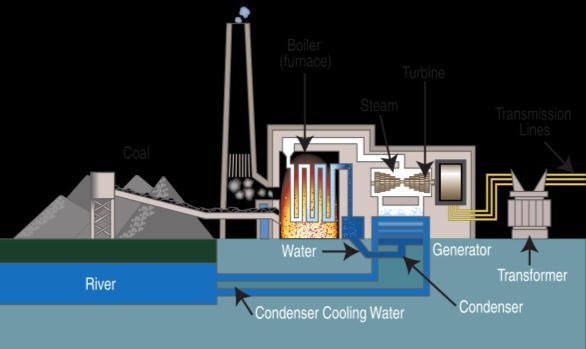
Inordertovisualizethebehaviorofeachpowergenerated foreachplantversustime(inhours),thecodesinfigure3 has been inserted in Python taking in consideration the valuesoftheconstraintsforeachpowerplant
1.2
The data of each of the generators versus time in a week (total of 168 hours) are collected, table 2, and entered in pythoncodesspecificallyperformedforthepastfouryears
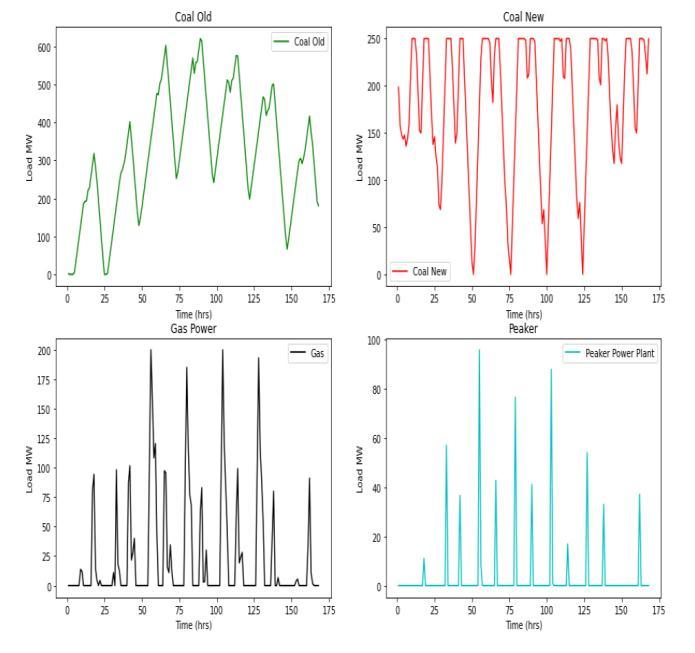
Upon running the codes, Chart 1 shows the results of the maximum and minimum loads, which can be read and compared with maximum and minimum generation level thatistakenfromtable-2ofpowerplantpropertiesforeach powerplantforaweek(168hours).Itisshownthatforall thefourpowerplantsthedemand(load)levelisnearlyclose tothegenerationlevel.Infact,duringweekdayswhichcan be taken as full load condition the peak value for the maximumloadlevelshownincoaloldpowerplantisabout 600MWwithmaximumgenerationlevelof800MWandthe loadisreducedovertheweekendwhichcanbeconsidered less load condition almost 150MW with minimum generationlevelof120MW.
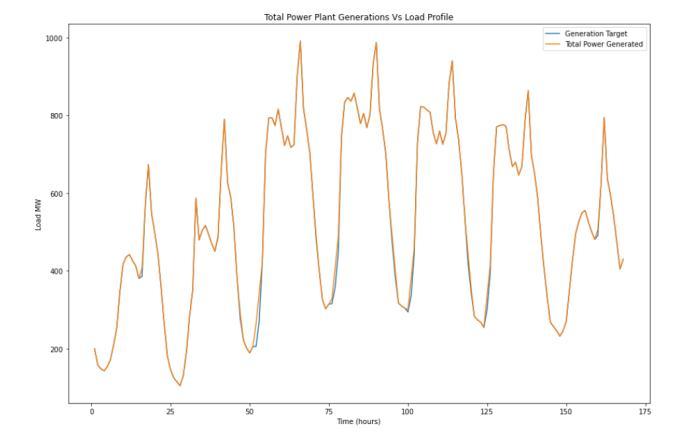
will result in having the desirable behavior as shown in Chart2.
Moreover, in case of coal new the maximum load level is about 250MW with maximum generation level of also 250MW and this can be concluded that these maximum peaksareduetotheutilizingofelectricityduringdayhours more than night time and at working days condition, howevertheminimumloadlevelcanbeviewedfromplotas about 65MW with minimum generation level of 90MW. Finally,inthecaseofGasPowerPlant,themaximumpeaks areshownwithmaximumloadof200MWwith maximum generation level of 200MW and the peaks are getting reducedduringlessloadconditionwhichis30MWasshown fromtheplotand40MWminimumgenerationlevelthatisto less usage of electricity during some parts of the day and withoutworkingdaysorschooldayscondition.Moreover, thesamescenarioappliesforPeakerPowerPlantinwhich duringworkinghoursandweekdaysthemaximumloadit reachesisabout95MWwithmaximumgenerationlevelof 120MWandtheleastloaditreachesisabout7MWinwhich the minimum generation level in this case is 3MW. The maximumgenerationlevelsandthepeaksofthemaximum loadlevelforeachgeneratorarealmostneareachother,also theminimumgenerationlevelvalueisclosetheminimum peaksoftheloadlevel.Finally,astheresultsindicatethatthe generationandtheloadarealmostneareachotherwhich
2. Logic of LSTM model and Outcome
UnlikethetraditionaltypesofNeuralNetworkmodelsthat onlyrelyonpreviousNhistories,LSTMiscapableoflearning long-term dependencies and capable to capture nonlinear patternsintimeseriesdata[8].Hence,itisagreatcandidate topredictsubsequentdemandeveryhalf-hour.
Inthisdesign,LSTMdeepnetworkdevelopedaccordingto thefollowingsteps:
Step1:LoadPythonLibraries
Step2:LoadDataandprepareData
Step3:DesignaNetwork
Step4:TrainaNetwork
Step5:TestaNetwork
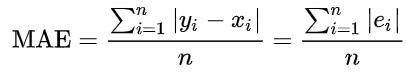
The evaluation of the forecasting model accuracy can be donebymeasuringMeanAbsoluteError(MAE)andMean AbsolutePercentageError(MAPE)[9].
MAE uses the same scale as the data being measured, the mean absolute error is a common measure offorecast errorintimeseriesanalysis,MAEiscalculatedas:
It is the average of the absolute errors ei, where yi is the prediction and xi the true value. Note that alternative formulations may include relative frequencies as weight factors.
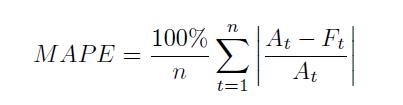
DifferentfromMAE,MAPEmeasurestheerrorproportionto theabsolutevalue,itexpressestheerrorasapercentageand canbecalculatedusingthefollowingequation.
[2] J.M.Jiménez, L.Stokes,C.Moss,Q.YangandV.N. Livina, "Modelling energy demand responseusing longshort-termmemoryneuralnetworks," Energy Efficiency, vol.13,pp.1263-1280,24July2020.
Where n is the total number of forecast values, At and Ft denotetheactualandforecastvalueattime t,respectively.
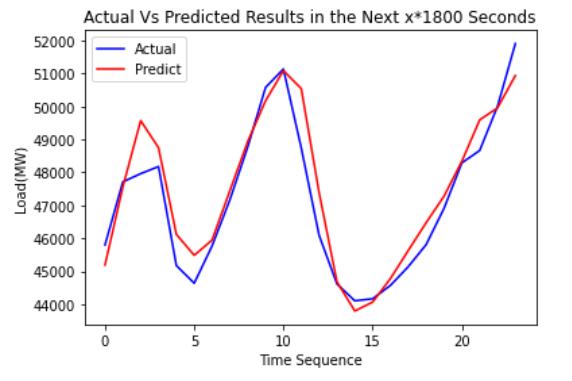
TheMeanAveragePercentageError(MAPE)is5.325which represent the average deviation between the forecasted valueandactualvaluesandtheresultfoundacceptablesince itislessthan10%ofaveragedemand,andMeanAverage Error (MAE) is 631.490 andthe result is accepted since it withinthe±5%oftheaveragedemand.
The obtained graphs in figure 6 shows the actual versus predictedloaddemandnexthalfhour(x*1800second)
[3] H.Bambhaniya,"WhatisCoalPowerPlantandHow Does it Work?," 23 September 2021. [Online]. Available: https://www.engineeringchoice.com/what-is-coalpower-plant/.[Accessed16September2022].
[4] J.P.Ciferno,T.E.Fout,A.P.JonesandJ.T.Murphy, "CapturingCarbonfromExistingCoal-FiredPower Plant," Chemical Engineering Progress, vol.105,no. 4,pp.33-41,April2009.
[5] University of Calgary, "Coal fired power plant," [Online]. Available: https://energyeducation.ca/encyclopedia/Coal_fire d_power_plant#cite_note-8. [Accessed 10 November2022].
[6] University of Calgary, "Natural Gas Power Plant," Energy Education, [Online]. Available: https://energyeducation.ca/encyclopedia/Natural_ gas_power_plant.[Accessed20September2022].
[7] Edgecom Energy Inc., "What is a Peaker Plant," Edgecom Energy, 28 October 2021. [Online]. Available: https://www.edgecomenergy.ca/resources1/whatis-a-peaker-plant.[Accessed21September2022].
[8] H.AbbasimehrandR.Paki,"Improvingtimeseries forecasting using LSTM and attention models," Journal of Ambient Intelligence and Humanized Computing, vol.13,no.1,pp.673-691,2022.
3. CONCLUSION
As a conclusion the objective to develop an efficient and accuratemethodofforecastingtheloadbyutilizingdatafor the past 3 years using LSTM model was achieved through developed model in Python which enabled to predict the futureoutcomesbasedonthepasttime.Moreover,theseries maximumgenerationlevelsandthepeaksofthemaximum loadlevelforeachgeneratorarealmostneareachother,also theminimumgenerationlevelvalueisclosetheminimum peaksoftheloadlevel.Finally,astheresultsindicatethatthe generationandtheloadarealmostneareachother.
REFERENCES
[1] T.CiechulskiandS.Osowski,"HighPrecisionLSTM ModelforShort-TimeLoadForecastinginPower Systems," Energies, vol 14,no.2983,pp 1-15,21 May2021.
[9] C.Tian,J.Ma,C.ZhangandP.Zhan,"ADeepNeural Network Model for Short- Term Load," Energies, vol.11,no.12,pp.1-13,2018.