
International Research Journal of Engineering and Technology (IRJET) e-ISSN: 2395-0056
Volume: 12 Issue: 04 | Apr 2025 www.irjet.net p-ISSN: 2395-0072
International Research Journal of Engineering and Technology (IRJET) e-ISSN: 2395-0056
Volume: 12 Issue: 04 | Apr 2025 www.irjet.net p-ISSN: 2395-0072
Manan Munjal
Tulsi Public School, Ambala City, Haryana, India
Abstract - Thisstudyinvestigatesthecauseofdelaysin arrivingatIndiraGandhiInternationalAirport(DEL)by probingthepossibleconnectionbetweenenvironmental conditions and flight punctuality and contrasting the findings with previous literature on reactionary and infrastructural impacts. The flights were pulled from FlightRadar24andcombinedwithclimaticinformation from timeanddate.com to plot the Hong Kong–Delhi route (HKG–DEL) for 30 days. The study uses logistic regression to determine the effect of environmental conditions, such as wind speed, wind direction, temperature, humidity, and atmospheric pressure, on delay. While the overall models were significant statistically, the individual environmental conditions were not determined to have statistically significant correlations with delays. This contrasts with earlier studies on airport operational performance using methods like Data Envelopment Analysis (DEA) that had determined reactionary delays (e.g., late arrivals and crew issues) and infrastructural bottlenecks as the main cause of delay patterns, explaining up to 76% of the variation in operational performance. Our study illustrates operational and infrastructural factors, as opposed to environmental conditions, to be largely accountable for DEL flight delays. The findings have majorimplicationsforresourceallocationandstrategic planning in air transport operations, such that investment should be channeled into optimizing operational efficiency rather than into environmental forecasting systems.
Key Words: flight delay, operational factors, logistic regression,HKG–DELroute,airportefficiency,reactionary delays
Flight delays are a recurring issue that affect airline performance, passenger satisfaction, and overall airport productivityinbusyairportslikeIndiraGandhiInternational Airport (DEL). Delays in such airports occur through a complex interplay of infrastructural, operational, and physical elements. Environmental factors are most often mentionedaspotentialcausesofflightdelays,buttheirtrue contributions relative to operational factors are not well quantifiedintheliterature.
Recentresearchhasproventhatreactionarycauses,suchas latedeparturesandcrewschedulingissues,aremajorcauses offlightdelays.Forinstance,studiesonairportoperational effectivenessatDELhaveconcludedthatreactionarydelays andgateconstraintcontributetoaround76%ofvariationin operationalperformance.Despitesuchfindingsthatprove the significance of operational causes, there has been a problem with taking into account the potential effect of environmentalcausesonflightpunctuality.
Flightdelaysaredisruptivetoallthepartiesinvolvedinthe airtransportindustry.Airlinesarefaced withroutingand crew scheduling disruptions, which can cause cascading delays across their network. Passengers face increased waitingtimesatairports,whichimpactsatisfactionandcan causeconnectionstobemissed.Groundhandlingpersonnel faceworkloadsastheaircraftarrivalsclusteroutsidetheir planned slot allocations. Limited gate availability causes some aircraft to be located at remote bays, which raises passenger handling complexity and transit times in the airport.
Our aim in this research is to make an empirical investigation into flight delay figures alongside meteorological conditions and identify their individual contributionstothecausationofdelays.WetaketheHKG–DELrouteasthefocusofourstudy,asithasauniformdaily and weekly frequency pattern and explore if variations in meteorologicalvariablescanbestatisticallycorrelatedwith delay events. In comparison with past research on operationalfactors,ourobjectiveistoenhancethecommon understanding of causation of delays, offering meaningful insights into the allocation of resources and strategic managementintheairlineindustry
2.1 Data Collection
Datawascollectedfromtwosources:
1. Flight Data:Real-timeflighttrackinginformation was obtained from FlightRadar24, where arrival, departure,andin-flighttimeswereobtainedforthe HKG–DELflight.Theinformationobtainedwasthe actual arrival times, scheduled arrival times, and delay status, which was defined as arriving 5 minutesormorebehindschedule.
International Research Journal of Engineering and Technology (IRJET) e-ISSN: 2395-0056
Volume: 12 Issue: 04 | Apr 2025 www.irjet.net p-ISSN: 2395-0072
2. Climatic Data: Historical weather data for Delhi was obtained from timeanddate.com. Parameters measured were: a. Wind speed (km/h) b. Wind direction(degrees)c.Temperature(°C)d.Relative humidity(%)e.Atmosphericpressure(mbar)
Environmental information was synchronized with flight arrivaltimesusingthenearestavailabletimeslot(usually2hour intervals) to enable synchronization between flight performanceandcurrentweatherconditions.
The chosen route (Hong Kong to New Delhi) featured a routinewitha fixedschedule fourflightseverydaywith onethrice-weeklyflight toensurearepresentativesample overa30-dayperiod.Asingleroutewasstudiedtominimize variations from external factors such as different airport infrastructure,geographic/environmentalconditions.
This route was chosen specifically for the following advantages:
1. Consistency of geographical path, minimizing variationofen-routeconditions
2. Similarinfrastructureatbothoriginanddestination airports
3. Diversityofairlinesoperatingandaircrafttypes:
o AirIndia(thriceweekly)withBoeing787 Dreamliner
o Vistara(daily)withAirbusA321neo
o IndiGo(daily)withAirbusA321neo
o Cathay Pacific (twice daily) with Boeing 777-300ERandAirbusA350-900
This variety allowed for analysis of both environmental factorsandairline/aircraft-specificperformancedifferences whilemaintainingrouteconsistency.
Table
Characteristic Value
Route HongKong(HKG)toDelhi(DEL)
StudyPeriod 30days
Total Flights
Analysed 62
NumberofAirlines 4(AirIndia,Vistara,IndiGo,CathayPacific) AircraftTypes Boeing 787 Dreamliner, Airbus A321neo, Boeing777-300ER,AirbusA350-900
FlightFrequency 4flightsdaily+1thrice-weeklyflight
Table -2: EnvironmentalVariablesSummary
Table
Inordertoestimatetheeffectofeachofthevariablesonthe probabilityofflightdelay(arrivals5ormoreminutespast theirreportedtime),logisticregressionwasutilized.Logistic regression was the statistical method of choice precisely because it estimates the probability of a dichotomous outcome (delayed/not delayed) as a function of several independentvariables.
Twoprimarymethodswereutilized:
1. Rank-Based: Using arrival time rank as a continuous variable
2. BinaryTimeSlots:Categorizingarrivaltimesintobinary classifications
Independentvariablesincludedinbothmodels:
Windspeed(km/h)
Temperature(°C)
Humidity(%)
Atmosphericpressure(mbar)
Actualflightdistance(km)
Arrivaltimeclassification(eitherrankedorbinary)
Model performance was evaluated using chi-square statistics, p-values, odds ratios, and overall classification accuracy.
Along with primary data analysis, the background was establishedbyreadingpreviousstudies.Literaturebasedon
International Research Journal of Engineering and Technology (IRJET) e-ISSN: 2395-0056
Volume: 12 Issue: 04 | Apr 2025 www.irjet.net p-ISSN: 2395-0072
DataEnvelopmentAnalysis(DEA)providedinformationon theeffectsofexternaloccurrences(e.g.,reactionarydelays) andinternalfunctioningonairportefficiency.Thesestudies providedbenchmarksagainstwhichourfindingsweretobe interpretedandunderstood.
3.1.1
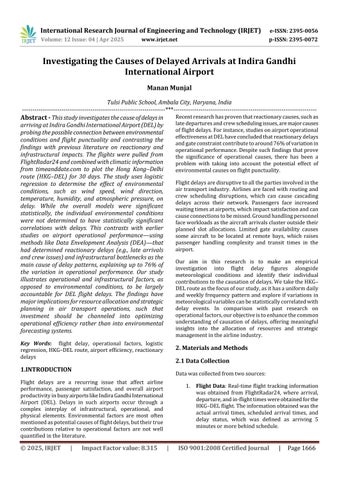
Therank-basedmethodproducedanegativecoefficientfor scheduled arrival time rank (b = -5.72), indicating that certaintimeslotshavesystematicallyhigherdelayoddsthan others.However,thiseffectwasnotstatisticallysignificant (p=0.147).
Thebinary(scheduled)arrivaltimemethodgaveapositive coefficient (b = 22.34) with an extraordinarily high odds ratio (5,047,240,828.87), indicating that flights arriving duringcertaintimeperiodshavesubstantiallyhigheroddsof beingdelayed.Despitethehighoddsratio,thisvariablewas notstatisticallysignificant(p=0.998).
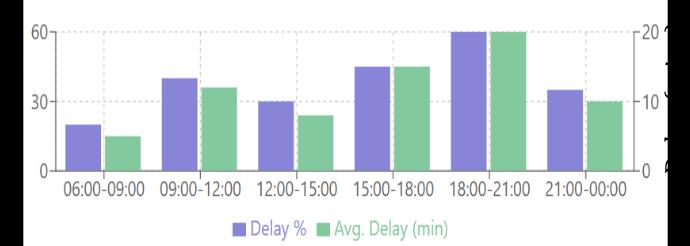
Chart -1:FlightDelayDistributionbyArrivalTime
3.1.2
The coefficients for wind speed were positive across both methods:
Rank-based:b=0.52,oddsratio=1.68,p=0.123
Binary:b=0.16,oddsratio=1.17,p=0.224
Whiletheseresultssuggestthathigherwindspeeds might be associated with increased delay probability, the p-values indicate that these associationsdidnotreachstatisticalsignificance.
Temperature showed a positive association with delayprobabilityintherank-basedmodel(b=0.67, odds ratio = 1.96, p = 0.397), while in the binary model,theeffectwasneutralized(b=0,oddsratio= 1, p = 1.0). Neither result was statistically significant.
Humiditydemonstratedpositivecoefficientsinboth models:
Rank-basedmodel:b=0.67,oddsratio=1.95,p= 0.191
Binarymodel:b=0.07,oddsratio=1.08,p=0.645
Again,theseassociationsfailedtoreachstatistical significance.
Atmosphericpressureshowedpositivecoefficients inbothmodels:
Rank-basedmodel:b=1.46,oddsratio=4.33,p= 0.174
Binarymodel:b=0.34,oddsratio=1.4,p=0.487
Despiterelativelylargeoddsratios,particularlyin therank-basedmodel,theserelationshipswerenot statisticallysignificant.
Actual flight distance showed opposing effects in thetwomodels:
Rank-basedmodel:b=-0.69,oddsratio=0.5,p= 0.34(negativeassociation) Binarymodel:b=0.08,oddsratio=1.08,p=0.662 (positiveassociation)
Thisinconsistencyandthenon-significantp-values suggestthatflightdistancedoesnothaveareliable relationshipwithdelaysinoursample.
Table -4: RankBasedMethodResults
Table -5: LogisticRegressionResults
International Research Journal of Engineering and Technology (IRJET) e-ISSN: 2395-0056
Volume: 12 Issue: 04 | Apr 2025 www.irjet.net p-ISSN: 2395-0072
Table -6: ComparisonofCurrentStudywithPrevious Research
Study Focus KeyFindings Variance Explained
Current Study (2025)
The lack of statistically significant correlations between environmental variables and flight delays contrasts with establishedresearchonoperationalvariables.Reactionary delays and gate delays have a significant effect on airport throughput,accountingfor76%ofoperationalperformance variationatDEL,asperSumangalNarendra'sresearch.This indicatesthatoperationallimitations,andnotenvironmental variables,arethemaincausesofdelaypatterns.
Anotherstudyapplicabletooursettingestimatedeconomic impacts of disruptions by fog at DEL to be roughly $3.9 million in 2011-2016. Despite our research window not fallinginthewinterfogperiodofDelhi,theabsenceofstrong correlations among humidity, temperature, and delay indicatesthatotherweatherdifficultiesotherthanfogcould besmallerthanassumedfortheyear.
The paper "Flight Delay Analysis and Potential Improvements with Big Data" indicated that Delhi airport experienced fewer delays when the number of monthly flights was less than 9,600, and delays rose with growing trafficvolume.Thiscapacity-sensitivepatternsuggeststhat traffic density and operational constraints are more significant predictors of delay than the environmental factorsexaminedinourresearch.
Airport efficiency studies using the Data Envelopment Analysisapproachhavedeterminedtheimpactofexternal shocks on airport performance, thus highlighting the importance of non-environmental determinants in evaluatingoperationalefficiency.
Narendra et al. (2016)
Mohan & Singh (2019)
Vane (2016)
Sood & Bhushan (2004)
Environmental factors (temperature, wind speed, humidity, pressure) on HKG-DELroute
Operational variablesatDEL
Economic impact of fog at DEL
No significant correlation between environmental factors and delays
Reactionary delaysandgate constraints
Estimated $3.9 million in economiclosses (2011-2016) duetofog
Traffic volume atDEL Delays increase when monthly flights exceed 9,600
Airport efficiencyacross India
Externalshocks significantly impact operational efficiency
Limited predictive power
76% of operational performance variation
Notreported
Notreported
Varied by airport
This study suggests that logistic regression models incorporatingenvironmentalandoperationalfactorsshow some promise in predicting flight delays. However, forecastedenvironmentaldatathroughouttheroutemustbe incorporated for these techniques to be of use, and the accuracyofresultswillbeafunctionoftheaccuracyofinput forecasts.Additionally,individualenvironmentalfactors including wind speed, temperature, humidity, and atmosphericpressure donotshowstatisticallysignificant associationswithdelayinstances.
Keyconclusionsinclude:
1. Despite positive coefficients indicating possible relationshipsbetweenenvironmentalvariablesand arrival delays, none of these associations crossed thresholdsofstatisticalsignificance.
2. The contrast between our findings and previous researchhighlightingtheimportanceofoperational factors suggests that reactionary delays, infrastructureconstraints,andtrafficdensityplaya more dominant role in determining flight punctualityratherthanenvironmentalconditions.
International Research Journal of Engineering and Technology (IRJET) e-ISSN: 2395-0056
Volume: 12 Issue: 04 | Apr 2025 www.irjet.net p-ISSN: 2395-0072
3. Theinconsistentandnon-significantresultsacross modelsforvariableslikeflightdistanceandarrival time classification further highlight the complex, multivariatenatureofflightdelays.
4. Thehighoverallpredictiveaccuracyofourmodels despitethelackofsignificantindividualpredictors might suggest that the combination of factors, ratherthananysinglevariable,contributestodelay patterns.Furtherworkonthisfrontiscalledfor
These results have significant strategic and resource planningimplicationsforairtransportoperations.Insteadof investing huge amounts of resources into environmental forecasting tools, airports and airlines would derive more on-timeperformancebenefitsbytheconcentrationofefforts on traffic management schemes, investment in infrastructure,andgainsinoperationalefficiency.
Subsequent research should have a larger sample size, includemoreoperationalvariables,andaccountforseasonal variation to give a better pictureof factors causing delays during the course of the year. Particular consideration of DEL'swinterfogseasonwouldenhancetheresultsofthis research and allow for the quantification of the relative impactofsevereweather events in relationto thenormal day-to-dayoperationalfactorsforcausingflightdelays.
The author acknowledges the data collected from FlightRadar24andtimeanddate.com.Furthermore,findings of previous studies on airport efficiency and flight delay analysis have immensely contributed to this research. Gratitude is also due to Sumangal Narendra and other researchers whose publications on airport operation performance provided background information for interpretingourfindings.
[1] Sumangal Narendra et al., "Airport Operational PerformanceandItsInfluenceonScheduleAdherence:A Data-driven Analysis of Delhi International Airport," JournalofAirportManagement,vol.10,no.4,pp.328342,2016.M.Young,TheTechnicalWriter’sHandbook. MillValley,CA:UniversityScience,1989.
[2] Mohan,R.andSingh,A.K.,"EconomicImpactofFogat Delhi International Airport: Direct and Indirect Cost Analysis,"Atmosphere,vol.10,no.4,article198,2019.K. Elissa,“Titleofpaperifknown,”unpublished.
[3] Rashmi Vane, "Flight Delay Analysis and Possible Enhancements with Big Data," International Research JournalofEngineeringandTechnology(IRJET),vol.3, no.6,pp.1388-1392,2016.
[4] Sood, N. and Bhushan, B., "Dynamic Evaluation of AirportEfficiencyinIndia:ADataEnvelopmentAnalysis Approach," Economics Working Papers, University of Munich,Paperno.0412010,2004.
[5] International Air Transport Association (IATA), "WorldwideSlotGuidelines,"9thEdition,2019.
[6] Federal Aviation Administration, "Weather-Related AviationAccidentStudy2003-2007,"2010.
[7] Kulkarni,R.,"DisruptiveWeatherandItsImpactonAir Traffic: A Comprehensive Review," Journal of Air Transport Management, vol. 78, pp. 69-87, 2019.