18 minute read
Effect of 2019-2020 Currowan Bushfires on the Distribution and Populations of Frog Species


Effect of 2019-2020 Currowan Bushfires on the Distribution and Populations of Frog Species
Darcy Kneeshaw – Ulladulla High School
This paper investigates the impacts of the Currowan bushfires on the distribution and populations of frog species with reference to both intimate localised sites and the entirety of NSW. The hypothesis, being there was an overall decline in species, was disproven by a combination of primary and secondary data. In summary the findings included that all species recordings decreased during the fire period, and many increased after the fire period. These results were concluded to be for numerous reasons, including weather patterns and the environmental destruction caused by the wildfires. The methodology involved using the FrogID app to compare potential species in fire-affected areas and nonfire affected areas across three days. Whilst the secondary investigation was favoured in the conclusion for its validity and involved using the FrogID database to draw relevant data across NSW. The aim was to identify if frog species were impacted by the fires. This area of herpetology is scarcely researched, and it would be highly beneficial for frog conservation and future predications in the light out climate change.
Literature review
Broad information regarding subject
The worlds’ frog population is steadily decreasing, and the development of more effective data gathering is necessary to assist their conservation. In Australia and universally, habitat loss, climate change and pollution are the main causes of declining frog populations, and incidents such as wildfires intensified by climate change, destroy their habitat at a devastating rate. Frogs are important as they play a key role in many food webs, both as predators and as prey. Furthermore because of their intermediate position in food webs, their permeable skin and biphasic lives, frogs are a good ecological indicator of the environmental change (Museum, 2020).
Throughout 2019-2020, NSW saw one of the greatest loss of wildlife in modern history. The Currowan megafire killed or displaced an estimated 1.25 billion animals including: mammals, reptiles, birds and 51 million frogs (Dederer, 2020).
Figure 1. NSW map indicates the extent of the severity of the bushfires on vegetation with accuracy of 15 metres (government, 2022).
Annotation and study of scientific articles
A scholarly article Written by ‘Trends in Ecology and Evolution’ investigates the impacts of the megafire on biodiversity and the environment. According to the article, the total area burnt in Eastern Australia from August 2019 to March 2020 was 12.6 million hectares (see Figure 1), almost the area of England. The article estimated 327 plants and 55 animals (including 5 invertebrates) species were significantly culled. Many of which were already endangered. Among the significantly impacted species, 114 have lost at least half of their habitat and 49 have lost over 80%. The report also explains unlike mammals, recovery for creatures such as amphibians was not automatically a priority for the government. Therefore, leading to a lack of data collection on whether these species have recovered or not (Brendan A.Wintle, 2020). The article guided the reports focus of gathering results with a purpose for conservation and reiterated the ‘neglect’ small creatures often face following natural disasters.
A more specific investigation in 2011, monitored the population of Litoria littlejohni in the Shoalhaven region of NSW. The experiment involved thirteen 250m transects located along vegetational diverse perennial creeks. The creeks were surveyed at night once a year for 30 minutes each from 2001 to 2006. The species was detected at 12 of 13 sites so the population was concluded to be relatively dense. A period of below average rainfall overlapped the census period from 2002 to 2006 and a wildfire in January 2002 burnt 12 of the study sites, leading to a decline in the population detected from 100 to 46. Subsequent surveys found that the population recovered but not to pre-fire environments (Garry Daly, 2011). This investigation informed the prediction of my hypothesis, yet it compares the population of one species, not the distribution of all species.
An article published by the Australian Museum, using the FrogID data draws conclusions to frog species distributions following the Currowan fire detailing both positive and negative impacts. The author explains that there is evidence that many prior threatened species could be pushed to extinction because of the fire. Determining which frog species are the most at risk is challenging due to a lack of available information existing on how frogs respond to fires. The viability of populations through a fire event has several stages, which in aggregate lead to the long-term viability of populations: first is short-term persistence through a fire, the second is successful breeding post-fire, and the third is the survival of the adults and/or juveniles in the postfire environment. Only the short-term recovery was evidenced in the article. Results included a total of 3,387 observations of 69 frog species in the study area (Figure (2a) below).
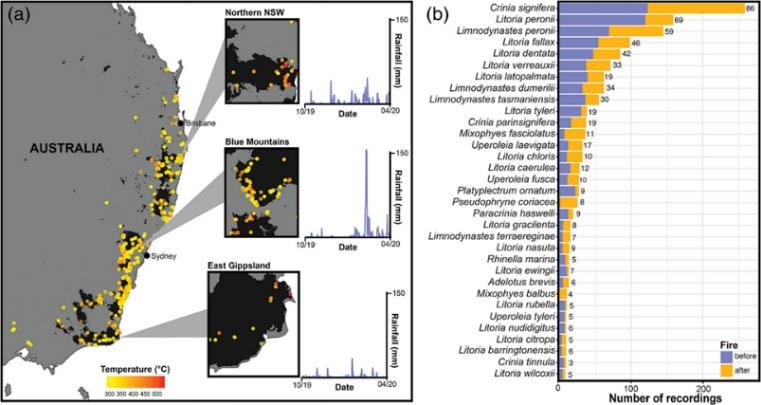
Figure 2. Map of the study area, showing the National Indicative Aggregated Fire Extent Dataset (black), and the temperature of the DEA hotspots with FrogID records (both pre- and postfire)
(Dr Jodi Rowley, 2020).
Of these, 2,655 observations at 1,091 unique locations and 66 species were made pre-fire and 632 observations at 295 unique locations of 45 species were made post-fire. The most frequently postfire recorded frogs were common species, however rare and threatened species were also documented calling post-fire. There were no ‘missing’ species of those that breed during the summer (between December and March). Some of the priority species not detected are restricted to small areas of remote habitats unlikely to be sampled by citizen scientists, while others breed primarily in months other than those sampled postfire. Some frogs were even recorded at sites that continuously burnt at high temperatures (290-530 oC), including Crinia signifera. Seen in Figure 3, the number of days between the fire and frog calling activity varied. Species detected post-fire were taxonomically diverse, meaning there was no clear correlations in the ecological group or lifestyle of species that were detected post-fire. The article also offers explanations to the survival trends of species which include frogs being able to seek refuge from the heat of the fire in waterbodies, underground, or under rocks or logs where the thermal inertia of their surrounding keeps the heat from being lethal. Weeks after the fires the study concluded that
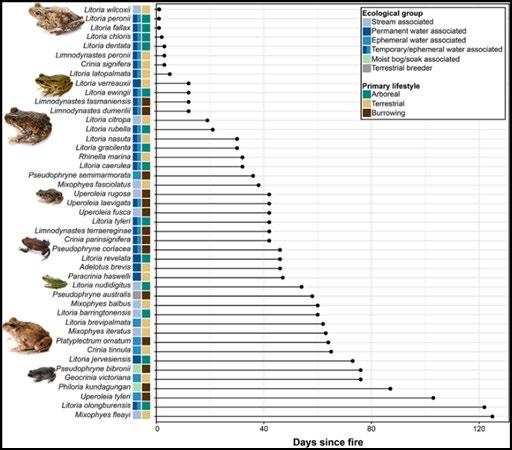
Figure 3. shows the number of days after the fires the frogs began to call again. Common species that will studied below in more detail are among the early calling species
(Dr Jodi Rowley, 2020)
frogs within the fire footprint may have persisted in patches of unburnt habitat of various sizes, which are common, particularly in shelter, wetter microhabitats where fires tend to burn at lower intensity (Rowley, 2020). The method FrogID professionals used in the report is evidence of short-term persistence and attempted breeding activity, but this approach cannot inform estimates of breeding success or recruitment, which is necessary for population dynamics and other areas such as the frog’s environment (e.g., vegetation, water bodies, connectivity). Subtle impacts such as increasing vulnerability to extinction from further effects of the burnt areas are also not immediately evident from the study.
Scientific research question
Has the distribution of frog species stayed the same before and after the 2019-2020 bush fires across NSW? If so, why have specific species had dramatic increases or decreases in distribution.
Scientific hypothesis
Following the Currowan bushfires, the distribution of frog species was negatively affected, resulting in a decline after the fires.
Null hypothesis: There is no difference in the distribution of frog species across coastal NSW since the 2019-2020 Currowan wildfires.
Alternate: There is a difference in the distribution of frog species across coastal NSW since the 2019-2020 Currowan wildfires.
Methodology
Aim
The aim of the primary and secondary data gathering, and subsequent investigation was to determine if there was a difference in the frog species distribution before and after the megafires in 2019-2020. The use of a ‘blended’ application of investigative technologies is used for validity of results and accurate evidenced based conclusions. Both include quantitative and qualitative data.
Note: The results, discussion and conclusions are drawn extensively from the secondary investigation of data.
Primary investigation method:
Three burnt and three non-burnt frog habitats in Conjola and Milton, NSW were identified. Sites contained similar sized dams and habitats. Frog calls were recorded between 6:00pm and 8:30pm for one minute using the FrogID app (Museum, 2017) at each site. Potential frog species were identified on the app by comparing pre-recorded calls and submitted to Sydney Museum for clarification. Data collection was repeated in a random order for three nights in April 2022. The temperature, date, time, weather, and number of potential species were recorded at each site. Recordings were analysed and confirmed by Sydney Museum. As seen in Table 1, the identified species at each location was tabulated and compared.
Secondary data investigation:
All of NSW citizen science frog identification was obtained from the FrogID data (Museum, 2017) from 14th November 2017 to 15th July 2022. This data is considered co-owned due to containing this author’s primary sourced data. The FrogID data is sourced from citizens across Australia sending in their recordings of frog calls (recorded on mobile phone via the FrogID app), which are then identified by experts at the museum and entered in the national frog data base. The NSW data set contained 59,694 results including qualitative and quantitative data on recorder ID, type of water body, longitude/latitude, species name, time, and date of recording. Data was sorted by dates before (10th Nov 2017 – 30th June 2019), during (1st July 2019 – 29th Feb 2020), and after (1st Mar 2020 – 9th Nov 2020) the 2019-2020 NSW megafires. A summary of the data set can be found in the Table 2 in the results. The data was graphed showing number of incidences of each species comparing before, during and after the fires. From these graphs four species were visually selected due to sharp decreases or increases in numbers for closer investigation. Information was gathered on whether the species was a tree or ground frog, breeding periods and other relevant information using the FrogID information website (Museum, 2017). Using longitude and latitude, the four species distributions were mapped
Primary investigation results:
on a NSW map using a mapping program (Maptive, n.d.), comparing the three periods.
Results
The results follow the order of methodology, including primary data collecting and secondary data assortment.
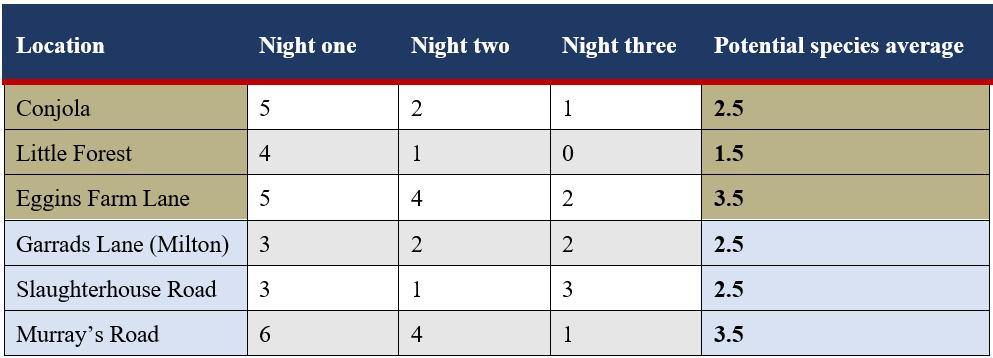
Table 1. Results of the primary investigation. The brown colour indicates fire affectected and the blue colour indicates non-fire affected area. The average number of species in nonburnt species (A=2.8) is higher than burnt areas (A=2.5). This data was limited due to the time of collection not being preferable in that is was before most species breeding season (meaning the calls were scarce).
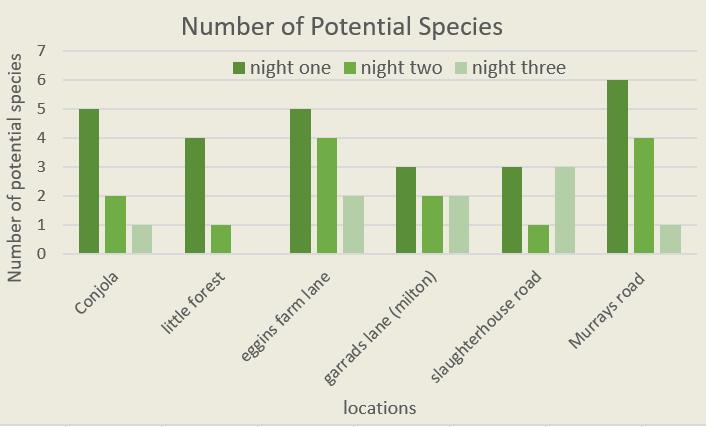
Figure 4. Graphical representation of the primary results without manipulation.

Figure 5. detailed map of local area indicates the extent of the severity of the bushfires on vegetation with accuracy of 15 metres (government, 2022). The pick dots represent the areas that were burnt and blue for unburnt. Each burnt site was ‘very highly’ affected, as seen on the map key.
Secondary investigation results:
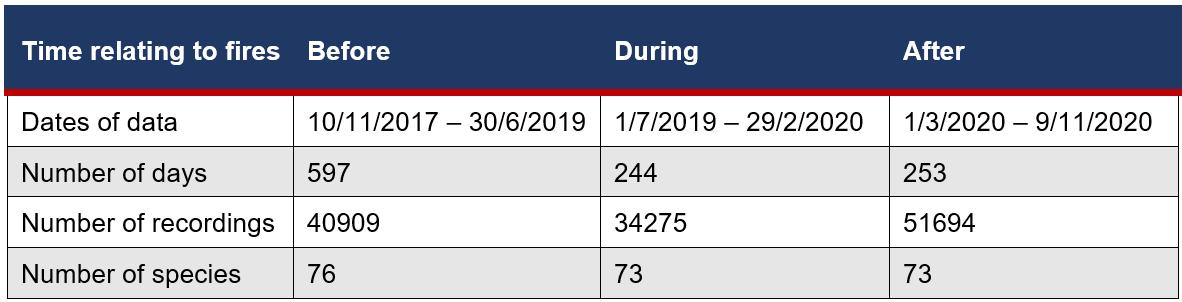
Table 2. The relevant periods in which data was organised. 3 species have not been detected after the fires. The number of recordings is also larger ‘before’ resulting in a possible skew effect of results.
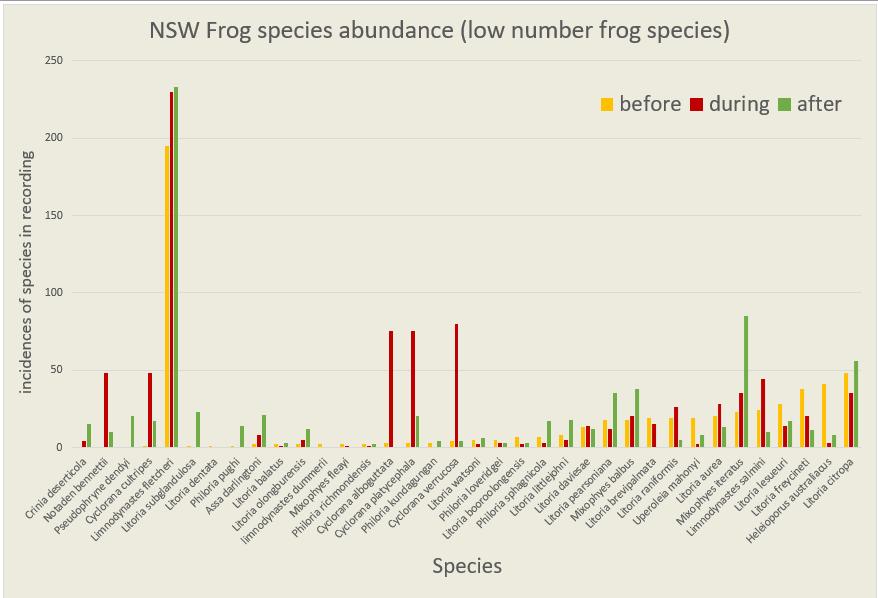
Figure 6. Data of before, during and after the fires of less prevalent species. It can be observed that some species were not recorded calling after the fires, and some species spiked during the fire and most species presence depreciated after the fires.

Figure 7. Data of before, during and after the fires of the species that were slightly more prevalent. Disparate results can be compared Figure 4. For instance, many of the species’ incidences dramatically increased following the fires.

Figure 8. Data of species before, during and after the fires of the species with calls that were commonly recorded. The trends include some species increased before the fires and some decreased. The blue circled species had dramatic increases or decreases in calling. The species will be investigated in depth in the discussion.

Figure 9., 10. and 11. indicate the number of Crinia signifera calls before during and after the fires on a map of coastal NSW. The species has nearly doubled its prevalence after the fires, including fire affected areas. Figure 12. locations where the species

Figures 13 and 14. indicate the location of species Litora ewingii before and after the fires (there is no during due to the species not being calling during this period. Clearly, the species has decreased dramatically, along the coastline, including fire-affected areas. Figure 15. locations of where the species is found
(FrogID, 2018).
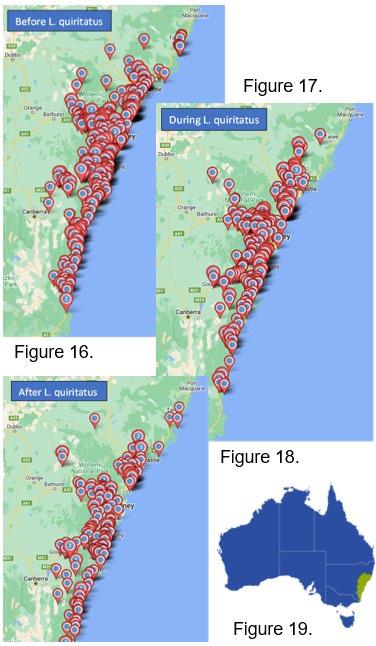
Figures 16., 17. and 18. Indicate the locations species Litora quiritatus which population numbers also declined throughout each time period. Figure 19. indicates where the species is found a small part of NSW which was heavily fire affected
(FrogID, 2018).

Figures 20., 21. and 22. Indicates the locations of species Litoria fallax. It can be observed that the species presence was sparring before the fires and increased both during and after the fires. Figure 23. indicates the location of where the species was found which is predominantly in Queensland but also throughout the fire zone
(FrogID, 2018).
The results show considerably variation in frog population before, during and after the fires. Most frog species are coastal and were therefore within the fire zone (Figure 1). Of the 76 species, 38 species increased in number, 28 species decreased, and 10 species had no notable change before and after the fires. Therefore 50% of the frog species increased in numbers after the fires.
Discussion
Formation of argument/explanation of results
Primary investigation: The results obtained from the primary investigation offered a small level of evidence in favouring the alternate hypothesis. The average number of potential species in non-burnt areas was 0.3>burnt areas. Explanations towards this result could include: a loss of vegetation in fire affected habitats, frog species struggling to rejuvenate, reduction in available insects/food sources. Alternatively, when considering the minor difference in results, explanations for the null hypothesis could potentially include loss of predatory species in fire-affected areas, although this is unlikely to influence the long-term results (as migration of these species occurs in the short term once vegetation begins to rejuvenate), but rather would have an affect on the species ability to recover short-term. Furthermore, there is sufficient evidence collected from FrogID scientists that some species were detected at sites that continuously burnt at a high temperature, meaning many species and possibly their spawn would have been able to evade the fire/heat in moist environments. (Dr Jodi Rowley, 2020).
Secondary investigation: Overall, the occurrences of frog species did not decrease, but rather increased post-fire. Although, during the fire period, the occurrences of some species dramatically declined. These results would infer that species were able to recover long-term and a combination of factors lead to the most species declines amidst the ‘during’ period. This period ranged for 7 months between 2019 and 2020, in which weather conditions were humid and continuous bushfires occurred. An article composed by the Australian Bureau of Meteorology, stated in 2019 “total rainfall for New South Wales was the lowest on record, at 55% below average; well below the previous driest year of 1944” (Meteorology, 2020). It also explains that 2019 was the hottest year on record for NSW, surpassing that of the previous record year in 2018 (Meteorology, 2020). These conditions had tremendous impacts on frog species survival in addition to the Currawong fires. The dry and hot weather forced species to compete for sparring habitat and resources or destroyed (dried up) their habitat altogether. With these presumptions, conclusions can be drawn that species distribution increased throughout the post-fire period (7 months in 2020) predominately due to the contrasting change in weather conditions. The Bureau of Mereology described NSW weather in 2020 as “the coolest and wettest for since 2012” (Meteology, 2021). In attempt to extend the investigation of results, the following species were chosen for their outlying increases or decreases in recording for an in-depth analysis:
Litoria ewingii:
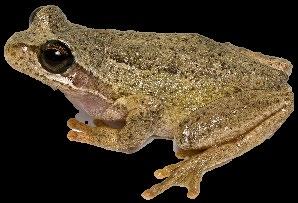
Figure 24
As evidenced in the results, species Litoria ewingii’s (seen in Figure 24) calling dramatically decreased post-fire, from an estimated 3950 to 10s post-fire. The species is more common in South Australia but is still found in NSW fire zone. The species is a hylidae (tree frog), calls throughout the year, has a long breeding season (Jun-Nov). It lays its spawn underneath vegetation in temporary or permanent water bodies (FrogID, 2018). Treefrogs would perish in fires as they are isolated from water bodies and the fires crowned. Eggs in small pools and only protected by vegetation would also be vulnerable to fire. Both situations may have negatively impacted the species.
Litoria quiritatus:
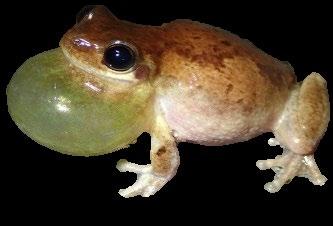
Figure 25
Likewise, species Litoria quiritatus (seen in Figure 25) recordings decreased from an estimated 1000 to 300. The species is located throughout the fire zone along the coastal regions of NSW. Litoria quiritatus is also a hylidae and has a long breeding time (throughout Spring and Summer) although only following heavy rain. The species also lays in water bodies (FrogID, 2018). FrogID scientists collected data which indicated the species continued to call at sights that continuously burnt at a high temperature (290-530 degrees C) (Dr Jodi Rowley, 2020), contrary to these results.
Crinia signifera:
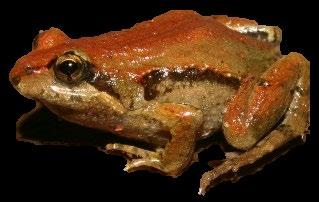
Figure 26
Disparately, species Crinia signifera (seen in Figure 26) recordings dramatically doubled from an estimated 6900 pre-fire to 14400 post-fire. Located throughout most of NSW, heavy throughout the fire zone. The species is a common myobatrachidae (Aus. ground frog), has a long breeding season (FebNov), lays spawn in a variety of water bodies and is very small (3cm max length) (FrogID, 2018). A myobatrachidae species may have found refugee in water bodies in the fires (identified by Dr Rowley, 2020). On inspection of my property, which was severally affected by fires and one of the test sights, unusually large numbers of frogs were observed in the dam a day after the fire had passed (Dr Kneeshaw, personal observations). This species spawns in permanent water bodies which are unlikely to be affected by the fire. Existing tadpoles would therefore be able to repopulate an area.
Litonia fallax:

Figure 27
Likewise, species Litonia fallax (seen in Figure 27) recordings increased dramatically from in the 10s to 4500 postfire. The species is a hylidae, has a short breeding time (Sep-Dec) although is known to breed anytime in the year and lays spawn in permanent water bodies. This frogs adaptation to breed at any time may have given this species an advantage with the post-fire rainfall.
Declines in species could also be attributed to a decline in food availability as insects were not able to escape fires. It could be speculated that increase in some species may be due to a lack of competition, predators and/or adaptive breeding in wetter conditions. C. signifera a ground frog, become sexually mature faster than tree frogs (FrogID, 2018). Female C. signifera can become sexually mature 1 year after metamorphosing (Lauck, 2004). Speed in sexual maturity may have benefited this frog’s recovery and now dominance across NSW. Female tree frogs can take over 3 years to sexually mature (Government, 2021). If adults were lost due to fires, surviving tadpoles in these species may take 3-4 years to recover as breeding populations.
Evaluation of data-analysis
Overall, with access to the secondary data base, more conclusions were able to be drawn. Ultimately both the null and alternate hypothesis was satisfied and sufficiently evidenced using both primary secondary, therefore data-analysis was strong.
Primary data: Benefits and Limitations
Benefits of the primary data-analysis include that all recordings are verified by professionals from FrogID (FrogID, 2018), data was collected 3 times and the data allowing for statistical analysis that somewhat satisfied answering the hypothesis. Limitations included the time of year was not optimal for frog calling, and the data collection process was not repeated throughout the year, leading to decreased validity of analysis.
Secondary data: Benefits and Limitations
The validity and reliably of the FrogID data base provided my investigation with a well evidenced report. Limitations include the numbers of recordings being different in each time period and more members recording more often than others, both resulting in potential skewing of results.
Suggestions for further directions
As established there is not much data or evaluable information regarding the longterm recovery of frog species, and the effects of mega-fires on threatened species, meaning this reports hypothesis or area of interest could potentially provide scientists with authentic conclusions and/or ideas. These ideas can also be used for future fire recovery predictions. The report also attempts to decipher why some common species increased or decreased in numbers, although trends continue to appear vague. Once these conclusions are drawn, scientists can implement mechanisms to support the conservation of species that are declining.
Conclusion
The primary investigation offered the unreliable conclusion that there is a higher number of species in non-fire Currawong affected areas around the local area. Whereas the secondary investigation, which was considerably more reliable, evidenced that the number of species was generally low across all species during the fires, and dramatically increased after the fires. Reasoning behind these results were assessed to be due to contrasting weather conditions (being hot and dry ‘during’ and cold and wet ‘after’). Other subtle impacts included some species taking advantage of the wet weather post-fire resulting in a fluctuation of offspring throughout the whole year, potential loss of predators and disparate environments. Long-term data (3-5 years following fires) may be required to observe if populations to recover as tadpoles laid during the fires become mature.
References
BBCnews, 2020. Australia fires: A visual guide to the bushfire crisis, s.l.: s.n.
Brendan A.Wintle, S. J. C. W., 2020. After the Megafires: What next for Australian Wildlife?. Trends in Ecology and Evolution, p. 11.
Dederer, A., 2020. AUSTRALIA’S 20192020 BUSHFIRES: THE WILDLIFE TOLL, s.l.: s.n.
Dr Jodi Rowley, D. C. C. D. W. C., 2020. Frogs surviving the flames. FrogID, p. 4. FrogID, 2018. Explore Frog Profiles. [Online] Available at: https://www.frogid.net.au/frogs [Accessed 2022].
Garry Daly, P. C., 2011. Monitoring populations of Health Frog Litoria littlejohni in the shoalhaven region on the South Coast of NSW. AGRIS, p. 2.
Government, A., 2021. Species Profile and Threats Database. [Online] Available at: http://www.environment.gov.au/cgibin/sprat/public/publicspecies.pl?taxon_id =25959 [Accessed 2022].
government, N., 2022. Google Earth Engine Burnt Area Map (GEEBAM) [Online] Available at: https://datasets.seed.nsw.gov.au/dataset/ google-earth-engine-burnt-area-mapgeebam [Accessed 2022].
Lauck, B., 2004. Life history of the frog Crinia signifera in Tasmania, Australia. Australian Journal of Zoology, 53(1), pp. 21-27.
Lindenmayor, D., 2001. Use of farm dams as frog habitat in an Australian agricultural landscape: factors affecting species richness and distribution. Biological Conversation, p. 5.
Maptive, n.d. Mapping Software for every Professional. [Online] Available at: https://www.maptive.com/ [Accessed 2022].
Meteology, A. B. o., 2021. New South Wales in autumn 2020: wet and cool [Online] Available at: http://www.bom.gov.au/climate/current/se ason/nsw/archive/202005.summary.shtml #:~:text=Autumn%202020%20in%20New %20South,the%20north%20and%20sout h%20coasts [Accessed 2022].
Meteorology, A. B. o., 2020. New South Wales in 2019: record warm and record dry. [Online] Available at: http://www.bom.gov.au/climate/current/an nual/nsw/archive/2019.summary.shtml [Accessed 2022].
Museum, A., 2017. Australia’s frogs need your help. [Online] Available at: https://www.frogid.net.au/
Museum, A., 2017. Explore frog profiles. [Online] Available at: https://www.frogid.net.au/frogs
Museum, A., 2020. Australia's Native Frogs. [Online] Available at: https://australian.museum/learn/animals/fr ogs/#:~:text=Frogs%20are%20the%20onl y%20remaining,both%20terrestrial%20an d%20aquatic%20environments. [Accessed 2022].
Museum, S., 2017. Explore FrogID records. [Online] Available at: https://www.frogid.net.au/explore [Accessed July 2022].
Rowley, J. R. L., 2020. Widespread shortterm persistence of frog species after the 2019-2020 bushfires in eastern australia revealed by citizen science. FrogID.