16 minute read
Meta-study of the ability of seaweed farms to locally mitigate ocean acidification


Meta-study of the ability of seaweed farms to locally mitigate ocean acidification
Leroy Van Schellebeck – Coffs Harbour Senior College
Abstract
This meta-study tested whether seaweed farms had the ability to locally mitigate ocean acidification using data taken from the report “Seaweed farms provide refugia from ocean acidification”. The report collected data on pH, Ωarag, O2 and CO2 levels in three seaweed farms and control sites outside of the seaweed farms. Out of these variables pH was selected as the best indicator of ocean acidification. It was hypothesised that in all three farms the mean pH will be higher with a significant difference to the control farms. An appropriate statistical test had to be selected to test for a significant different between the mean pH of the seaweed farms and control sites. The statistical test selected was a twosample t-test assuming equal variances with one tail using an alpha value of 5%. All three sites had a P-value lower than 2.225E-308. Similarly, the mean, maximum and minimum pH of the seaweed farms was higher than the control sites, except for Fodu Bays seaweed farms minimum pH, which was 0.01 lower than its control sites minimum pH. The hypothesis that the pH of the seaweed farms should be higher than the control sites was also supported by the mean, maximum and minimum pH levels for each. This resulted in the rejection of the null hypothesis that the pH of the seaweed farms would be lower or equal to the control sites.
Literature review
Ocean acidification
Ocean acidification is the continued decrease of the ocean’s pH due to the sustained increase in atmospheric carbon dioxide, which is absorbed by the oceans
��������2(����) ⇌��������2(��������) (Caldeira & Wickett, 2003). This dissolved carbon dioxide then reacts with water to form carbonic acid
��������2(��������) + ����2����(����) ⇌����2 ��������3(��������) then dissociating to produce hydrogen ions and bicarbonate ions ����2 ��������3 ⇌���� + + �������� ����3 . The increased concentration of hydrogen ions causes a change in pH (Gattuso and Hansson, 2011). This increase in free hydrogen ions shifts the equilibrium of the ocean’s carbonate and
hydrogen ions to form more bicarbonate ions �������� ���� + 3 ⇌���� + ��������2− 3 , resulting in fewer carbonate ions for calcifying organisms to form biogenic calcium carbonate ‘skeletons’, which become susceptible to dissolution (Orr et al., 2005).
Seaweed’s role in pH levels
Macroalgae’s can use photosynthesis, a redox reaction used by photoautotrophs to convert water and carbon dioxide into Trioses (three-carbon sugars) and oxygen using radiant energy from the sun as described by 3��������2�������� +6����2 ����(����) ⟶ ����3 ����6 ����3�������� +6����2 ����(���� ) (Raven et al., 2005; Reece et al., 2012). The decrease in dissolved carbon dioxide shifts the equilibrium, forming less carbonic acid
and more water and dissolved carbon dioxide ����2 ��������3(��������) ⇌��������2(��������) + ����2 ����(����) . The drop in carbonic acid then changes the equilibrium of the dissociation of bicarbonate to form less hydrogen ions and bicarbonate “����2 ��������3 ⇌���� + + �������� ����3 ”. The decline in the concentration of hydrogen ions then increases the pH.
Evidence of macroalgae’s increasing pH
The effect communities of macroalgae’s and other macrophytes like seagrass have on local pH has been described as a way to protect small areas from deceased pH levels (Gattuso et al., 2018; Mongin, Baird, Hadley, & Lenton, 2016). The use of a seaweed farm near the Heron Island reef could buffer the projected rate of ocean acidification, protecting the majority of the reef for 7-21 years (Mongin, Baird, Hadley, & Lenton, 2016). Natural macroalgae and macrophyte communities in slow flow areas such as wave-sheltered bays or the canopies of seaweed/seagrass beds, are expected to give calcifiers a refugia from ocean acidification (Gattuso et al., 2018).
Conclusion
Ocean acidification has a range of negative effects on marine ecosystems, primarily effecting calcifying organisms (Kroeker et al., 2011). Photosynthetic organisms such as seaweeds increase pH as a by-product of photosynthesis which removes dissolved carbon dioxide from the water. Communities of macrophytes such as seaweeds can locally counter the effects of ocean acidification (Gattuso et al., 2018). Seaweed farms can then be used to mitigate ocean acidification and protect marine habitats (Mongin, Baird, Hadley, & Lenton, 2016).
Scientific research question
Are seaweed farms able to locally mitigate the effects of ocean acidification?
Scientific hypothesis
Hypothesis: The three farms studied will have a mean pH higher than the control site with a significant difference at an alpha value of 5%.
H1: μFarm > μControl, α=0.05 ∴ P≤0.05
Null Hypothesis: The three farms studied will not have a mean pH higher than the control site with no significant difference at an alpha value of 5%.
H_0: μ_Farm ≤ μ_Control, α=0.05 ∴ P>0.05
Methodology
Using google scholar a suitable report to conduct a meta study on was searched for. The report “Seaweed farms provide refugia from ocean acidification” was a relevant, reliable credible and valid report. The report aimed to determine if seaweed farms provided refugia from ocean acidification. They used three different seaweed farms with control sites located at Nan’ao bay, Lidao Island and Fodu Bay (Fig. 1). Sensors were used to record data and water samples were taken at both the seaweed farms and the control sites outside of the farms. The report was chosen because it provided a range of data for the following dependent variables related to ocean acidification: pH, Ωarag, O2 and CO2. The report also recorded the position of the farm to the current and current direction, average current speed (cm s 1), tide type in the region, with maximum tide range, average tidal range, average flood & ebb tide duration, seawater quality (class (Inorganic Nitrogen (mg L 1) and Orthophosphate (mg L 1), dates of on-site monitoring and dates of the harvest season, salinity range (‰) and sea surface temperature range (°C). Measurements for positions of monitoring sensors and steps taken to calibrate and deploy, distance from control site and method for the titration of the water samples were also included. As the report effectively accessed all relevant variables that they could not control and collected a wide range of relevant data it was selected to be used for the meta study. The reports recent publication date of 2021 and the authors high credibility furthered the report appeal to be selected for the meta study.
Figure 1. A map of the location of the three sites data is sourced from report ‘Seaweed farms provide refugia from ocean acidification’.
(Xiao et al., 2021)
To keep the report simple and only test one relationship in the hypothesis only one dependent variable could be used. The best indicator of ocean acidification is pH level, so only the difference between the pH of the seaweed farm and control site was tested.
As the data used was normally distributed with a need to test for a significant difference; a t-test or ANOVA test could be used. As only two data sets where being tested for a difference, a t-test was chosen. Some of the data from the control site or seaweed farm had brief gaps for all sites, so a paired sample for two means t-test could not be used as it relied on the count for both sets being equal. The variance for the seaweed farm and control sites pH was calculated to determine whether a two-sample t-test assuming equal variance or unequal variance should be applied. For each site the variance of the seaweed farm was divided by the variance of the control site to give a variance ratio. As the variance
ratio for each site was less than four a two-sample t-test assuming equal variance was chosen as the appropriate ttest. As we were testing if the seaweed farm’s pH was not only significantly different to the control sites pH but also higher the directional one tailed t-test was selected. This meant the statistical test applied to each site was the two-sample t-test assuming equal variances with one tail. The standard alpha value of 5% or α=0.05 was used.
Results
Nan’ao Island
The seaweed farm at Nan’ao Island had a mean pH of 8.15, 0.03 higher than the control sites 8.12 (Fig. 8). The seaweed farms minimum pH of 8.04 was 0.02 higher than the control sites 8.02 (Fig. 8). The maximum pH of 8.31 for the seaweed farm was 0.1 higher than the control sites 8.21 (Fig. 8).
The two-sample t-test assuming equal variances with one tail gave a P-value of less than 2.225E-308, which was lower than the alpha value of 0.05 (Fig. 8). Equal variance is assumed as the variance ratio between the seaweed farm and control site is 1.5, less than the variance ratio of 4 needed for unequal variance to be assumed (Appendix 1).
The seaweed farm has a consistently higher pH with a significant difference between the control site (Fig. 2 and 3).
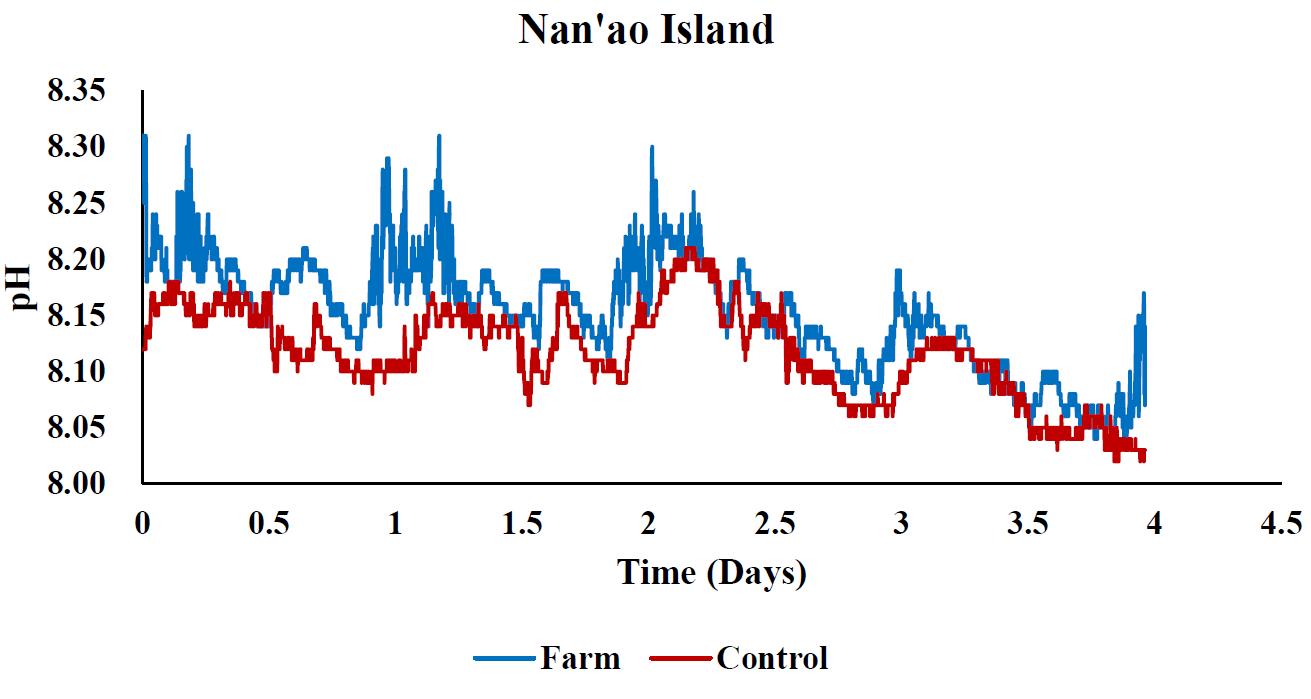
Figure 2. Line graph of the pH of the seaweed farm and control site at Nan’ao Island over four days from 11:00am on the 10th of May 2017 to 10:50am on the 15th of May 2017. I created the graph in excel using data is sourced from report ‘Seaweed farms provide refugia from ocean acidification’
(Xiao et al., 2021), see appendix for full data set.

Figure 3. Line graph of the moving average every 25 minutes of the pH of the seaweed farm and control site at Nan’ao Island over four days from 11:00am on the 10th of May 2017 to 10:50am on the 15th of May 2017. I created the graph in excel using data is sourced from report ‘Seaweed farms provide refugia from ocean acidification’.
(Xiao et al., 2021), see appendix for full data set.
Lidao Bay
The seaweed farm at Lidao Bay had a mean pH of 8.12, 0.1 higher than the control sites 8.02 (Fig. 8). The seaweed farms minimum pH of 8.00 was 0.09 higher than the control sites 7.91 (Fig. 8). The maximum pH of 8.18 for the seaweed farm was 0.06 higher than the control sites 8.12 (Fig. 8).
The two-sample t-test assuming equal variances with one tail gave a P-value of less than 2.225E-308, which was lower than the alpha value of 0.05 (Fig. 8). Equal variance is assumed as the variance ratio between the seaweed farm and control site is 3.9, less than the variance ratio of 4 needed for unequal variance to be assumed (Appendix 2).
The seaweed farm has a consistently higher pH with a significant difference between the control site (Fig. 4 and 5).
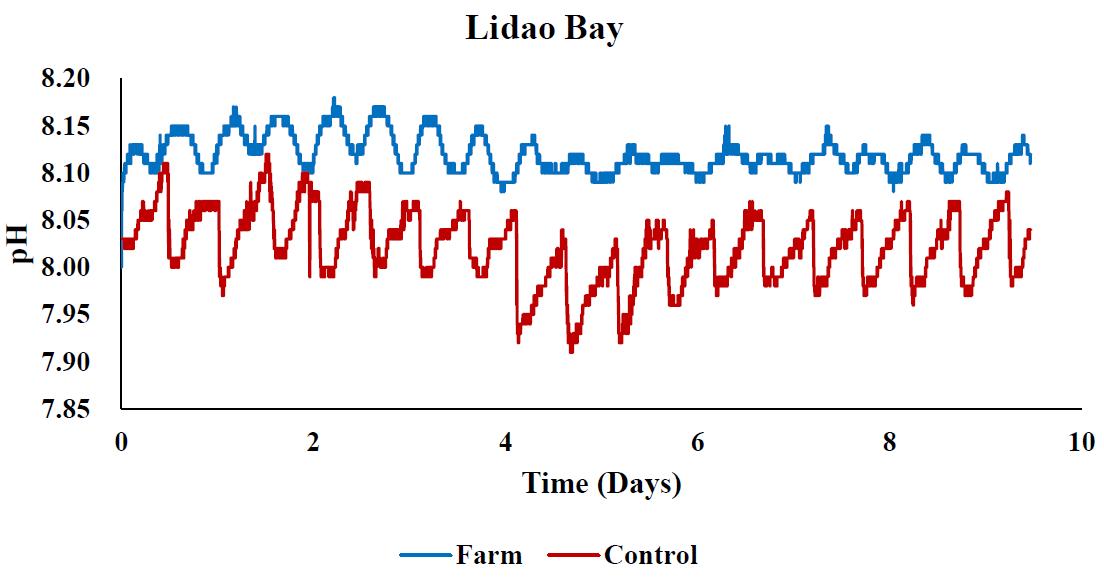
Figure 4. Line graph of the pH of the seaweed farm and control site at Lidao Bay over nine days from 6:11am on the 3rd of June 2017 to 5:30pm on the 12th of June 2017. I created the graph in excel using data is sourced from report ‘Seaweed farms provide refugia from ocean acidification’
(Xiao et al., 2021), see appendix for full data set.

Figure 5. Line graph of the moving average every 25 minutes of the pH of the seaweed farm and control site at Lidao Bay over nine days from 6:11am on the 3rd of June 2017 to 5:30pm on the 12th of June 2017. I created the graph in excel using data is sourced from report ‘Seaweed farms provide refugia from ocean acidification’
(Xiao et al., 2021), see appendix for full data set.
Fodu Island
The seaweed farm at Fodu Island had a mean pH of 8.05, 0.02 higher than the control sites 8.02 (Fig. 8). The seaweed farms minimum pH of 7.97 was 0.01 lower than the control sites 7.98 (Fig. 8). The maximum pH of 8.11 for the seaweed farm was 0.03 higher than the control sites 8.08 (Fig. 8).
The two-sample t-test assuming equal variances with one tail gave a P-value of less than 2.225E-308, which was lower than the alpha value of 0.05 (Fig. 8). Equal variance is assumed as the variance ratio between the seaweed farm and control site is 3.2, less than the variance ratio of 4 needed for unequal variance to be assumed (Appendix 3).
The seaweed farm has a consistently higher pH with a significant difference between the control site (Fig. 6 and 7).
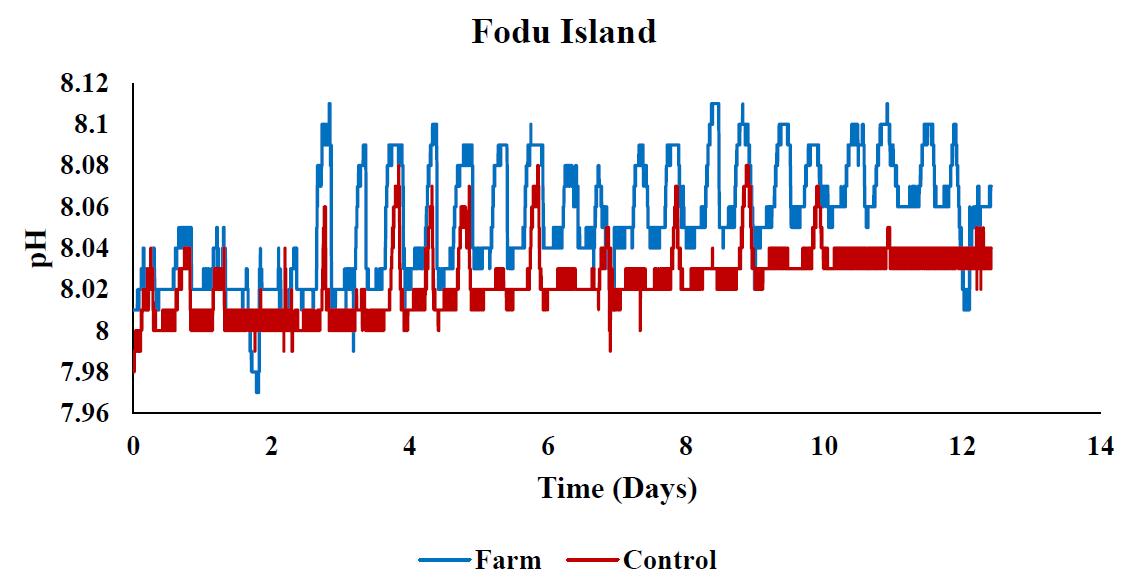
Figure 6. Line graph of the pH of the seaweed farm and control site at Fodu Island over twelve days from 8:53am on the 15th of November 2017 to 7:35pm on the 27th of November 2017. I created the graph in excel using data is sourced from report ‘Seaweed farms provide refugia from ocean acidification’
(Xiao et al., 2021), see appendix for full data set.

Figure 7. Line graph of the moving average every 25 minutes of the pH of the seaweed farm and control site at Fodu Island over twelve days from 8:53am on the 15th of November 2017 to 7:35pm on the 27th of November 2017. I created the graph in excel using data is sourced from report ‘Seaweed farms provide refugia from ocean acidification’
(Xiao et al., 2021), see appendix for full data set.
The two-sample t-test assuming equal variances with one tail which was applied to each site gave a P-value of less than <2.225E-308 (Fig. 8). This value was lower than the alpha value of 0.05. Equal variance is assumed as the variance ratio between each seaweed farm and control site was less than the variance ratio of 4 needed for unequal variance to be assumed (Appendix 1-3).
Each sites seaweed farms mean pH was higher than the control sites mean pH (Fig. 8). Nan’ao Islands seaweed farm had the highest mean pH of 8.15 but had the second smallest difference in mean pH between the seaweed farm and control site of only 0.03 (Fig. 8). Lidao Bays seaweed farm had the second highest mean pH of 8.12 and the largest difference in pH of 0.10 (Fig. 8). Fodu Bay had the lowest mean pH of 8.05 and the smallest difference of only 0.02 (Fig. 8).
The Nan’ao Islands seaweed farms minimum pH was 8.04 only 0.02 higher than the control sites minimum pH of 8.02 (Fig. 8). The Lidao Islands seaweed farms had a much higher minimum pH than its control site at 8.00, 0.09 higher than the control sites minimum pH of 7.91 (Fig. 8). Fodu Bay had a minimum pH of 7.97, 0.01 lower than the control sites minimum pH of 7.98 (Fig. 8).
At each site the seaweed farms mean, maximum and minimum pH was higher than the control sites apart from Fodu Bays minimum pH, which was 0.01 lower than its control sites minimum pH ((Fig. 8).
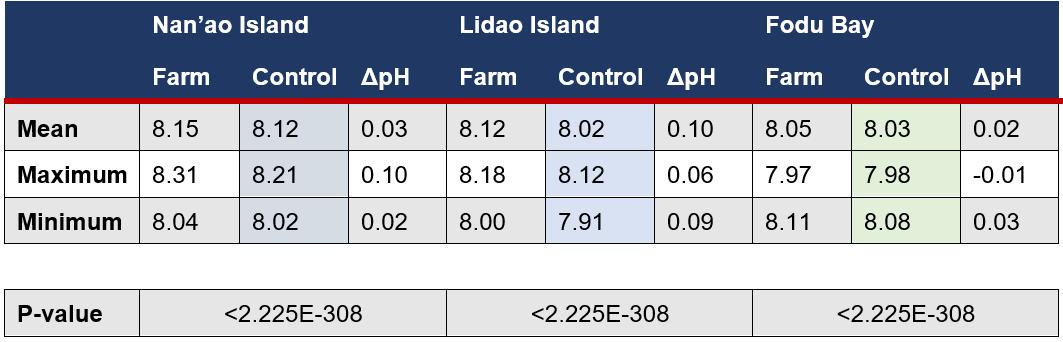
Figure 8. A table of the mean, maximum and minimum pH for the seaweed farm and control sites as well as the difference in pH for each; along with the P-values from a two-sample ttest assuming equal variances with one tail for each site. Data is sourced from report ‘Seaweed farms provide refugia from ocean acidification’
(Xiao et al., 2021), see appendix for full data set.
Discussion
A future meta study on the same data could use different variables to access the relationship between seaweed farms and surrounding waters and test the other variable that are related to ocean acidification like Ωarag and dissolved CO2. Different software should also be considered as excel did not have the precision to calculate numbers lower than 2.225E-308 resulting P-values of zero being presented. The high count of the data set made P-value very small, giving a very high significant difference. The graphs of each data set along with the means, maximums and minimums appear to support the hypothesis that the pH of the seaweed farm should be higher than the control site.
Despite the large amount of data collected by the original study monitoring only occurred for between four to twelve days varying for each site. Data was collected at different times of the year with different sized farms, along with a different species of seaweed being grown at each farm. This means it is hard to draw conclusions for what causes the difference in pH levels between the different seaweed farms. This variety on time, position, species, and sizes does mean that conclusions for the effects of seaweed farming in general are more valid as the conditions are more diverse across the three data sets. The validity makes for better general conclusions about how seaweed farms affect pH.
However, for the same reason any quantitative predictions for future studies on exactly how much a seaweed farm will affect pH cannot be extrapolated from this data. As a result, future studies would have to be completed to determine how best to use seaweed farms to locally ameliorate ocean acidification. These studies could extrapolate the rate of ocean acidification from predications of emissions scenarios based off other reports e.g., ‘Climate Change 2021: The Physical Science Basis’ (IPCC, 2021).
This provides a wide range for future studies that could access where and how seaweed farms would be most effective. Studies could simply determine the locations worst affected by ocean acidification, highlighting the areas in the most need of seaweed farms. More indepth studies could also be undertaken to determine the best way a seaweed farm could reduce ocean acidification. This would involve modelling and testing the movement of water, different sizes of farms and species used to create optimum conditions to reduce ocean acidification. These studies could use multiple farms of the same species at different sizes or vice versa to achieve this. This could also be achieved using (name for tanks that ocean science experiments are run in) that would allow for a wide range of conditions to be tested, as well as future conditions such as lowered pH and warmer waters. This method would be able to effectively compare different species as all variables such as light, salinity water temp and water flow could be controlled.
Variation on the study accessed could also be undertaken. Measuring the effect on pH over the course of a year would help provide more concrete evidence for the positive long-term effects on local waters seaweed farms could have. Using multiple control sites for each farm at varying distances and positions relative to current and tidal flows would let the affects farms had on a larger area be accessed.
Conclusion
Each sites seaweeds farms mean, maximum and minimum pH was higher than the control sites, except for Fodu Bays minimum pH, which was 0.01 lower than its control sites minimum pH. The trends in (Fig. 2-7) displayed a generally higher pH of the seaweed farm over the control site. Each site had a P-value lower than 2.225E-308 due to limitations with excel more precise values could not be calculated. This gave all three farms a significant difference at an alpha value of 5% as the P-value was lower than 0.05 for all three. As the P-value was lower than the alpha value the null hypothesis was rejected as three farms studied did not have a mean pH lower than or equal to their control sites with no significant difference at an alpha value of 5%.
Reference list
Caldeira, K., & Wickett, M. E. (2003). Anthropogenic carbon and ocean ph. Nature, 425(6956), 365-365. doi:10.1038/425365a
Gattuso, J., & Hansson, L. (2011). Acidification: Background and history. Ocean Acidification. doi:10.1093/oso/9780199591091.003.000 6
Gattuso, J., Magnan, A. K., Bopp, L., Cheung, W. W., Duarte, C. M., Hinkel, J., . . . Rau, G. H. (2018). Ocean solutions to address climate change and its effects on marine ecosystems. Frontiers in Marine Science, 5. doi:10.3389/fmars.2018.00337
Kroeker, K. J., Micheli, F., Gambi, M. C., & Martz, T. R. (2011). Divergent ecosystem responses within a benthic marine community to ocean acidification. Proceedings of the National Academy of Sciences, 108(35), 14515-14520. doi:10.1073/pnas.1107789108
Masson-Delmotte, V., P. Zhai, A. Pirani, S.L. Connors, C. Péan, S. Berger, N. Caud, Y. Chen, L. Goldfarb, M.I. Gomis, M. Huang, K. Leitzell, E. Lonnoy, J.B.R. Matthews, T.K. Maycock, T. Waterfield, O. Yelekçi, R. Yu, and B. Zhou. (2021). IPCC, 2021: Climate Change 2021: The Physical Science Basis. Contribution of Working Group I to the Sixth Assessment Report of the Intergovernmental Panel on Climate Change. Cambridge University Press, Cambridge, United Kingdom and New York, NY, USA, In press, doi:10.1017/9781009157896.
Mongin, M., Baird, M. E., Hadley, S., & Lenton, A. (2016). Optimising reefscale co 2 removal by seaweed to buffer ocean acidification. Environmental Research Letters, 11(3), 034023. doi:10.1088/1748-9326/11/3/034023
Orr, J. C., Fabry, V. J., Aumont, O., Bopp, L., Doney, S. C., Feely, R. A., . . . Yool, A. (2005). Anthropogenic ocean acidification over the twenty-first century and its impact on calcifying organisms. Nature, 437(7059), 681-686. doi:10.1038/nature04095
Raven, PH, Evert, RF & Eichhorn, SE 2005, Biology of Plants, 6th edn, W.H. Freeman & Company, New York.
Reece, JB, Taylor, MR, Simon, EJ & Dickey, JL 2012, Campbell Biology: Concepts and Connections, 7th edn, Benjamin Cummings Publisher, San Francisco.
Xiao, X., Agustí, S., Yu, Y., Huang, Y., Chen, W., Hu, J., . . . Duarte, C. M. (2021). Seaweed farms provide refugia from ocean acidification. Science of The Total Environment, 776, 145192. doi:10.1016/j.scitotenv.2021.145192