22 minute read
Plant Power vs the Water World: An Insight into the Detoxifying Properties of Typha Orientalis in Polluted Water.


Plant Power vs the Water World: An Insight into the Detoxifying Properties of Typha Orientalis in Polluted Water.
Elena Mbeya – Menai High School
Abstract
This investigation explored the detoxifying and filtrating properties of Typha Orientalis, a wetland plant, in the removal of Copper (II) Sulfate and Cooking Oil in water – to simulate pollutants found in Sydney Harbour. As per data provided by Gavin Birch and the School of Geosciences at the University of Sydney. This experiment, carried out over the course of 43 days (29/06/2022 – 11/08/2022), provided quantitative and qualitative data to support the application of Typha Orientalis in the filtration of polluted water in the real world, ultimately to reach a safe level of contaminants fit for consumption as deemed by World Health Organisation. Although a communication error was encountered with the exact measurements of Copper (II) Sulfate and Cooking Oil, the results showed an average 68.75% decrease of Cooking Oil in a 100mL sample, measured through sedimentation, and an average 15.57% increase in ‘B’ on the RGB scale in 10mL samples, measured through copper test strips and a colour identification app ‘What Colour Is this’, by Nicholas Troia, indicating a 15.57% decrease in Copper (II) Sulfate, supported through data analysis. The descriptive statistics from each sample yielded a Pvalue<0.0001, resulting in >99.99% statistical significance in the difference in data sets, rejecting the null hypothesis and accepting the alternate hypothesis with strong statistical evidence.
Literature Review
Water pollution has become one of our planet’s greatest environmental problems, leading to things such as coral bleaching and ocean warming. (Do, W., & Jamerson, M., 2021). Ingesting contaminated water can lead to diseases such as cholera, dysentery, typhoid, and polio which in most cases lead to death. 850 million people globally don’t have access to clean drinking water, and this subsequently kills one person every 10 seconds. (Cassoobhoy, A. 2020). Due to the inconsistent data surrounding the treatment of wastewater, there was a need to investigate this issue, driven by social and environmental needs.
Scientists at the College of Forestry, Beijing Forestry University, have extensively researched the capacity of aquatic plants to absorb heavy metals in polluted water. Their analysis aided in identifying the selection of aquatic plants that are suitable for heavy metal absorption from real life polluted waters. They provided quantitative data supporting plants from the Gramineae, Pontederiaceae, Ceratophyllaceae, Typhaceae and Haloragaceae and their relatively strong abilities to absorb these metals. However, the absorption abilities varied with the plant organ, with the following trend: roots > stems > leaves, establishing a hierarchy within this set group of plants, meaning the plants that absorb nutrients/water through their roots would be more effective in the detoxification and filtration of polluted water. (Li, J., Yu, H., & Luan, Y., 2015). This selection reduced the large array of aquatic plants that could be used in this investigation, refining the research, but lacked information on specific plants, within the families, that were the most effective.
After a review of aquatic plants that are easily sourced, non-invasive and fit within the 5 families outlined above, bulrushes were the most appropriate (Gardening With Angus Bringing You the Best In Australian Plants And Gardening, n.d.). In an interview conducted by (Sahtouris, E, 1990), Kathe Siedel outlines how she collated different sets of data collected by different scientists and combined them to create one meta-analysis that addressed all areas in bulrushes capabilities, investigating the phenomenon in a realworld environment, meaning there was minimal control over different variables but showed the extent of the plants capabilities in harsh environments, much like the Scientists at the College of Forestry, Beijing Forestry University. Although she highlights that bulrushes can work all year round (Sahtouris, E,. 1990), in winter the bulrushes prepare to partially die off before producing new life in spring, going dormant (Gardening With Angus Bringing You the Best In Australian Plants And Gardening, n.d.), the extent of Kathe Seidel’s investigation had identified that dead or even harvested bulrushes would still provide sufficient filtration as long as the roots are alive (Sahtouris, E, 1990).
Specific quantitative data regarding the contents of pollutes bodies of water such as Sydney Harbour, Australia, and The River Ganga India, has minimal public access except for studies conducted by (Birch, G., McCready, S., Long, E., Taylor, S., & Spyrakis, G., 2008) and (Khatun, H., & Jamal, D. A, 2018).

Figure 1: Sydney Harbour. Summary of sediment chemical data for the most prevalent chemicals in 4 classes
(Birch, G., McCready, S., Long, E., Taylor, S., & Spyrakis, G., 2008)
Polycyclic aromatic hydrocarbons (PAH) are a group of naturally occurring pollutants typically found in the environment together in a mixture, are also found as the main component of coal tar, crude oil, and fossil fuels. (Birch, G., McCready, S., Long, E., Taylor, S., & Spyrakis, G., 2008). Long-term health effects of exposure to PAH’s may include cataracts, kidney and liver damage, and jaundice. Repeated skin contact PAH’s can result in redness and inflammation of the skin. Breathing or swallowing large amounts of naphthalene can cause the breakdown of red blood cells, therefore the presence of it in drinking water is detrimental for community health, especially as oil is extremely difficult to remove from bodies of water (Illinois Department of Public Health, n.d.)
Table 2: Concentrations of heavy metals (µgL-1) in the river Ganga water at different study sites.

Figure 2: Concentrations of heavy metals (μg g−1) in the river Ganga sediment at different study sites.
(Li, J., Yu, H., & Luan, Y., 2015).
The research article by Dr. Arshad Jamal and Hasnahara Khatun, recorded quantitative data from samples taken from The River Ganga, specifically focussing on heavy metals that are directly correlated with health concerns related to consumption of pollutants. The article doesn’t provide any new information but instead collates and verifies all relevant data, through repetition of past experiments, in the one article. This was then compared to World Health Organisation’s (WHO) permissible drinking limit to bring awareness to the heavy metal pollution in The River Ganga. (Li, J., Yu, H., & Luan, Y , 2015).
Table 1: Permissible limits of heavy metals in drinking water [63]

Figure 3: Permissible limit of heavy metals in drinking wate as outlined by World Health Organisation (WHO) (Li, J., Yu, H., & Luan, Y., 2015).
WHO: World Health Organisation, USEPA: United States Environmental Protections Agency, ISI: Indian Standard Institution, ICMR: Indian Council of Medical Research, CPCB: Central Pollution Control Board
Scientific Research Question
To what extent can the detoxifying and filtrating properties of Typha Orientalis influence the contents of Copper (II) Sulfate and Cooking Oil in 10L of water.
Hypothesis
It is Hypothesised that the filtrating and detoxifying properties of Typha Orientalis reduces the amount Copper (II) Sulfate and Cooking oil in water. Supported by the research conducted by Kathe Seidel, the Typha Orientalis’ absorption of the mixture through its roots will result in a reduction in Cooking Oil and Copper (II) Sulfate (Sahtouris, E, 1990).
Methodology
Materials
• 10x test tubes
• Test tube rack
• Copper testing kit
• Ruler
• 41.6 g of cooking oil
• 23.8 g of Copper (II) Sulfate
• 5L of Horticultural sand
• Latex gloves
• Face mask
• Scientific goggles
• 20L of water
• 2 air pumps
• Extension cord
• 8 bulrushes
• 2 buckets
• Small scales (g)
• Large scales (g)
• Petri dish
• Lab spatula and spoon
• 5L measuring cylinder
• 2 x 400mL beaker
• 100mL measuring cylinder
• 10mL measuring cylinder
All measuring equipment used was selected in proportion to the sample size needed to gain enough qualitative information for analysis.
Preparations
The room that was allocated by Peter Reeve and Brett McKay, was within a scientific lab, disturbed by students throughout the day.
Each bucket was placed on the large (kg) scales (tared) to measure 10kg of tap water (10L). Once equipped with face mask, scientific goggles and latex gloves, as per risk prevention methods [Appendix A, B], equal parts (2.5L or 2.5kg) of the horticultural sand was poured into each bucket, to simulate the environment and conditions needed for the bulrushes to grow. Then the bulrushes roots were buried into the sediment and the buckets were placed the same distance from the glass to ensure neither sample is receiving more/less light than the other.
The Air Pump, placed far enough away from any water, as per risk prevention methods [Appendix table C], was turned on and the air tight tube with the filter was inserted into each bucket.
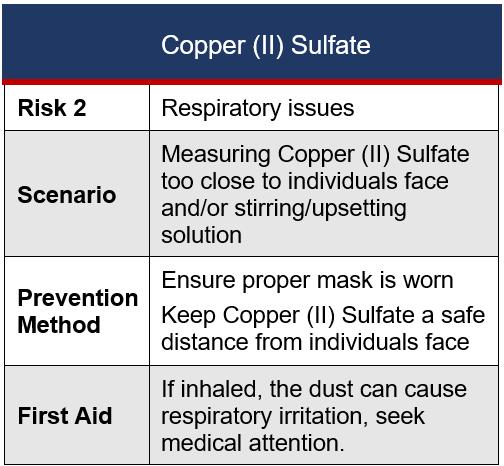
With a face mask, latex gloves and scientific goggles, as per risk prevention methods [Appendix D,E,F], the small scales (g) and a petri dish (tared), were used to measure 23.8g (to 1 d.p) of Copper (II) Sulfate was measured onto the petri dish using the lab spoon and spatula, then poured into the bucket labelled ‘Copper (II) Sulfate’.
Using the small scales (g) and a 100mL beaker (tared), 41.6 grams of Cooking Oil (to 1 d.p) was measured, then poured into the bucket labelled ‘Oil’.
Method
From the materials extract 10x 10ml of the Copper (II) Sulfate sample and 10x 100mL of the Oil sample. Specifically for the Oil samples, take the measurements straight from the sample, i.e. don’t pour into beaker then measuring cylinder, as the Cooking Oil sits on top of the water and pouring out of the beaker continuously would result in some samples containing significantly more than others reducing the reliability. For the 10 Oil samples, leave for 30 minutes to settle as much as possible, then measure and record the level of Cooking Oil above the water (mL)
For the 10 Copper (II) Sulfate samples, the copper testing strips were inserted and left to process until dry. Then compared to the chart provided. Further quantitative data was measured using the scanner in the ‘What Colour Is this’ app, made by Nicholas Troia, to find the RGB scale. From this, the ‘B’ value of the copper test strips was recorded.
The same experimental process was repeated at the end of the 43 days to provide quantitative data to compare the change.
Results
Copper (II) Sulfate Content (ppm)

Table 1: Copper (II) Sulfate Content in ppm

Table 2: Data gathered from Oil samples

Table 3: Data gathered from Copper (II) Sulfate sample measured on the RGB scale
Descriptive Statistics
Alternate Hypothesis HA
It is Hypothesised that the filtrating and detoxifying properties of Typha Orientalis reduces the amount Copper (II) Sulfate and Cooking Oil in water.
Null Hypothesis H0
It is Hypothesised that the filtrating and detoxifying properties of Typha Orientalis will have no change in the amount of Copper (II) Sulfate and Cooking Oil in water.
Copper (II) Sulfate
T-Test: Two-sample Assuming Equal Variances

Table 4: Descriptive statistics comparing the initial and final RGB scale of the copper test kit, measuring Copper (II) Sulfate
Cooking Oil
T-Test: Two-Sample Assuming Equal Variances

Table 5: Descriptive statistics comparing the initial and final levels in mL of the Oil content
Table 5: Descriptive statistics comparing the initial and final levels in mL of the Oil content
Discussion
The key research question was to explore the extent of Typha Orientalis’ filtration and detoxification properties within a realworld scenario, with materials based off of Sydney Harbour’s Water and The River Ganga samples, data gathered through scientific research conducted by Gavin Birch and the School of Geosciences at the University of Sydney (Birch, G., McCready, S., Long, E., Taylor, S., & Spyrakis, G., 2008) and Hasnahara Khatun and Dr. Arshad jamal (Khatun & Jamal, 2018). The average decrease in both tests demonstrated the success of the investigation, which was supported through descriptive statistics and qualitative data.
Due to a communication error, the substances were measured in g instead of mg, despite a difference in figures of ×103 the data still provided measurable differences, ultimately showing a greater change than predicted further justifying the use of Typha Orientalis in the filtration and detoxification of polluted bodies of water.
The Oil sample, over the course of 43 days in 10L of water, had reduced from an average of 3.2mL of Cooking Oil in 100mL samples to less than 1 ml in 100mL samples, a 68.75% decrease, measured through sedimentation. The initial samples ranged from 5mL to 2mL then finally decreased to scores of 1mL to <1mL but due to the limit of reading of 100mL measuring cylinders, +/- 1mL, the accuracy of the final assessment was reduced yielding an average percentage error of 31.25%. Alongside this due time constraints from study periods and time of breaks, the oil was only left to separate for 30 minutes reducing the accuracy of the data.
Although the reduction in Cooking Oil after sedimentation was decreased significantly, as per the One-Tailed T-test, further testing with high precision equipment and minimal time constraints would provide a more accurate analysis.
Due to the law of conservation of mass, the outcome of the Cooking Oil sample would either be equal to or less than the initial amount of Cooking Oil, 41.6g, meaning a One-Tailed T-test was needed. The T-test was conducted (assuming equal variances) and according to the descriptive statistics table (table 4) TCrit= 7.570, PValue = 2.663E-07 and α = 0.05. As the PValue is <0.0001, there is >99.99% statistical significance in the difference in data sets, rejecting the null hypothesis and accept the alternate hypothesis with strong statistical evidence.
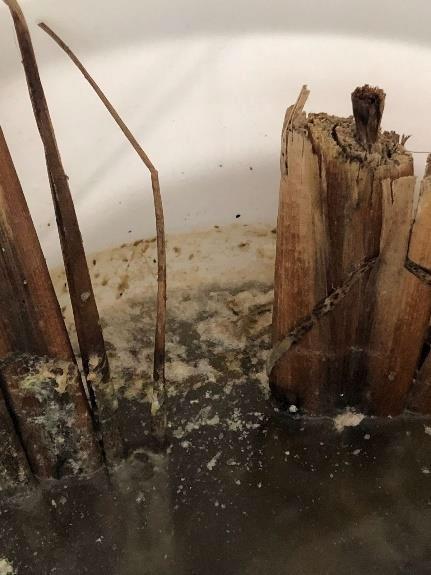
The appearance of the sample initially, was clouded and large amounts of Cooking Oil were present above the water. It also left a thick layer of Cooking Oil on all of the equipment. The final appearance of the water was objectively much clearer with only a small film upon the surface of the water, different in colour to the original colour of the Cooking Oil, it acted in a different way to Cooking Oil, it took less time to complete sedimentation and was within 5 minutes as opposed to 30minutes to an hour

Figure 4: initial and final oil sample for comparison
In the Cooking Oil sample, a small amount of frothy residue left upon the surface, meant it was in the emulsification stage of breaking up the oil, towards the end of the process, as outlined by (Ground truth Trekking, 2014). There was a mixture of white and brown foam (figure 2) which looked similar to seafoam that is present at the beach after a storm. This phenomenon was only present on the oil sample.

Figure 5: Frothy white/brown residue left on top of oil sample
The Copper (II) Sulfate sample, over the course of 43 days in 10L of water had decreased from an average of 2ppm to 1ppm, upon initial inspection of the copper test strip in a 10mL sample. Due to the large error associated with the Copper Testing Kit, each of the copper test strips were measured using a scanner in the ‘What Colour Is this’ app, made by Nicholas Troia, to find the RGB scale. From this, the amount of blue (B) was recorded, providing an increase from an average of 82.1B to 93.9B, a 14.57% increase in B, correlating to a 14.57% decrease in Copper (II) Sulfate. The initial samples (RGB) ranged from 76 to 87 then increased to range of 89 to 98. With a limit of reading of +/- 1B due to the App’s capabilities, the accuracy was decreased yielding an average error of 14.57%, which calls for more precise testing equipment. The use of the RGB scale provided a negative P-Value as there is an increase from the initial to the final results, but this is because an increase in the amount of ‘B’ correlates to the decrease in copper content in ppm, having no effect on the analysis.
Due to the law of conservation of mass, the outcome of the Copper (II) Sulfate sample would either yield the same amount of Copper (II) Sulfate or less, meaning a one-tailed t-test was needed. The t-test was conducted (assuming equal variances) and according to the descriptive statistics table (table 3) TCrit =7.259, PValue = 4.75E-07 and α = 0.05. As the Pvalue is <0.0001, there is >99.99% statistical significance in the difference in data sets, rejecting the null hypothesis and accept the alternate hypothesis with strong statistical evidence.
The Copper (II) Sulfate samples did not have a noticeable difference on camera, but in person the final samples were much clearer than the initial samples with less blue from the Copper (II) Sulfate.
Note that due to the communication error stated above, the amount of Copper (II) Sulfate present would have been much greater than 2ppm, past the limit of reading of the copper test kit meaning it could not show a darker blue, but this was not discovered until a review of the investigation on 22/08/2022. Although it still decreased in Copper (II) Sulfate from 2382ppm down to approximately 1ppm. The same for the Cooking Oil, it would have decreased from 4164ppm down to approximately <1ppm.
The data gathered from each One-Tailed T-test, when measured comparatively, to show the efficiency of Typha Orientalis is similar in each data set. There was a 0.31137 difference between the TCrit, although the PValue of Copper (II) Sulfate is almost 2x more.

Table 5: Comparison of 2 Data Sets
Table 5: Comparison of 2 Data Sets
As per WHO the final amount of copper found in the Copper (II) Sulfate sample was reduced from an unsafe amount of copper to the maximum acceptable amount of copper, 1ppm or 1mg/L (figure 3). The extension of this investigation, through extrapolation, would predict a decrease in copper and increase in water safety. This signified the success of the intention of the project, to detoxify and filtrate polluted water to a safe level.
Although there is no specific figure for the safe amount of PAH in drinking water, the assumption that as the number approaches 0 the safety reaches a maximum. Therefore, the reduction of oil, when extrapolated, would predict the regression of oil to a safe level in the future.
It is worth taking into consideration that this test was conducted throughout winter meaning the bulrushes were preparing to partially die off before producing new life in spring, leaving the potential for better results in spring/summer (Gardening With Angus Bringing You the Best In Australian Plants And Gardening, n.d.). Although, through studies conducted by Kathe Seidel, the dead or removed bulrushes would still provide sufficient filtration as long as the roots are alive (Sahtouris, E, 1990)
These findings can be applied to real world polluted water as the concentrations of Copper (II) Sulfate and Cooking oil were based on the data provided by (Birch, G., McCready, S., Long, E., Taylor, S., & Spyrakis, G., 2008) and (Khatun, H., & Jamal, D. A., 2018).
Conclusion
Typha Orientalis’ filtrating and detoxifying properties were proven to be effective in the reduction of Copper (II) Sulfate and Cooking Oil, as supported through quantitative and qualitative data. The Cooking Oil samples yielded an average decrease of 14.57% over the course of 43 days with a Pvalue that was <0.0001 (2.663E-07), there is >99.99% statistical significance in the difference in data sets, rejecting the null hypothesis and accept the alternate hypothesis with strong statistical evidence. The Copper (II) Sulfate samples yielded an average decrease of 68.75% decrease over the course of 43 days. With a Pvalue <0.0001 (4.75E-07), there is >99.99% statistical significance in the difference in data sets, rejecting the null hypothesis and accept the alternate hypothesis with strong statistical evidence. The progressive visual clearing of both the Copper (II) Sulfate and Cooking Oil samples further reinforced the success of the investigation. The t-test and statistical analysis support the alternate hypothesis, rejecting the null hypothesis, further supporting the research conducted by Kathe Seidel (Sahtouris, E, 1990). These findings support the real-world application of this phenomenon.
Reference List
Adeel, M., Song, X., Wang, Y., Francis, D., & Yang, Y. (2017). Environmental impact of estrogens on human, animal and plant life: A critical review. Environment International, 99, 107–119. https://doi.org/10.1016/j.envint.2016.12.0 10
Australian Government, Fane, S., & Reardon, C. (2013). Wastewater reuse. Wastewater Reuse. Retrieved 16 October 2021, from https://www.yourhome.gov.au/water/wast ewater-reuse
Ben, Y., Hu, M., Zhang, X., Wu, S., Wong, M. H., Wang, M., Andrews, C. B., & Zheng, C. (2020). Efficient detection and assessment of human exposure to trace antibiotic residues in drinking water. Water Research, 175, 115699. https://doi.org/10.1016/j.watres.2020.115 699
Birch, G., McCready, S., Long, E., Taylor, S., & Spyrakis, G. (2008). Contaminant chemistry and toxicity of sediments in Sydney Harbour, Australia: spatial extent and chemistry–toxicity relationships. Marine Ecology Progress Series, 363, 71–88. https://doi.org/10.3354/meps07445
Branley, A. (2015, July 7). Drugs including painkillers, anti-depressants found in tests on Sydney Harbour water. ABC News. Retrieved 10 November 2021, from https://www.abc.net.au/news/2015-0707/common-drugs-found-lurking-insydney-harbour-water/6599670
Brittanica. (n.d.). bulrush | plant Encyclopedia Britannica. Retrieved 2 November 2021, from https://www.britannica.com/plant/bulrush
Cassoobhoy, A. (2020). How does water pollution affect human health?. Medicalnewstoday.com. Retrieved 13 February 2022, from https://www.medicalnewstoday.com/articl es/water-pollution-andhumanhealth#:~:text=Contaminated%20 water%20can%20harbor%20bacteria,hyg iene%2C%20or%20unsafe%20drinking% 20water
Chemical And Physical Information. (n.d.). GASOLINE. Retrieved 17 February 2022, from https://www.atsdr.cdc.gov/toxprofiles/tp72 -c3.pdf
Clinical Leadership and Infection Control. (2015, March 24). Chlorine used in wastewater treatment may boost antibiotic resistance, study finds. Retrieved 10 November 2021, from https://www.beckershospitalreview.com/q uality/chlorine-used-in-wastewatertreatment-may-boost-antibioticresistance-study-finds.html#:%7E:text=Chlorine%20used% 20in%20wastewater%20treatment%20ma y%20boost%20antibiotic%20resistance% 2C%20study%20finds,-Staff%20%2D%20Tuesday%2C%20Marc h&text=Recent%20research%20has%20 shown%20that,waste%2C%20contributin g%20to%20antibiotic%20resistance
Department of Primary Industries. (2020). NSW WeedWise. NSW WeedWise. Retrieved 8 June 2022, from https://weeds.dpi.nsw.gov.au/Weeds/Eur asianWaterMilfoil#:%7E:text=Eurasian%2 0water%20milfoil%3A,lakes%2C%20pon ds%20and%20shallow%20reservoirs%20 untitled%20(fluvalaquatics.com)
Doblin, M. (2014, August 29). A scientific understanding of Sydney Harbour University of Technology Sydney. Retrieved 23 November 2021, from https://www.uts.edu.au/research-andteaching/our-research/climate-changecluster/news/scientific-understandingsydney-harbour
Do, W., & Jamerson, M. (2021). Marine pollution. Wwf.org.au. Retrieved 13 February 2022, from https://www.wwf.org.au/what-wedo/oceans/marine-pollution#gs.phz2bc.
Engels, J. (2020, May 11). Collecting Clean Water from Polluted Sources with Natural Filtration Systems. The Permaculture Research Institute. Retrieved 17 June 2022, from https://www.permaculturenews.org/2020/ 05/15/collecting-clean-water-frompolluted-sources-with-natural-filtrationsystems/
Fell Consulting PTY LTD. (2015, May 30). WATER TREATMENT AND SYDNEY CATCHMENT. Discussion Paper for Office of NSW Chief Scientist and Engineer. Retrieved 10 November 2021, from https://www.chiefscientist.nsw.gov.au/__d ata/assets/pdf_file/0020/63335/Finalwater-treatment-report-300514.pdf
FLUVAL. (n.d.). Air Pump Instruction Manual. Fluval Aquatics. Retrieved 14 June 2022, from https://www.fluvalaquatics.com/manuals/ Fluval_A849-A850-A82_QPump_Manual.pdf
Fuji Clean - USA. (2019, May 7). Fuji Clean USA - Wastewater Treatment Product Overview. YouTube. Retrieved 16 October 2021, from https://www.youtube.com/watch?v=LKJA QzeqE_M
FujiClean. (2008). Frequently Asked Questions | FujiClean. FujiClean Wastewater Treatment Systems. Retrieved 16 October 2021, from http://www.fujiclean.com.au/frequentlyasked-questions/
Gardening With Angus Bringing You the Best In Australian Plants And Gardening (n.d.). Gardening With Angus. Retrieved 30 November 2021, from https://www.gardeningwithangus.com.au/t ypha-orientalis-bullrush/
Government of South Australia. (n.d.). Department for Environment and WaterThe Department for Environment. . .. Department for Environment and Water. Retrieved 9 November 2021, from https://www.environment.sa.gov.au/topics /river-murray-new/improving-riverhealth/issues-for-river-health
Ground truth Trekking. (2014, November 5). Oil Degradation in the Sea. Retrieved 11 August 2022, from http://www.groundtruthtrekking.org/Issues /AlaskaOilandGas/OilDegradation.html#: %7E:text=Biodegradation%20of%20oil% 20by%20microorganisms%20present%20 in%20the,the%20process%20of%20meta bolizing%20it%20to%20generate%20ene rgy
Illinois Department of Public Health. (n.d.). Polycyclic Aromatic Hydrocarbons (PAHs). Cancer in Illinois. Retrieved 10 November 2021, from http://www.idph.state.il.us/cancer/factshe ets/polycyclicaromatichydrocarbons.htm
Jenkins, J. (2019). The Humanure Handbook, 4th Edition: Shit in a Nutshell (4th ed.). Joseph Jenkins, Inc.
Khatun, H., & Jamal, D. A. (2018). Geochemicals Heavy Metal Pollution of River Ganga - Causes and Impacts. International Journal of Trend in Scientific Research and Development, Volume2(Issue-2), 1035–1038. https://doi.org/10.31142/ijtsrd9576
LaRoche, C. (2019, March 2). Hazards of Copper Sulfate. Sciencing. Retrieved 14 June 2022, from https://sciencing.com/hazards-coppersulfate-7609349.html
Li, J., Yu, H., & Luan, Y. (2015). MetaAnalysis of the Copper, Zinc, and Cadmium Absorption Capacities of Aquatic Plants in Heavy Metal-Polluted Water. International Journal of Environmental Research and Public Health, 12(12), 14958–14973. https://doi.org/10.3390/ijerph121214959
Millison, A. (2021, October 12). How to Recycle Waste Water Using Plants YouTube. Retrieved 24 October 2021, from https://www.youtube.com/watch?v=fsRcVkZ9yg&feature=youtu.be
Mollison, B. (1997). Permaculture: A Designers’ Manual. Ten Speed Pr.
National Centre for Biotechnology Information. (n.d.). NCBI. NCBI. Retrieved 10 November 2021, from https://www.ncbi.nlm.nih.gov/pmc/articles/ PMC3945572/
National Herbarium of NSW, Royal Botanic Garden, Sydney, Australia. (n.d.). New South Wales Flora Online PlantNET. Retrieved 30 November 2021, from https://plantnet.rbgsyd.nsw.gov.au/cgibin/NSWfl.pl?page=nswfl&lvl=gn&name= Typha
NSW Department of Planning, Industry and Environment. (n.d.). Sydney Harbour - Beachwatch Daily Bulletins. Sydney Harbour Daily Pollution Forecast. Retrieved 23 November 2021, from https://www.environment.nsw.gov.au/bea chapp/SydneyBulletin.aspx?NoMobile
Oasis Design. (n.d.). Branched Drain Greywater Systems. Retrieved 24 October 2021, from https://oasisdesign.net/greywater/branche ddrain/
Office of Dietary Supplemets. (2021, March 29). Office of Dietary Supplements - Copper. National Institutes of Health. Retrieved 23 January 2022, from https://ods.od.nih.gov/factsheets/CopperHealthProfessional/
Perry, T. (2021, June 12). NASA says these 18 plants are the best at naturally filtering the air in your home. GOOD. Retrieved 23 November 2021, from https://www.good.is/slideshows/nasagets- terrestrial?rebelltitem=18#rebelltitem18
Raine, R. (2020, November 17). Aquatic Plants That Purify Water. Home Guides | SF Gate. Retrieved 11 October 2021, from https://homeguides.sfgate.com/aquaticplants-purify-water-43531.html
Rich, N. (2016, July 14). The Lawyer Who Became DuPont’s Worst Nightmare. The New York Times. Retrieved 16 October 2021, from https://www.nytimes.com/2016/01/10/mag azine/the-lawyer-who-became-dupontsworst-nightmare.html
Romano, M. (2019, January 19). Heavy Metal Test Kit. 5 in 1 Test Your Water For Harmful Metals. Retrieved 23 January 2022, from https://www.alloratestkits.com.au/heavymetal-test-kits/
Sahtouris, E. (1990). Beautiful Bulrushes, Remarkable Reeds. Ratical. Retrieved 8 November 2021, from https://www.ratical.org/LifeWeb/Articles/ru shes.html
Sydney Institute of Marine Science Technical Report. (2014). Sydney Harbour A systematic review of the science 2014. Sydney Harbour Research Program. Retrieved 23 November 2021, from https://www.sydneycoastalcouncils.com.a u/wp-content/uploads/2019/08/SydneyHarbour-A-systematic-review-of-thescience-2014.pdf
Sydney Water. (2021, July 6). Wastewater Treatment. Wastewater Treatment - Sydney Water. Retrieved 16 October 2021, from https://www.sydneywater.com.au/educati on/wastewater-recycling/wastewatertreatment.html
The New York Times. (1975, March 9). Bulrushes Being Used in Artificial Marshes to Filter Water. Retrieved 2 November 2021, from https://www.nytimes.com/1975/03/09/arch ives/bulrushes-being-used-in-artificialmarshes-to-filter-water.html
UNSW. (2011, November 17). Sydney harbours deadly diet for sea creatures UNSW Newsroom. Retrieved 23 January 2022, from https://newsroom.unsw.edu.au/news/scie nce-technology/sydney-harbours-deadlydiet-sea-creatures
UTS. (2020, October 20). Sewage to blame for beach contamination University of Technology Sydney. Retrieved 10 November 2021, from https://www.uts.edu.au/news/healthscience/sewage-blame-beachcontamination
Victorian Government Department of Sustainability and Environment, & Murphy, A. H. (2006). National recovery plan for the Ridged Water-milfoil (Myriophyllum porcatum). Department of Climate Change, Energy, the Environment and Water. Retrieved 14 June 2022, from https://www.dcceew.gov.au/environment/ biodiversity/threatened/recoveryplans/national-recovery-plan-ridgedwater-milfoil-myriophyllum-porcatum
Water NSW. (n.d.). Our water supply system. WaterNSW. Retrieved 10 November 2021, from https://www.waternsw.com.au/waterquality/education/learn/water-supplysystem#:%7E:text=More%20than%2080 %25%20of%20Sydney’s,Blue%20Mounta ins%20and%20the%20Illawarra
Water Research Centre. (n.d.). pH of Drinking Water Natural Water and Beverages. Know Your H2O. Retrieved 16 November 2021, from https://www.knowyourh2o.com/indoor4/the-ph-of-water#:%7E:text=The%20pH%20of%20p ure%20water,water%20and%20forms%2 0carbonic%20acid.
Wikipedia contributors. (2022, July 28). Warragamba River. Wikipedia. Retrieved 10 November 2021, from https://en.wikipedia.org/wiki/Warragamba _River
World Health Organisation. (n.d.). Copper. Retrieved 23 January 2022, from https://www.who.int/teams/environmentclimate-change-and-health/watersanitation-and-health/chemical-hazardsin-drinkingwater/copper#:%7E:text=Water%20Sanit ation%20and%20Health%20Our%20visio n%20and%20mission,document%20for% 20the%20development%20of%20the%20 GDWQ%20%282004%29
Writer, S. (2021, November 24). South Africa Faces Water Crisis Warns Rand Water. The Bulrushes. Retrieved 9 November 2021, from https://www.thebulrushes.com/2021/09/2 4/south-africa-faces-water-crisis-warnsrand-water/
YouTube. (2007, December 26). Ecomachine with Dr. John Todd Retrieved 8 November 2021, from https://www.youtube.com/watch?v=2jRek ZJx_-Q
Appendices

Appendix A: Risk Assessment 1 for Horticultural Sand
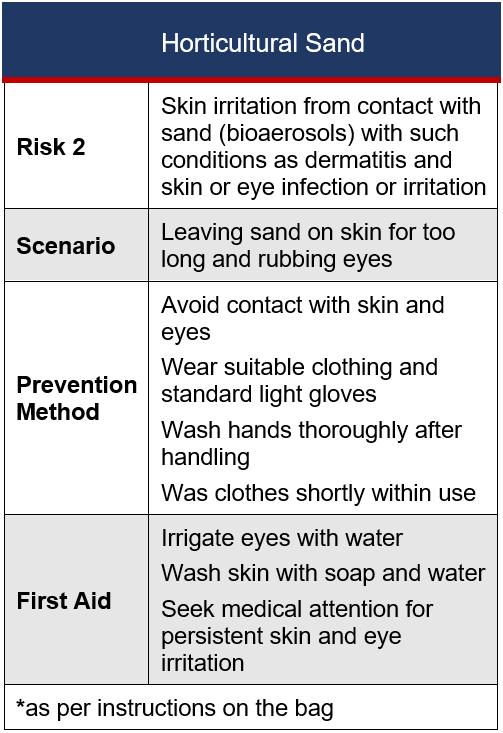
Appendix B: Risk Assessment 2 for Horticultural Sand
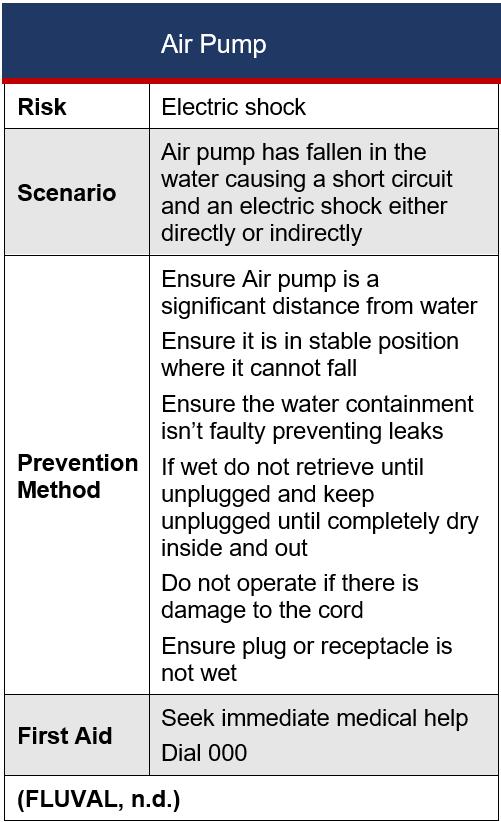
Appendix C: Risk Assessment for FLUVAL Air Pump
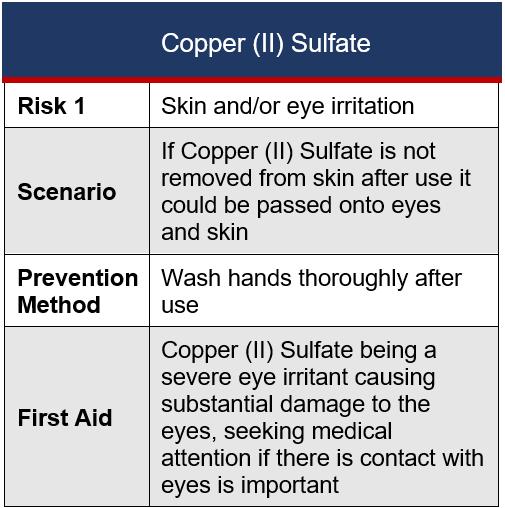
Appendix D: Risk Assessment 1 for Copper (II) Sulfate
Appendix E: Risk Assessment 2 for Copper (II) Sulfate

Appendix F: Risk Assessment 3 for Copper (II) Sulfate
(LaRoche, C 2019)