23 minute read
How The Anomalous Behaviour of Hydrogen Fluoride Provides Insight Into The Nature of Ionisation


How The Anomalous Behaviour of Hydrogen Fluoride Provides Insight Into The Nature of Ionisation
Theo Mortazavi – Normanhurst Boys High School
Abstract
The anomaly behind the weak acid nature of hydrofluoric acid has sparked scientific discourse for nearly a century, with the most recent explanation accounting a lack of ionisation to entropic factors. This report extrapolates the theorised principle by establishing causation between hydration entropy of a wide array of monoprotic acid anions and their tendency to ionise in an aqueous system. Entropic data was obtained through the CHSNOZ package of freely available RGUI software, plotted against ionisation tendency compiled by IUPAC handbooks, and regression was tested. Ultimately it was found that an increased hydration entropy of monoprotic anions is directly related to a decreased tendency of the acid to ionise in an aqueous solution
1. Literature Review 1
1.1 Advancement of Hydrofluoric Acid Theory
Despite its relative abundancy, Hydrofluoric acid it remains an anomaly amongst hydrohalic acids given its classification as a Brønsted-Lowry weak acid where, formerly, a weak acid is classified as one with a pKa value greater than a Hydronium ion. (pKa ≥ -1.74)
1.1.1 Linus Pauling
This superficially simple outlier gained notary after Nobel Prize Laureate Linus Pauling’s paper on the matter. 3 Pauling theorised that electronegativity of the halogen determined the acidity, where a higher net polarity would increase bond stability and decrease ionisation tendency. While this holds true amongst the Hydrohalic acids, the inverse trend is observed across the period, undermining the validity of Pauling’s conclusions.

Table 1 4
1 Record of Collaboration included in S.1.2 portfolio.
2 Equation (1) shows the partial ionisation of hydrofluoric acid, indicated by the equilibrium arrow
3 L. Pauling, ‘Why is Hydrogen Fluoride a weak acid? An answer based on a correlation of free energies with electronegativities’ Journal of Chemical Education, vol 33, no. 1, 1956, pg. 16-17
4 Table 1 quantifies the relationships between pKa and electronegative amongst hydrohalic acids
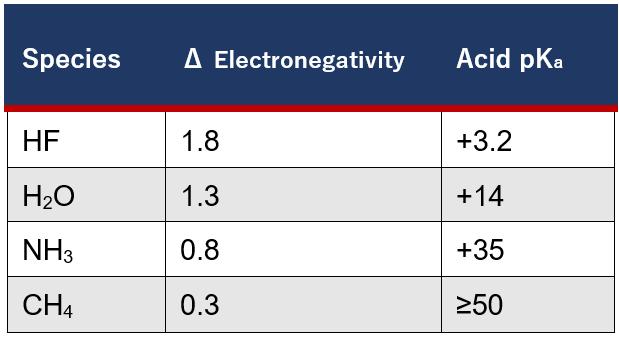
Table 2 5
1.1.2 Giguere and Turrel
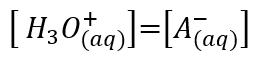
Giguère and Turrel, instead theorised that HF did in fact completely (or largely) ionise into H3O+(aq) and F-(aq) bound complexes, hence still acting as a weak acid. 6 These complexes would appear as H3O+(aq) band on an infra-red spectrum, however, would account for the low recorded pH of HF, hence explain the apparent lack of ionisation, given;
For:
Where:
However, this controversial conclusion has been met with criticism given the absence of suitable spectroscopic crossreferencing, where the IR spectra alone insufficiently confirms the presence of
H3O+ ions as opposed to classically bound HF. Given the absence of repeated trials with appropriate spectroscopic evidence, this report bore largely unreliable conclusions.
1.1.3 Ayotte Herbert and Marchland
Ayotte, Hèrbert and Marchland contradicted these findings through analysis of the Born-Haber cycle, which describes the various enthalpy (H) pathways for the ionisation of HF. 7

Figure 1 8
As seen in Figure 1, while there is a substantial (+) homolytic bond enthalpy from gaseous HF to H▪ and F▪ radicals, the hydration enthalpy (ΔH) releases almost equal energy, resulting in a net exothermic reaction, which should favour ionisation via Standard state free energy principles. 9 Yet via the Gibb’s Free Energy equation, the ionisation of HF yields an endergonic dissolution. (Δ����° = +3.2kJmol-1) 10
5 Table 2 quantifies the relationship between pKa and electronegativity across period 2 compounds
6 P. Giguere and S. Turrell, ‘The Nature of Hydrofluoric Acid. A Spectroscopic Study of the Proton-Transfer Complex H3O+▪F-‘Journal of the American Chemistry Society, vol. 102 no 1, 1980, pg. 5473
7 P. Ayotte, M Herbert and P. Marchland, ‘Why is hydrofluoric acid a weak acid?’, The Journal of Chemical Physics, vol. 123, no. 1, 2005, pg. 2
8 Figure 1 shows the Born-Haber cycle of HF on an energy profile diagram, with data transformed from the report of Ayotte, Hèrbert and Marchland
9 P. Ayotte, M Herbert and P. Marchland, ‘Why is hydrofluoric acid a weak acid?’, The Journal of Chemical Physics, vol. 123, no. 1, 2005, pg. 2
10 P. Ayotte, M Herbert and P. Marchland, ‘Why is hydrofluoric acid a weak acid?’, The Journal of Chemical Physics, vol. 123, no. 1, 2005, pg. 1
The Ka (acid dissociation constant) can be directly related to the entropy ΔS, with respect to ΔH.
They concluded that the (+) ΔG value must be a direct implication of a larger ΔS value which was due to the larger negative hydration entropy of the fluoride ion, compared to the larger Chloride, Bromide and Iodide ions. According to subsequent works of T.Joutsuka and K. Ando, these larger ions less prominently disrupted hydrogen bonding networks, lessening the change in entropy. 11 Therefore, it was concluded that HF acts as a weak acid in water due largely due to the entropy of hydration.
2.1 Research Gaps and Evaluation of Scope
While there has been a relative consensus reached on the causation of HF as a weak acid, this anomaly poses wider questions towards the generalised relationship between ionisation and hydration entropy for monoprotic acids. Given that substantive literature explaining the relationship between acid strength and concentration, as well as ionisation tendency and nonentropic thermochemical measures, further investigation into these well-established relationships would yield little conclusion
of value. Therefore, the most practical and potentially rewarding avenue of research will limit the scope of this report to establishing causation between hydration entropy and ionisation tendency.
2.1.1 Justification
The literature review suggests existing complexities in establishing relationship between ionisation and entropy of HF, hence this report will only cater to monoprotic acids, given that Polyprotonation introduces equilibrium calculations which introduce further variables.
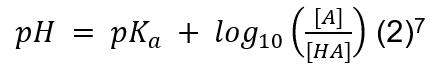
Moreover, pKa will be used as the sole measure of ionisation within this report, given that Ka produces values with greater variance, leading to unnecessary complications in statistical processing. pH is equally rejected given its greater temperature dependence and variation due to experimental conditions, increasing the chance of systematic and random error which could reasonably compromise the internal validity of this report.
3.1 Scientific Research Question
Whether hydration entropy of monoprotic acid anions affect their ionisation tendency within an aqueous solution.
4.1 Null Hypothesis (H0)
That hydration entropy of the monoprotic acid anion in aqueous solution does not affect its ionisation tendency.
4.2 Alternate Hypothesis (Ha)
That a lower absolute hydration entropy of monoprotic acid anion in aqueous solution increases its ionisation tendency.
5.1 Evaluation of Experimental Design and Risk Assessment
Data collected for the methodology was purely secondary, given the lack of access to instruments which would give readings of acceptable accuracy, and the inherent risks associated with working with corrosive acids. Therefore, data was instead sourced from reputable secondary sources, conducted in highly controlled conditions, with acutely accurate instrumentations, producing a valid and scrutinised set of results.
To gather these data sources, Google Scholar was used to narrow down reports which may have included a relevant dataset, using keywords such as ‘hydration entropy’ and ‘pKa dataset.’ After a relevant report was identified, the experimental data was crosschecked with theoretical data, to gauge the degree of accuracy. The data source was then further examined, assessing whether the paper and journal are peer-reviewed, as well as how many publications the author(s) had. Finally, citations of this source were checked, where less sources did not necessarily indicate an invalid source, it did infer that the data is less peer-reviewed. However, if citations were found to be of a high quality, even in few, the dataset was considered reliable and valid enough for the purposes of this report. This process was repeated to increase the size and breadth of the dataset, maintaining a standard of reliability and validity of the results.
Inorganic data collection relied upon publicly available datasets including the National Institute of Standards and Technology (2021) [NIST], which were both used to cross-reference experimental values obtained by research reports. 12Data pertaining to the thermochemistry of anion hydration including ΔS was gathered by the experimental reports where available data was cross-referenced with the NSIT, while data pertaining to the experimentally calculated pKa was collected solely from peer reviewed databases including IUPAC, in doing so, increasing the number of sources and datapoints which optimises reliability and contributes towards internal validity. 13 14
After collecting the inorganic data values, it became apparent there was insufficient homologous data to establish a correlation between pKa and ΔS, hence data was gathered from organic values with extensive aliphatic homologous series. To maintain internal validity within the procedure, only monoprotic carboxylic acid and 2-hydroxycarboxylic acid series were collated, with IUPAC published handbooks used to gather pKa values at 298.15K, cross-referenced with the National Library of Medicine PubChem Database, to ensure reliability. 15 The CHNOSZ database was accessed via the RGUI software was the only viable database of organic entropy values pertaining to each homologue at 298.15K, within a sophisticated coding framework. (detailed in the appendix) 16 17
12 National Institute of Standards and Technology, ‘NIST Chemistry Webbook,’ 2022 https://webbook.nist.gov/chemistry/ Accessed 21st August 2022
13 Y. Marcus, ‘The hydration entropies of ions and their effects on the structure of water,’ J. Chem. Soc., Faraday Trans. 1, 1986,82, 233-242
14 A. M. Slater, ‘The IUPAC aqueous and non-aqueous experimental pKa data repositories of organic acids and bases’ Comput Aided Mol Des. 2014 Oct;28(10):1031-4. Pg. 1-4
15 Pubchem
16 J. M. Dick, ‘An Introduction into CHNOSZ,’ 2022, https://cran.rproject. org/web/packages/CHNOSZ/vignettes/anintro.html#installing-and-loading-chnosz
17 Specific methodology referenced in the appendix
Inorganic and Organic data was ultimately tabulated and graphed, with respect to the homologous series, with regression values independently calculated through Microsoft Excel for each dataset, based on a highly valid experimental procedure.
5.2 Considerations of Accuracy
Given the accurate nature of this report, only databases which used highly accurate data were
included. Experimental data pertaining to calculations of pKa creates systematic inaccuracies, given the often insignificant [A-] in solution for weak acids and [HA-] for strong acids.
McTigue, O’Donnell and Verity addressed this accuracy by comparing registered the calculated molarity of HF solutions by both potentiometric and conductometric quantitative analysis technology. 18 They found that for 0.5molal (m) and 1.0m solutions of HF, the above methods were accurate. However, for concentrations approaching 6m, accurate readings required comparison of activity coefficients in the Debye-Huckel Equation.
Extended Debye-Huckel Equation (general form):
Derived Debye-Huckel Equation
While for strong acids, an uncontrollable degree of uncertainty exists given the negligible residual [HA], accuracy can be maximised through calculations using the Hammet acidity function.
Similarly, by using RGUI software and NIST database for all thermochemical data, peer-reviewed and highly accurate calculations are used to map entropy values to various stages of the BornHaber cycle. By using these specific entropy values rather than net entropic considerations, this report is able to accurately relate the hydration entropy of the anion to ionisation tendency and optimise accurate data within this report.
18 P. McTigue, T. O’Donnell and B. Verity, ‘The determination of Fluoride Ion Activities in Moderately Concentrated Aqueous Hydrogen Fluoride’, The Australian Journal of Chemistry, vol. 38, no. 1, 1985, pg.1798, 1803.
19 ���� = activity constant, A and B are universal constants: A = 0.5085, B = 0.3281, z is the integer charge of the ion, I is the ionic strength on the molal scale and b is the adjustable parameter: bHF = 0.2
6. Results
6.1 Inorganic pKa vs ΔS values
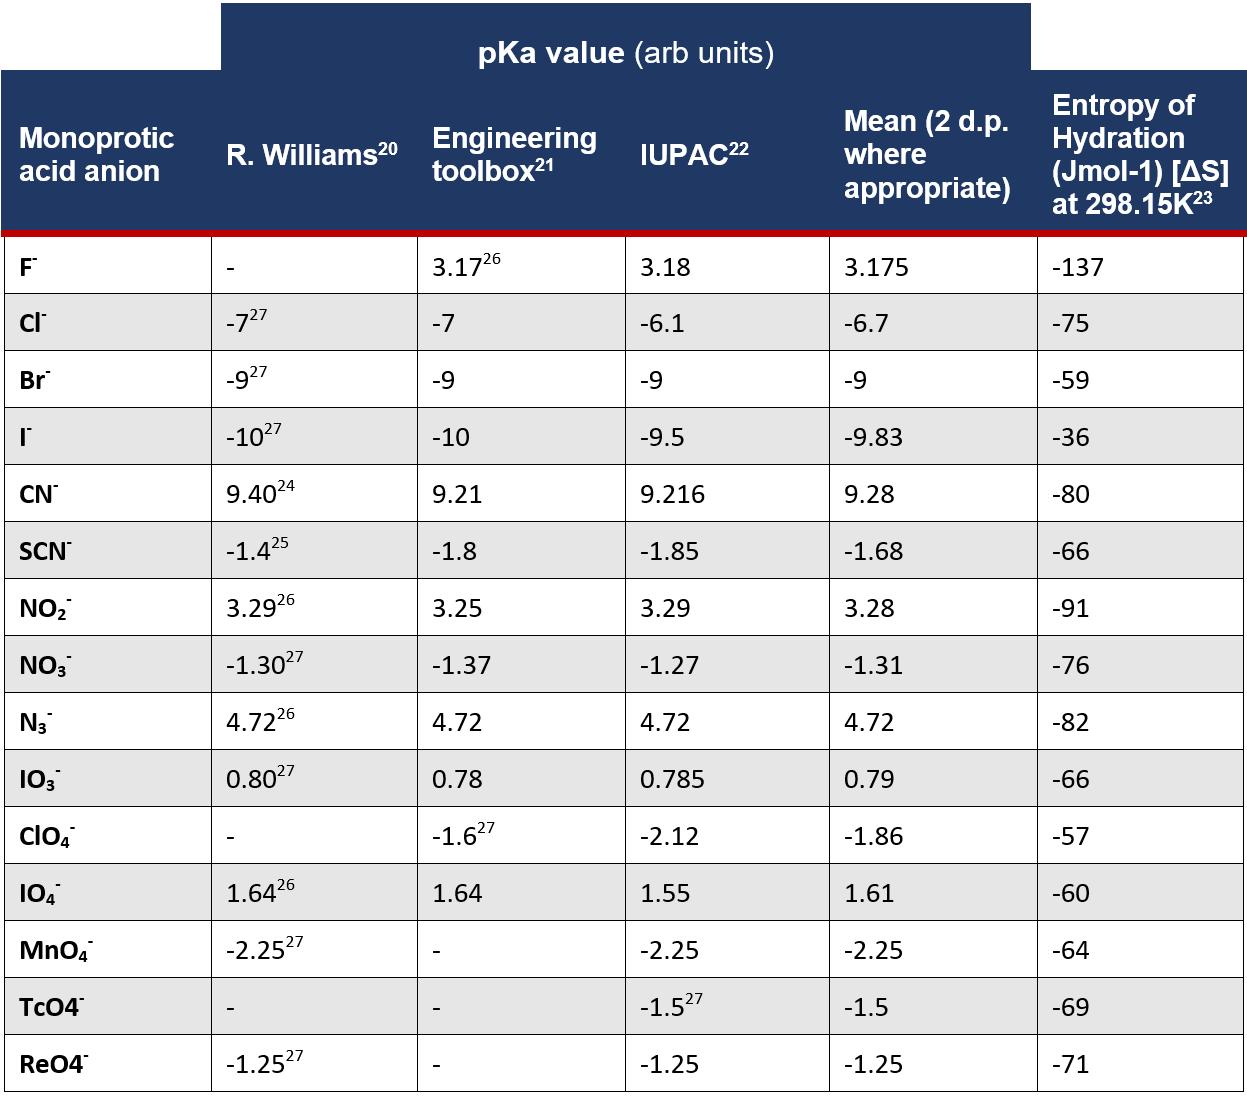
Results table 1 shows the cross referenced pKa values of inorganic anions dependent on their hydration entropy.

Graph 1 shows ΔS against pKa without respect to homologous series.
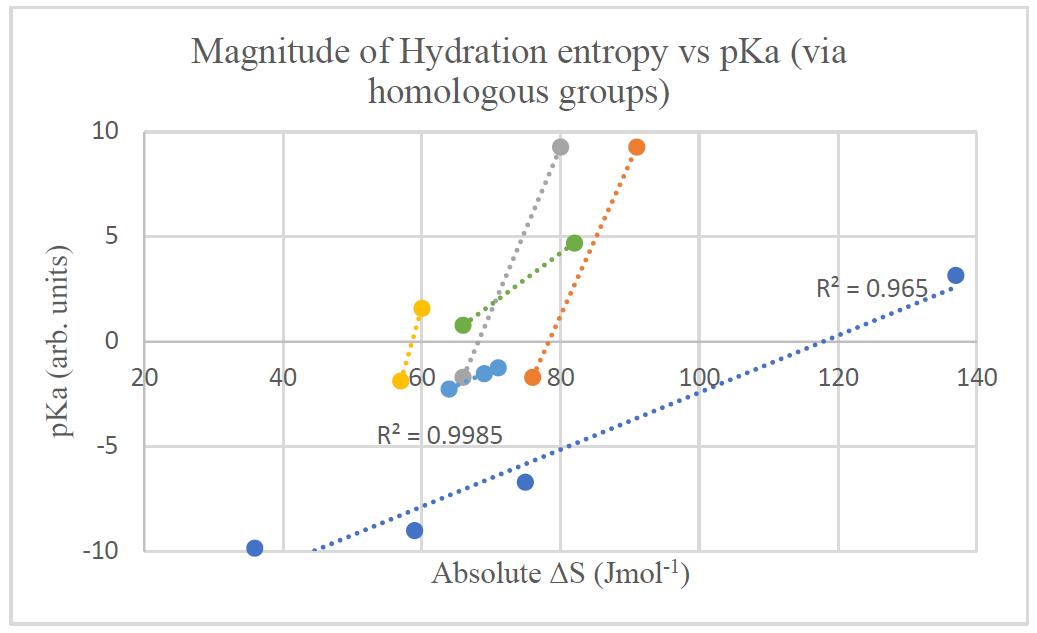
Graph 2 shows the correlation between ΔS and pKa within respect to each inorganic homologous series, where only the hydrohalic acids had enough datapoints to draw an informed R2 value.

Results table 3 shows Excel calculated regression confidence testing for all inorganic datapoints
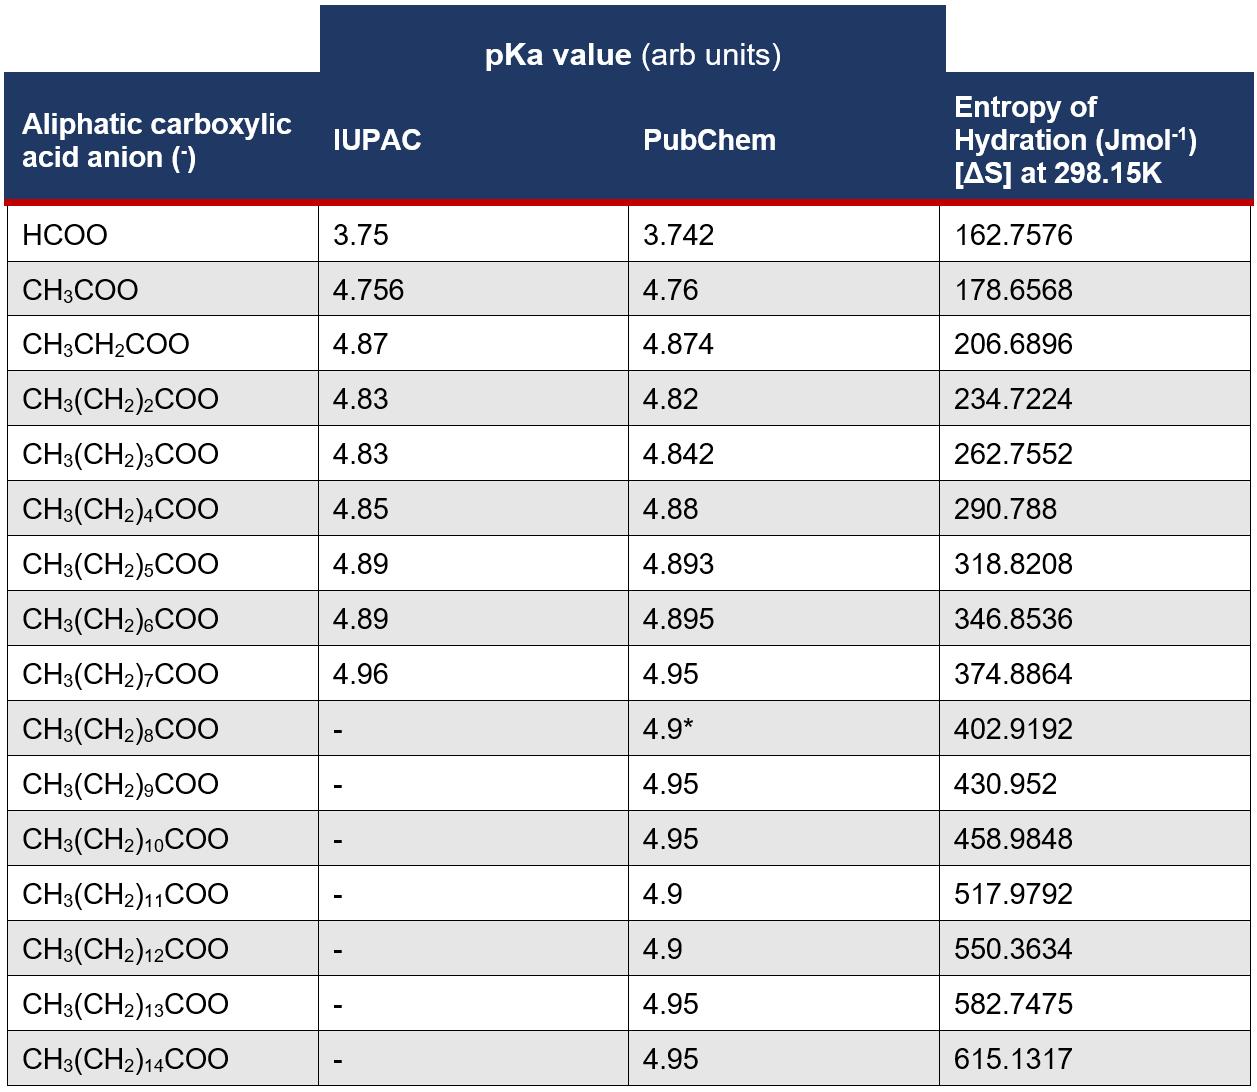
6.2 Organic pKa vs ΔS Results table 4 shows the first sixteen aliphatic, carboxylic acid anions with their pKa gathered from IUPAC/PubChem and entropy values obtained through the CHSNOZ database accessed via the RGUI software. 202122
20 A. M. Slater, ‘The IUPAC aqueous and non-aqueous experimental pKa data repositories of organic acids and bases’ Comput Aided Mol Des. 2014 Oct;28(10):1031-4.
21 National Center for Biotechnology Information (2022). PubChem Compound Summary for CID 11005, Myristic acid. Retrieved August 21, 2022 from https://pubchem.ncbi.nlm.nih.gov/compound/Myristic-acid.
22 J. M. Dick, ‘An Introduction into CHNOSZ,’ 2022, https://cran.rproject. org/web/packages/CHNOSZ/vignettes/anintro.html#installing-and-loading-chnosz
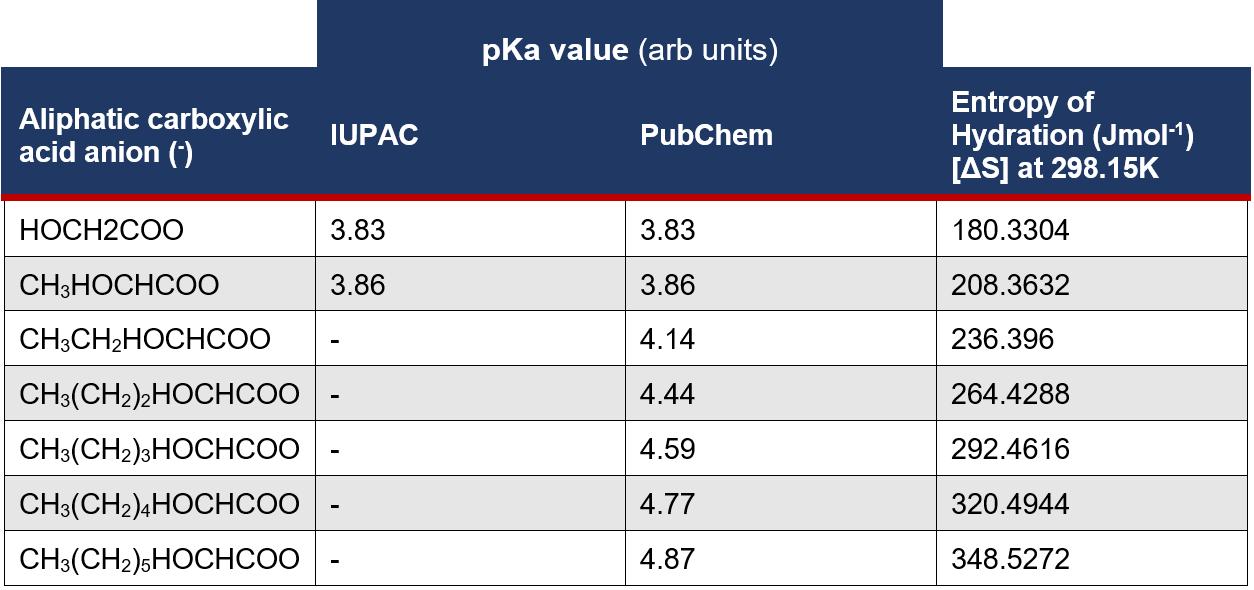
Results table 5 shows the aliphatic, 2-hydroxycarboxllic acid’s, collated an eidetic manner.

Graphs 3 displays the uncleansed data collected in Results table 4.
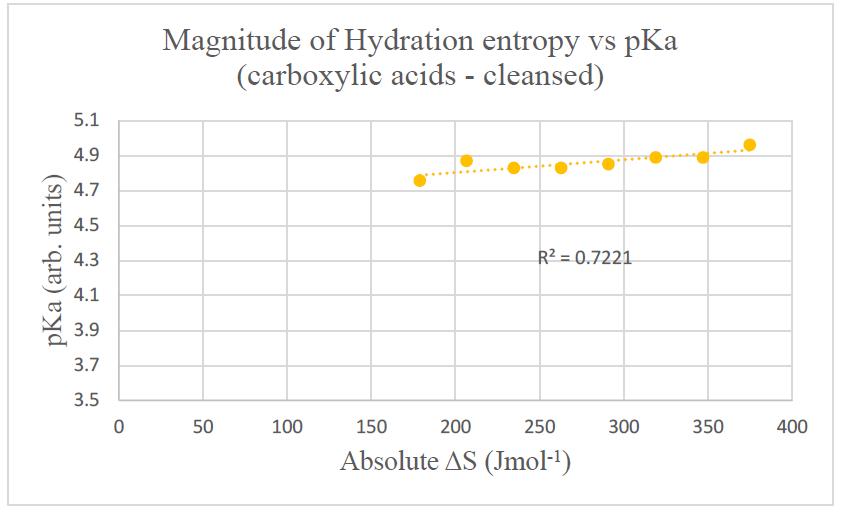
Graph 4 displays the cleansed version of data collated in Graph 3 as explained in discussion.
Graph 5 displays the uncleansed data collected in Results table 5
6.2.2 Regression Confidence Testing

Results table 6 shows Excel calculated regression confidence testing for the organic datapoints.
7. Discussion
7.1 Inorganic Correlation
The inorganic data presented several problems which was reflected in the statistical analysis and undoubtedly related to a lack of consistent data, leading to complexities in analysing trends. In plotting all inorganic datapoints within a single scatterplot, the R2 coefficient showed that only 31.18% of data could be explained by the line of best fit, showcasing a moderate (+) Pearson coefficient of 0.564 indicating that an increase in ΔS was only weakly related to a general increase in pKa
However, this result was reasonably expected given the innate difference in chemical properties between homologous series, yet, there was little that could be done to mitigate these limitations. Namely, there existed a lack of datapoints given an intrinsic lack of homologues within a period or group. For instance, despite gathering conclusive date for the complete homologous series of hydrohalic acids, given that only four homologues exist, there exists a limitation on the strength of causation as opposed to spurious correlation. Therefore, even despite yielding an R2 coefficient where 95.6% of data could be explained by the line of best fit (as seen in graph 2), to consider this limited dataset as a confirmation of my alternate hypothesis would present ethical implications which could reasonably compromise the internal validity of this report. This issue could not simply be rectified by a modification of experimental method, given that the raw values of pKa and ΔS of hydrohalic acids cannot be accurately, nor validly compared to those of any other homologous series without compromising controlled variables. Namely, differences in atomic radius alter thermochemical properties, while polarity and electronegativity distribution variations between homologous series render raw pKa and ΔS incomparable and such comparison would compromise controls and the validity of the trend. 23
7.2 Inorganic Statistical Analysis
Despite the limited success in establishing a correlation coefficient, the regression confidence statistics found a p-value of 0.0285 (3sf) which despite being above the threshold one-tailed α value of 0.025 still indicates that the chance of the data randomly taking on this distribution is only 2.85%, seen in results table 3. While it is still imperative to reject the alternative hypothesis on this account to maintain an unbiased report, the relatively low standard error value of 5.23% (3sf) indicated that a larger, consistent dataset such as organic homologues would provide statistically supported results.
7.3 Organic Correlation
The use of homologous, carboxylic acids provided substantial and confident correlation between the hydration entropy and pKa. Given that aliphatic carboxylic acids vary between homologues based on the addition of a -CH2- methylene bridge rather than element in a group, the limitations seen in the inorganic dataset, in this respect, were vastly overcome. 24 Aliphatic carboxylic acids are justifiable choices of dataset given they are monoprotic and weak acids, proving substantial chemical similarity to the inorganic acids, moreover, by not directly comparing entropy or pKa values with the inorganic datapoints, any variations are eliminated, where the line of best fit uses the marginal increase of values rather than the absolute value. 25 Furthermore, the substantial size and accuracy of the data available through the RGUI software greatly increased the validity of any trend established, where the CHNOS Z calculations provided entropy values to 7 significant figures with an uncertainty below ±10-4 %.
However, Results table 4 and graph 3 showcase that even despite the increase in the number of data entries, there is still only moderate positive correlation of 0.5032 with only 25.33% of data being explained by the line of best fit. Yet the cleansed data presented in graph 4 provide a high correlation value of 0.8498 with 72.21% of variance data explained. The variation in these values was attributed to the data cleansing process which limited the dataset to decanoic acid and removed only a single data entry of methanoic acid, which has a pKa of 3.83 and a hydration entropy of 180Jmol-1.
This was justifiable given that while there is no significant anomaly within the entropy value, the pKa indicated that methanoic acid has a tendency to ionise more than ten times greater than its subsequent ethyl homologue. Given that the IQR of the dataset is 0.104, and the 3.83 value lies 9.79 (3sf) standard deviations below Q1, it can be considered an extreme outlier and validly excluded. 26 In terms of principle, methanoic acid exhibits this significantly higher ionisation tendency given its higher net polarity than subsequent homologues, as well as a lower molar mass, which biases its tendency to form strong hydrogen bonding lattices over dispersion forces seen within the longer carboxylic acids, hence given its anomalous behaviour there are few disadvantages from its exclusion, however, significant improvements in improving correlation. 27 In terms of cleansing carboxylic acids with a chain length greater than decanoic acid are biased so heavily towards dispersion forces that their aqueous solubility is reduced to the degree that pKa results are no longer accurate, explaining the stagnant and illogical fluctuations between 4.9 and 4.95 for these acids that is seen in results table 4 28
24 J. Holmes, T. Jean, ‘The mass spectra of carboxylic acids–II: Fragmentation mechanisms in the homologous series HOOC(CH2)nCOOH’ Journal of Mass Spectrometry Volume 3 Issue 12 1970
25 A, Alwash. ‘Carboxyllic acid: Nomenclature, preparation, physical properties, and chemical reactions,’ 10.13140/RG.2.2.16402.48326. 2022 pg1-6
26 Ref. to appendix item 4
27 G, Torsten, K, Holger, K. Volker, R., Andreas K, Udo. (2018). Carboxylic acids in aqueous solutions: Hydrogen bonds, hydrophobic effects, concentration fluctuations, ionization, and catalysis. The Journal of Chemical Physics. 149. 244503. 10.1063/1.5063877. pg 2
28 G, Torsten, K, Holger, K. Volker, R., Andreas K, Udo. (2018). Carboxylic acids in aqueous solutions: Hydrogen bonds, hydrophobic effects, concentration fluctuations, ionization, and catalysis. The Journal of Chemical Physics. 149. 244503. 10.1063/1.5063877. pg 3
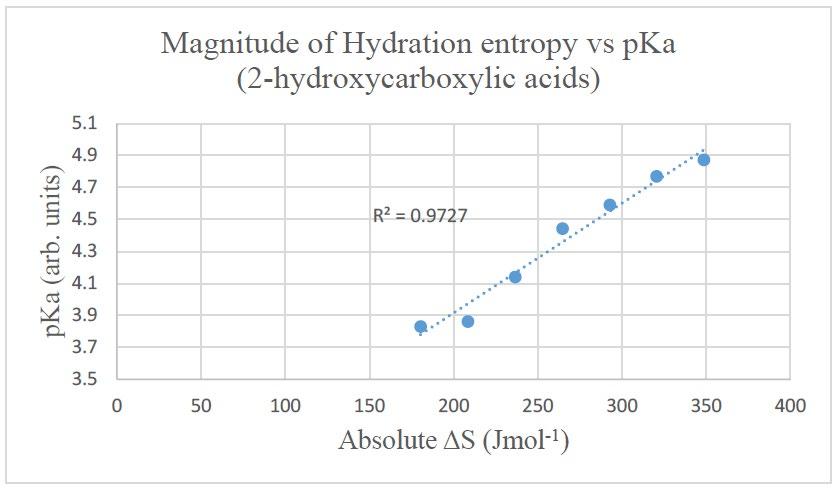
Ultimately, the most successful correlation came from analysis of the 2hydroxycarboxylic acid homologous series, where the uncleansed dataset provided a Pearson’s correlation coefficient of 0.986, which is a strong, positive correlation, with 97.27% of data explained by the line. Given that these homologues bear similarity to both the aliphatic n-carboxylic acids without the limitation imposed by the low aqueous solubility, accurate measures of pKa were collated against the same highly accurate calculations of hydration entropy, decreasing the uncertainty of the dataset. Notably, the addition of the alcohol functional group at Carbon position 2 led to an average decrease in pKa between the 2-hydroxycarboxyllic acid and its ncarboxylic acid alkyl counterpart, however, an systemically increased ΔS value (results table 5). These two trends can be justifiably attributed to the increased polarity of the OH group, which given a higher atomic radius, equally increases the solvation entropy. 29
7.4 Organic statistical analysis
In considering the regression statistical testing for the organic data, the calculated p value of 4.24E-5 is significantly lower than the alpha value of 0.025, indicating that there is statistical significance to the correlation (results table 6). In such case, the null hypothesis may be rejected and the alternate hypothesis accepted given that the organic data isolates a more valid causal relationship between hydration entropy and pKa than the inorganic data, by controlling more
variables. Perhaps more interestingly is the apparent negligibility of the identified coefficient of 0.00687 (3sf) which suggests that the increase in pKa is low compared to the increase in ΔS. While this could reasonably be construed to suggest that the ΔS is a negligible influence on pKa, this would be an invalid conclusion given that pKa is a logarithmic scale hence is expected to showcase a smaller absolute increase. The extremely lows standard error at approximately 1/13th of the coefficient indicates a lower spread of the data given that the residual of each datapoint is negligible, indicating a higher confidence interval in the sample.
29 G, Torsten, K, Holger, K. Volker, R., Andreas K, Udo. (2018). Carboxylic acids in aqueous solutions: Hydrogen bonds, hydrophobic effects, concentration fluctuations, ionization, and catalysis. The Journal of Chemical Physics. 149. 244503. 10.1063/1.5063877. pg 5-6
8. Conclusion 30
Ultimately, this study substantiates the relationship between hydration entropy of monoprotic acid anions and the tendency of the acid to ionise in solution. While this study was able to effectively isolate the correlation in this trend in the case of specific homologous series, it lacked the facilities and resources to extend this relationship definitively, or to specifically consolidate a relationship for HF. While it established a direct proportionality between hydration entropy and pKa it failed to quantitively derive this relationship amongst all aqueous systems.
Given the scope of this research and its societal and research implications, there are an array of necessary directions to further the understanding on the relationship between entropy and ionisation. Namely, to bias the thermochemical influence on pKa away from enthalpy and towards entropy, experimental data could be gathered in pseudo-aqueous systems at cryogenic temperatures. To calculate the pKa at these temperatures, the highest degree of accuracy could be obtained by using computer models, similar to those used in the RGUI programming for ΔS values. From this, the temperature dependence of pKa on ΔS could be established, which would innately consolidate the proportionality established in this report.
30 Record of Peer Review in S.3.1 Of Portfolio
References
1. ACS, ‘Molecule of the week archive: Hydrogen Fluoride’ ACS, 2021, pg. 1 https://www.acs.org/content/acs/en/molec ule-of-theweek/archive/h/hydrogenfluoride.html
2. A, Alwash. ‘Carboxyllic acid: Nomenclature, preparation, physical properties, and chemical reactions,’ 10.13140/RG.2.2.16402.48326. 2022 pg1-6
3. Ayotte, P, Herbert, M. and Marchland, P., ‘Why is hydrofluoric acid a weak acid?’, The Journal of Chemical Physics, vol. 123, no. 1, 2005, pg. 1-8
4. Dick, J. M. ‘An Introduction into CHNOSZ,’ 2022, https://cran.rproject.org/web/packages/C HNOSZ/vignettes/anintro.html#installingand-loadingchnosz
5. Giguere, P. and Turrell, S. ‘The Nature of Hydrofluoric Acid. A Spectroscopic Study of the Proton-Transfer Complex H3O+▪F-‘, Journal of the American Chemistry Society, vol. 102 no 1, 1980, pg. 5473-5477
6. Holmes, J. Jean, T. ‘The mass spectra of carboxylic acids–II: Fragmentation mechanisms in the homologous series HOOC(CH2)nCOOH’ Journal of Mass Spectrometry, 1970 , Volume 3 Issue 12
7. Joutsuka, T. and Ando, K. ‘Hydration Structure in Dilute Hydrofluoric Acid’ The Journal of Physical Chemistry, vol. 115, no. 1, pg. 671-677
8. Marcus, Y. ‘Thermodynamics of solvation ions,’ J. CHEM. SOC. FARADAY TRANS., 1991, 87(18), 29952999
9. Y. Marcus, ‘The hydration entropies of ions and their effects on the structure of water,’ J. Chem. Soc., Faraday Trans. 1, 1986,82, 233-242
10. McTigue, P. O’Donnell T. and Verity, B. ‘The determination of Fluoride Ion Activities in Moderately Concentrated Aqueous Hydrogen Fluoride’, The Australian Journal of Chemistry, vol. 38, no. 1, 1985, pg.1798-1807
11. National Centre for Biotechnology Information (2022). PubChem Compound Summary for CID 11005, Myristic acid. Retrieved August 21, 2022 from https://pubchem.ncbi.nlm.nih.gov/compou nd/Myristic-acid.
12. National Industrial Chemicals Notification Scheme, ‘Hydrofluoric acid (HF)’ NICNS, 2001, pg. 1-128, https://www.industrialchemicals.gov.au/sit es/default/files/PEC19-Hydrofluoricacid.pdf
13. National Institute of Standards and Technology, ‘NIST Chemistry Webbook,’ 2022 https://webbook.nist.gov/chemistry/ Accessed 21st August 2022
14. Pauling, L. ‘Why is Hydrogen Fluoride a weak acid? An answer based on a correlation of free energies with electronegativities’ Journal of Chemical Education, vol 33, no. 1, 1956, pg. 16-17
15. Simons, J.H. ‘Hydrogen Fluoride Catalysts’ Advances in Catalysts, vol.2, no.1 pg. 197-232
16. Torsten, G. Holger, K Volker, W. Andreas, R. Udo, K. ‘Carboxylic acids in aqueous solutions: Hydrogen bonds, hydrophobic effects, concentration fluctuations, ionization, and catalysis. The Journal of Chemical Physics.’ 2018, 149. 244503. 10.1063/1.5063877.
17. The Essential Chemical Industry, ‘Hydrogen Fluoride’ The Essential Chemical Industry-Online, 2017 pg. 1 ‘https://essentialchemicalindustry.org/che micals/hydrogen-fluoride.html’
18. Williams, R. ‘pKa data compiled by R. Williams,’ American Chemical Society, Organic Division vol 23, no.1 updated 2022 pg1-5
Acknowledgements
Undertaking this research project was equally difficult and rewarding, often garnering sardonic reactions from my non-scientific peers as they see my countless pages of seemingly nonsensical numbers. However, with the support from various key sources, this report has transformed from a simple assignment to a personal passion, with a bittersweet ending. Without doubt, my teacher supervisor, Ms Ritu Bhamra has been at centre of my support and assistance, whether it was conceptualising my research idea, fleshing it out into a practical methodology and especially answering my last-minute question, saving me from unwavering deadlines.
Moreover, my peers in the class as whole, especially Babu and Evan, have been foundational in balancing my extreme ideas with reasonable pragmatism and insightful approaches to my problems. Without their contribution I would likely still be pulling my hair out while trying to perform complex solvation calculations on non-aqueous solvents, or singing my fingertips with highly corrosive acids.
Externally, I would like to thank Professor Robbie Girling at the University of Reading for his contributions into the process of writing a scientific report and Jacob Marlow in providing me the theoretical insight into thermochemistry, which I would otherwise be lost without.
Finally, I would like to thank my fellow year 12 student, Alec Peng. Alec is unintentionally responsible for this report as a whole, given that my scientific premise was derived from one of his superficially simple questions in Chemistry class last year that I was simply unable to answer. Until now that is.
What is striking now that I have concluded this 9-month project is the shift in perspective it has offered me. In first endeavouring on this project, I was ambitious in trying to disprove complex particle physics, yet now having gained closure to a far simpler, but personal scientific query, I have found an immense satisfaction.
Appendix:
CHSNOZ coding:
Acid search was available through the command info(“acid”) from which 20 aliphatic ncarboxylic acids were available and 10 2-hydroxycarboxyllic acids.
31Specific thermochemical data, including ΔS, was gathered by gathering the unique identifier code result from the first command and performing the subcrt(“”) command 32. From this, tabular ΔS was displayed as a function of temperature, where only the value pertaining to 298.15K was obtained as to control temperature variable with respect to the pKa. 33
31 Ref to appendix item 1
32 Ref to appendix item 2
33 To ensure that this data was gathered in uniform units, the command E.units (“J”) and T.units (“K”) pre-set all calculations to degrees Kelvin and Jmol-1.
Appendix Item 1:
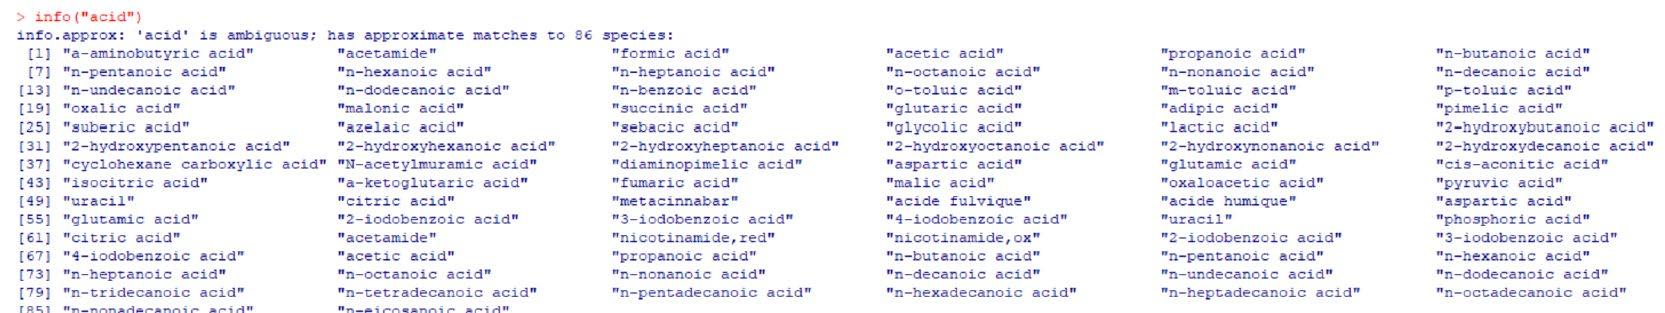
info(“acid”) display function:
Appendix item 2:

Subcrt(“”) display function
Appendix item 3:

units function
Appendix item 4:

Boxplot pertaining to the data cleansing of methanoic acid as an outlier – note the pKa value of methanoic acid is displayed beyond the 4.5 lower bound of the boxplot at 3.742
Appendix item 5: