20 minute read
Evolutionary Rate Dynamics of SARS-Cov-2 Variants of Concern Throughout the Covid-19 Pandemic


Evolutionary Rate Dynamics of SARS-Cov-2 Variants of Concern Throughout the Covid-19 Pandemic
Owen Yi – James Ruse Agricultural High School
Abstract
The rapid and widespread transmission of SARS-Cov-2 virus globally has led to substantial molecular evolution in the virus. These mutations have created lineages associated with greater transmissibility among other epidemiological changes and pose a significant global public health threat. In this study, I investigate how the evolutionary rate of SARS-Cov-2 has varied throughout the pandemic. My study included 12 isolates from each of the VOCs to date, 24 non VOC isolates and the Wuhan-Hu-1 reference sequence for a total of 85 sequences. Phylogenetic analysis using a model based on the uncorrelated relaxed clock was performed on these sequences to characterise the evolutionary rate dynamics throughout the pandemic. The results reveal a long but temporary period of rate acceleration around 1.5 times above the mean rate in the Alpha, Gamma and Omicron variants. I suspect that this episodic rate increase is a major factor in the emergence of new VOCs and detail how the “Chronic Infection Hypothesis” could explain the observed rate acceleration. These results reflect the importance of large genomic datasets built upon global genetic surveillance efforts in the understanding of the evolutionary dynamics of SARS-Cov-2 which allow for informed public health decisions.
Literature Review
Severe Acute Respiratory Syndrome coronavirus 2 (SARS-Cov-2) emerged in late 2019 and is the virus responsible for the coronavirus disease 2019 (Covid-19) pandemic. The Covid-19 pandemic has seen a huge number of SARS-Cov-2 genomes sequenced to understand the virus’s epidemiology. SARS-Cov-2 is an RNA virus with approximately 29000 base pairs. Compared to other RNA viruses, SARS-Cov-2 has a relatively slow mutation rate due to its proof-reading mechanisms e.g. nsp14-ExoN Robson et.al. (2020) which results in a relatively slower substitution rate versus other RNA viruses. Phylogenetic analysis has estimated the pandemic wide substitution rate is between 4.0 × 10⁻⁴ to 1.1 × 10⁻³ Duchene et al. (2020), Ghafari et al. (2022). Despite a relatively slower substitution rate, SARS-Cov-2 has accumulated a large number of mutations throughout the pandemic diverging into multiple different lineages.
Many lineages have developed mutations which affect transmissibility, disease severity, immune escape, diagnostic or therapeutic escape. These lineages which also have established significant transmission are designated as Variants of Interest (VOIs). VOIs that present a significant global health concern are labelled Variants of Concern (VOCs). The only VOCs having existed so far are Alpha, Beta, Gamma, Delta, Omicron. Only Omicron is a currently circulating VOC. New variants are especially a challenge to the global public health response and so it is of critical importance to understand the circumstances that give rise to VOCs.
During the pandemic, a huge number of sequenced genomes have been generated as part of a global genomic surveillance effort. These sequences are commonly uploaded to large public databases such as NCBI’s Genbank or GISAID (Global Initiative for Sharing Avian Influenza Data). This genomic data has been leveraged greatly to understand various aspects of SARS-Cov-2 including Covid-19 epidemiology Dellicour et al. (2021), divergence/origin times Pekar et al. (2021), and analyse the impacts of new mutations in the SARS-Cov-2 genome Kraemer et al. (2021) among other phylogenetic analyses. By studying how the evolution of SARS-Cov-2 affects its epidemiology, informed public health decisions can be made in how to respond to the emergence of new variants.
While the large progress has been made in understanding the evolution and epidemiology of SARS-Cov-2, there still remains many open questions. A large gap in our understanding of SARS-Cov-2 is the mechanism by which new variants emerge Tay et. al. (2022). Another relatively underexplored area is the way the evolutionary rate of SARS-Cov-2 has evolved throughout the pandemic. Here, “evolutionary rate” refers to the rate of fixed changes in the virus genome which means I will be measuring the substitution rate (the rate at which mutations become fixed in the genome) rather than purely mutation rate which refers to the frequency that mutations are made during replication. While there are many phylogenetic studies which have yielded estimates for the evolutionary rate of SARS-Cov-2 this only provides a single rate for the entire pandemic and do not describe in detail the rate variation during the pandemic e.g. if it has accelerated or decelerated. Furthermore, as SARS-Cov2 continues to evolve, new variants have appeared e.g. the Omicron variant and its sub variants Viana et. al. (2022). The Omicron variant is unique in the exceptionally large number of mutations it has compared to the reference sequence even in light of other VOCs. This prompts the question of how the Omicron variant has accumulated so many mutations and so suddenly without detection.
To infer certain parameters describing SARS-Cov-2 e.g. evolutionary rate, divergence times, modern phylogenetic analysis often utilises Bayesian inference. This type of phylogenetic analysis treats parameters in the phylogenetic models as random variables with underlying statistical distributions. These parameters are estimated by sampling using Monte Carlo Markov Chain (MCMC) algorithms to best account for the data e.g. sequences provided. Early phylogenetic analyses assumed a strict molecular clock proposed by Zuckerkandl and Pauling (1962, 1965). These models assumed that the evolutionary rate remained constant across all lineages. This assumption was later shown to be inaccurate in many cases and in the years since, more complex models have been developed to account for rate variation that may be present in a species’ evolution. One such model is the uncorrelated relaxed clock Drummond et.al. (2006). This model gives each branch an independent rate drawn from an underlying distribution e.g. Gamma, Lognormal. Because this model accounts for possible rate variation, it can be used in the phylogenetic analysis to detect rate variation in SARS-Cov-2 throughout the pandemic. This allows us to understand how the evolutionary rate has varied in each VOC to better understand the rate dynamics that occur in the emergence of new VOCs.
Scientific Research Question
How has the evolutionary rate of SARSCov-2 varied over the course of the pandemic and what are the possible reasons for the rate variation.
Scientific Research Hypothesis
Due to the quickly changing nature of the SARS-Cov-2 pandemic e.g. accumulation of mutations, changing population dynamics, I hypothesise it is likely that there will be some rate variation in the evolution of SARS-Cov-2.
Methodology
From the NCBI database (https://www.ncbi.nlm.nih.gov/), I looked for all SARS-Cov-2 full genomes that had 0 ambiguous characters throughout the date range of the entire pandemic. From this set, 12 random isolates were sampled for each Variant of Concern (VOC): Alpha, Beta, Gamma, Delta and Omicron. A further 24 isolates which were not of a VOC were randomly sampled. The reference sequence NC_045512 was also included in the dataset. This accounted for 85 genomes sampled for the phylogenetic analysis.
This sampling was preferred over sampling uniformly to ensure sufficient representation of variants less prevalent in the population such as Beta and Gamma. By ensuring there were 12 of each variant in the dataset, the rate characteristics in each variant clade could be explored to a sufficient resolution. The 24 non VOC isolates plus the reference sequence were included to help provide a baseline rate.
The 85 full sequences were aligned using the NCBI multiple alignment tool.
Bayesian phylogenetic inference using Markov Chain Monte Carlo (MCMC) analysis was performed on the 85 sequence dataset using BEAST v.1.10.4. The sequences were divided into taxon sets based on variants. The GTR+Γ4 substitution model was chosen as it leaves all parameters free and accounts for rate heterogeneity. Because the case numbers of Covid-19 fluctuated in waves during the pandemic, the population size model had to be non-parametric and so the GMRF skyride model was chosen. An uncorrelated relaxed clock was used to test for rate variation throughout the evolution of SARS-Cov-2 during the pandemic. MCMC chain length was set to 3 × 10⁷ steps logging every 1 × 10³ steps.
Convergence of all parameters (Effective Sample Size > 200 with burnin of 10%) was verified using Tracer v.1.7.2. A Maximum Clade Credibility Tree was generated using TreeAnnotator v1.10.4 and displayed using FigTree v1.4.4.
To confirm the validity of results and reduce bias, the analysis was rerun using resampled data with the same sampling methodology and BEAST model settings.
Results
According to the results of this phylogenetic analysis, I measured the mean substitution rate for the SARS Cov 2 virus to be 7.64 × 10⁻⁴ substitution per site per year (s/s/y) with a 95% Highest Posterior Density (HPD) interval of (6.77 × 10⁻⁴, 8.52 × 10⁻⁴). The coefficient of variation for the substitution rate was 0.35 with a 95% HPD of (0.20, 0.51) revealing moderate rate variation.
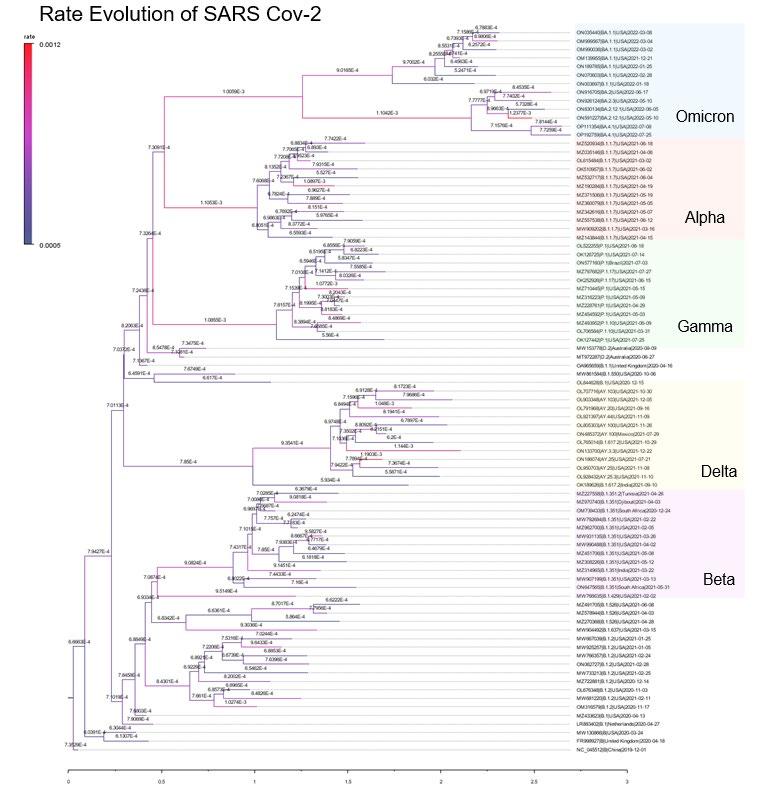
Figure 1 shows the Maximum Clade Credibility (MCC) tree. Clades representing Variants of Concern are highlighted. The branches are labelled with the estimated substitution rate for each branch and are colour coded with red representing a faster rate while blue representing a slower rate. The scale axis represents the time in years since the root of the tree. Table 1 shows the estimated substitution rates for an inferred Most Recent Common Ancestor node
Figure 1: Maximum Clade CredibilityTree containing 85 isolate genomes. Sequences are labelled by Pango Lineage | Geo location | Collection Date.

Table 1: Branch substitution rate of the Most Recent Common Ancestor for each variant clade.
Discussion
Evaluation of Phylogenetic Model
Model Strengths
Analysis of the log file in Tracer showed all parameter estimates had reached convergence which helps reduce random error in the MCMC analysis. To test the reliability of this approach, the analysis was rerun with the same phylogenetic model applied to a different dataset of SARS-Cov-2 genomes but resampled using the same sampling procedure for consistency. The parameter estimates were compared with the original model to confirm robustness of the model under similarly sampled but distinct datasets. The parameter estimates had good agreement between the first analysis and rerun analyses indicating robustness of the model and its estimates (Figure 2).

Figure 2: Marginal density plots for the mean rate in both analyses
To confirm the external reliability of these results, I compared the topology of my MCC tree with the NextStrain tree which used the GISAID database. Both trees shared similar topologies for example, the Omicron variant being related to the Alpha variant (being in the same broader clade) but with The Most Recent Common Ancestor (TMRCA) between Alpha and Omicron being very early in the pandemic.

Figure 3: NextStrain SARS-Cov-2 Phylogeny
Moreover, the analysis suggests a mean substitution rate of 7.64 × 10⁻⁴ s/s/y (95% HPD: 6.77 × 10⁻⁴, 8.52 × 10⁻⁴. This is consistent with other published results which report rates of 6.7 × 10⁻⁴ to 8.8 × 10⁻⁴ (Duchene et al. 2020) and 4.0 × 10⁻⁴ to 1.1 × 10⁻³. (Ghafari et al. 2022).
Model Limitations
Although the average substitution rate and tree topology agree with external literature, the divergence times are not accurate based on the earliest documented samples for each variant. While the earliest documented sample dates fall within the 95% HPD interval estimates for Alpha, Gamma and Delta, the divergence time estimates for Beta and Omicron are very inaccurate overestimating the divergence time for Beta and underestimating for Omicron.
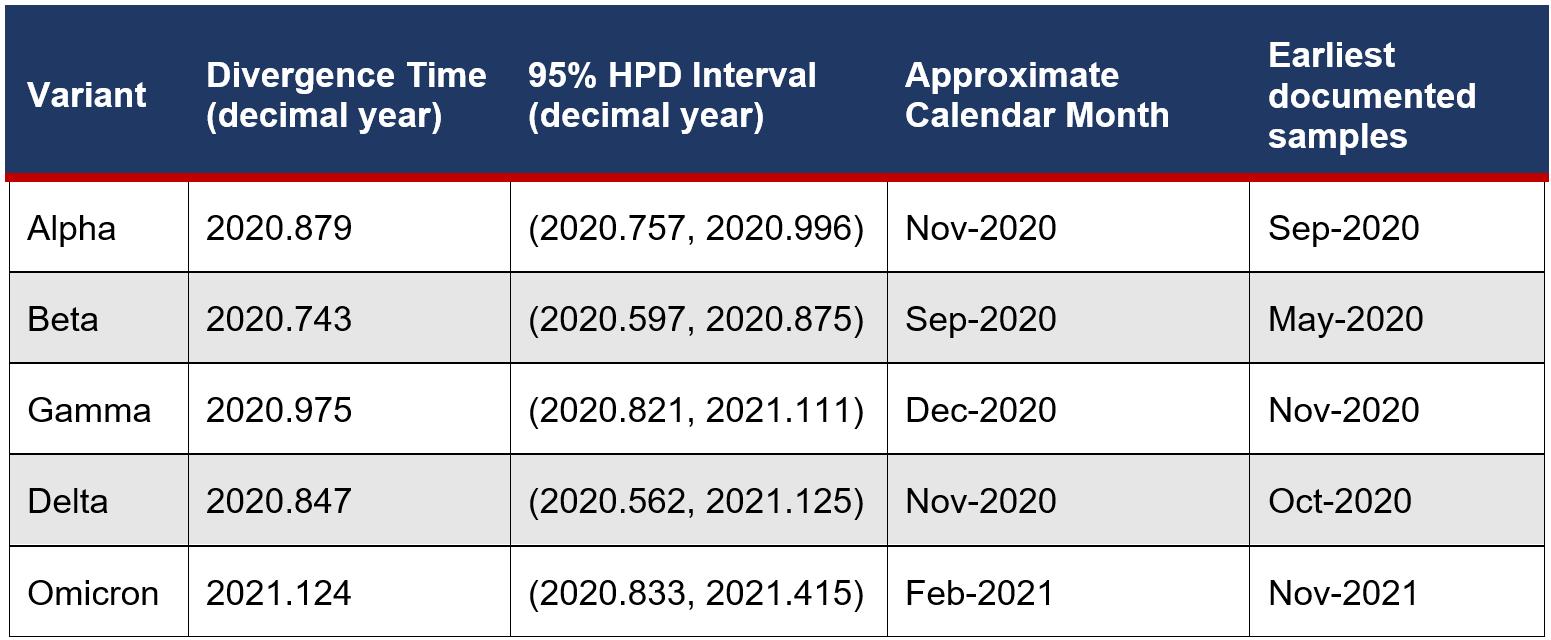
Table 2: Divergence time estimates of variants compared to actual earliest documentation
from WHO: https://www.who.int/activities/tracking-SARS-CoV-2-variants
The biggest limitation to the results however, is the wide confidence intervals attached to the rate estimates on all the branches. HPD intervals can be narrowed by sampling a larger number of nucleotide sites; however since the analysis used the entire genome length, I am limited by the number of sites on the SARS-Cov-2 genome ~29000 nucleotides. Moreover, the uncorrelated relaxed clock is highly parameter rich which could contribute to more uncertainty in branch rate estimates. Due to the large 95% intervals, there is considerable overlap between the posterior distributions for the branch rates. For most internal branches, the wide uncertainty makes it difficult to determine if the rate variation is noise or if it is reflective of a genuine variation. Thus, my conclusions are based mostly on the clearer extreme cases of rate variation such as the episodic but highly accelerated rates in the TMRCA branches.
Evolutionary Rate Characteristics of SARS-Cov-2
Rate Acceleration in VOCs
From Figure 1, the VOCs Omicron, Alpha and Gamma all appear to have had a long period of faster than normal evolution early on in their respective evolution. The branch rates for the MRCA for each variant is listed in Table 1 revealing that Omicron, Alpha and Gamma, 34%, 45% and 43% increase in substitution rate relative to the global mean rate. Similar to these findings of accelerated rates in VOCs, Rambaut et. al. (2020) found accelerated substitution rate in the Alpha variant. Although the Beta and Delta variants also experienced a faster substitution rate early on in their evolution, the rate increase is not as extreme compared to the other three VOC. Moreover, the faster mean rate of the Delta MRCA still falls within the 95% HPD of the global mean rate so it is not a substantial increase.
What is also interesting is that these rate increases are episodic and only appear in the internal branches of the variant clades rather than persisting throughout all the tips. This suggests that the increases in the substitution rate are due to temporary environmental factors rather than fixed genetic changes e.g. mutations to the replication or proof-reading machinery. This result is in agreement with Tay et. al. (2022) concluding that “episodic, instead of long term, increases in the substitution rate underpin the emergence of VOCs”. However, unlike the several fold faster rates in VOC compared to the background rate found by Tay et. al. our analysis shows much smaller rate increases (see Table 1). This discrepancy could be explained by purifying selection where there is a time lag for natural selection to remove deleterious mutations Ghafari et al. (2022) and so later analyses may find slower substitution rates.
These episodic accelerated substitution rates help explain how some of these variants for example the Omicron variant (which has accumulated 50 mutations Martin et. al. (2021) before being first identified) could have mutated so much without being detected.
Chronic Infection Hypothesis” Provides a Possible Account for Rate Acceleration in VOCs.
A plausible theory which accounts for these episodic rate increases explains that “co-infection and subsequent genome recombination” Ou et. al. (2022) is driving the accelerated evolution of Covid-19 variants. Recombination occurs when two different strains co-infect a cell and as a result, genetic material is shuffled around in the virus progeny. Yi et. al. (2020) has indicated that SARSCov-2 has also evolved through recombination as well as simple mutation, proving that recombinant genomes were present in the Covid-19 population.
Together this evidence supports the “chronic infection hypothesis” Chaguza et. al. (2022). The “chronic infection hypothesis” explains the long fast branches in Figure 1. Chronic infection in immunocompromised individuals provides the right environmental conditions for accelerated evolution. This is because lengthy chronic infections provide the virus both more time and a weaker immune system which “may allow an exploration of the SARS-CoV-2 fitness landscape” Harari et. al. (2022) producing the right selective pressures to mutate more. Moreover, patients with chronic infection are also more likely to develop co-infections with multiple Covid-19 strains increasing the likelihood of recombination. This also accounts for how these mutations could remain undetected because genetic sequencing along the transmission chains of acutely infected individuals would fail to detect intrahost evolution.
However, this hypothesis alone is insufficient to explain all the rate variation in the phylogenetic tree. For example, the Delta and Beta variants did not experience substantial rate acceleration and so may have evolved through simple mutations. Some tip branches scattered across all variant clades also appear to have an accelerated rate although it is unclear if it is genuine rate variation or due to the stochasticity of the MCMC estimation.
Improvements and Further Inquiry
Improvements
More non-phylogenetic data could be incorporated into the model to improve the accuracy of rate estimates. For example, the age of the different variants based on the first identified samples could be specified in the model to fix divergence times for different variant clades. Since genetic distance is the product of substitution rate and divergence time, specifying accurate divergence times could lead to more accurate rate estimations.
Additionally, different tree priors e.g. Bayesian skyline, Yule process speciation could be tested to analyse if these results still hold under different models Möller et. al. (2018). The tree prior model with the highest statistical fit could be compared using a Log Bayes Factor to inform which tree prior best represents the evolutionary process of SARS-Cov-2.
Further Inquiry
To better test the “Chronic Infection Hypothesis”, genome sequences stratified by whether or not the infection was chronic. The same evolutionary rate analysis could be used on both data sets and compared to see if there is any difference in rate dynamics from SARSCov-2 in chronically ill patients. This data may be harder to find as infection period may not be labelled to sequences for genome databases.
Genomic surveillance could be extended to serially sample Covid-19 sequences from chronically infected patients to analyse in real time the evolution of Covid-19. Phylogenetic analysis could be used to explore the specific intrahost evolution of Covid-19.
Specific mutations could be analysed in different isolates to explore if changes in the underlying mutation rate due to genetic factors e.g. replication/proofreading mechanisms is contributing to the observed rate variation. Coronaviruses are able to “proof-read and remove mismatched nucleotides during replication and transcription” Robson et.al. (2020). While most mutation analysis is focused on the spike proteins as these can affect transmissibility and vaccine efficacy, mutations on the SARSCov-2 proof-reading complex could be analysed in tandem with phylogenetic analysis to understand the genetic factors that can lead to rate variation.
Conclusion
In this paper, I found that in the evolution of certain Variants of Concern of the SARS-Cov-2 virus namely the Alpha, Gamma and Omicron variants displayed a noticeable and long period of accelerated substitution rates early on in their emergence before the substitution rate slowed back down towards the mean level upon establishing in the population. The other VOCs Beta and Delta also displayed some rate acceleration early in their evolution however to a much lesser extent. I note that the analysis is limited by the wide HPD intervals attached to the branch rate estimates which makes it harder to discern between genuine rate variation and noise for most internal branches. I point to the “Chronic Infection Hypothesis” as a possible explanation for the observed rate variation. Under this hypothesis, prolonged infection in immunocompromised patients allows the virus to accumulate mutations faster leading to the emergence of new variants. This model provides a good explanation for the long periods of rate acceleration which occur immediately before the emergence of the Alpha, Gamma and Omicron variants.
More genomic surveillance especially to more densely sample SARS-Cov-2 sequences during prolonged infection is required to further investigate intrahost evolution to test the “Chronic Infection Hypothesis”. To investigate other possible causes of the observed rate evolution, mutational analysis of genes in the SARS-Cov-2 genome associated with viral replication such as proof-reading could be corroborated against changes in substitution rate to test if genetic factors are contributing to the rate variation.
These results reflect the importance of large public genomic datasets built upon global genetic surveillance efforts in the understanding of the evolutionary dynamics of SARS-Cov-2. Further analysis on the exact circumstances under which new Variants of Concern arise will be crucial to the global health response to the Covid-19 pandemic to prepare for the emergence of new variants of epidemiological significance.
Acknowledgements
I thank my research mentors Dr. Carina Dennis, Dr. Jiaojiao Li and Dr. Mathieu Fourment for their invaluable advice during discussions to answer technical questions and provide useful suggestions.
References
Chaguza, C et. al. 2022. “Accelerated SARS-CoV-2 intrahost evolution leading to distinct genotypes during chronic infection”. MedRxiv, 2022.06.29.22276868; doi: 10.1101/2022.06.29.22276868
Drummond, Alexei J et al. 2002. “Estimating mutation parameters, population history and genealogy simultaneously from temporally spaced sequence data.” Genetics, vol. 161, no. 3. pp, 1307-20. doi:10.1093/genetics/161.3.1307
Drummond, Alexei J et. al. 2006. “Relaxed phylogenetics and dating with confidence.” The Public Library of Science Biology, vol. 4, no. 5. e88. doi:10.1371/journal.pbio.0040088
Duchene, S. et.al. 2020. “Temporal signal and the phylodynamic threshold of SARSCoV-2”, Virus Evolution, vol. 6, no. 2. https://doi.org/10.1093/ve/veaa061
Fourment, M. Darling, A.E. (2018). “Local and relaxed clocks: the best of both worlds”. PeerJ, 6:e5140 https://doi.org/10.7717/peerj.5140
Ghafari, M. et. al. 2022. “Purifying Selection Determines the Short-Term Time Dependency of Evolutionary Rates in SARS-CoV-2 and pH1N1 Influenza”, Molecular Biology and Evolution, vol. 39, no. 2. msac009. https://doi.org/10.1093/molbev/msac009
Harari, S. Tahor, M. Rutsinsky, N. et al. 2022. “Drivers of adaptive evolution during chronic SARS-CoV-2 infections”. Nature Medicine, vol. 28, pp. 1501–1508. https://doi.org/10.1038/s41591-02201882-4
Hu, B et. al. 2021. “Characteristics of SARS-CoV-2 and COVID-19.” Nature Reviews. Microbiology, vol. 19, no. 3, pp. 141-154. doi:10.1038/s41579-020-004597
Kayla, M.P. Lauring, A.S. 2018. “Complexities of Viral Mutation Rates”. Journal of Virology, vol. 29, no. 14, pp. DOI: https://doi.org/10.1128/JVI.01031-17
Lynch, M. 2010. “Evolution of the mutation rate.” Trends in genetics, vol. 26, no. 8, pp. 345-52. doi:10.1016/j.tig.2010.05.003
Martin, D et. al. 2022. “Selection analysis identifies unusual clustered mutational changes in Omicron lineage BA.1 that likely impact Spike function”, BioRxiv. https://doi.org/10.1101/2022.01.14.47638 2
Minin, V. N. et.al. 2008. “Smooth Skyride through a rough Skyline: Bayesian coalescent-based inference of population dynamics.” Molecular Biology and Evolution, vol. 25, no. 7, pp. 1459-1471. doi:10.1093/molbev/msn090
Möller, S et al. 2018. “Impact of the tree prior on estimating clock rates during epidemic outbreaks” Proceedings of the National Academy of Sciences, vol. 115, no. 16, pp. 4200-4205. doi.org/10.1073/pnas.1713314115
NCBI. 2022. “NCBI Virus”, https://www.ncbi.nlm.nih.gov/labs/virus/vs si/#/virus?SeqType_s=Nucleotide
Nextstrain. 2022. “Genomic epidemiology of SARS-CoV-2 with subsampling focused globally over the past 6 months”, https://nextstrain.org/ncov/gisaid/global/6 m
Ou, J. Lan, W. Wu, X. et. al. 2020. “Tracking SARS-CoV-2 Omicron diverse spike gene mutations identifies multiple inter-variant recombination events”. Signal Transduction and Targeted Therapy, vol. 7, no. 138. https://doi.org/10.1038/s41392-02200992-2
Rambaut, A. Loman, N. Pybus, O et. al. 2020 (CoG-UK). “Preliminary genomic characterisation of an emergent SARSCoV-2 lineage in the UK defined by a novel set of spike mutations.” https://virological.org/t/preliminarygenomic-characterisation-of-anemergent-sars-cov-2-lineage-in-the-ukdefined-by-a-novel-set-of-spikemutations/563
Robson, F et al. 2020. “Coronavirus RNA Proofreading: Molecular Basis and Therapeutic Targeting.” Molecular cell, vol. 79, no. 5, pp. 710-727. doi:10.1016/j.molcel.2020.07.027
Tavaré, S. 1986. “Some probabilistic and statistical problems in the analysis of DNA sequences.”
Tay, J H et al. 2022. “The Emergence of SARS-CoV-2 Variants of Concern Is Driven by Acceleration of the Substitution Rate.” Molecular biology and evolution vol. 39, no. 2: msac013. doi:10.1093/molbev/msac013
Viana, R., Moyo, S., Amoako, D.G. et al. 2022 “Rapid epidemic expansion of the SARS-CoV-2 Omicron variant in southern Africa”. Nature, vol. 603, pp. 679–686 (2022). https://doi.org/10.1038/s41586022-04411-y
WHO. 2022. “Tracking SARS-Cov-2 variants” https://www.who.int/activities/trackingSARS-CoV-2-variants
Yang, Z, Rannala, B. 2012 “Molecular phylogenetics: principles and practice” Nature Reviews Genetics, vol. 13, pp. 303–314. https://doi.org/10.1038/nrg3186
Yi, H. 2020. 2020. “2019 Novel Coronavirus Is Undergoing Active Recombination”. Clinical Infectious Diseases, vol. 71, no. 15, pp. 884–887, https://doi.org/10.1093/cid/ciaa219
Yi, K., Kim, S.Y., Bleazard, T. et al. 2021. “Mutational spectrum of SARS-CoV-2 during the global pandemic”. Experimental and Molecular Medicine, vol. 53, pp. 1229–1237. https://doi.org/10.1038/s12276-02100658-z
Zuckerkandl E, Pauling L. 1962. “Molecular disease, evolution and genetic heterogeneity”. Horizons in biochemistry, pp. 189–225.
Zuckerkandl E, Pauling L. 1965. “Evolutionary divergence and convergence in proteins.” Evolving genes and proteins. New York: Academic Press. p. 97–166.
Appendix
Google Drive Link to Supplementary Data