20 minute read
Testing the effect of environmental conditions on photosynthesis production


Testing the effect of environmental conditions on photosynthesis production
Lena Dayil – Lurnea High School
Abstract
Photosynthesis is important as it sustains life by releasing oxygen into the atmosphere and provides energy for food chains which is the reason behind the conduction of this experiment. The investigation focuses on the environmental factors of temperature, sunlight vs shade and the colour of the plants (chlorophyll concentration) and their effect on the rate of photosynthesis when tested through the floating leaf disk assay. The plants were exposed to different environmental conditions in order to obtain accurate and precise results. The results were analysed through using mean, standard deviation and also through the statistical analysis. Main results included that higher temperatures allow for an increased rate of photosynthesis, better sunlight/light intensity also increases photosynthesis rate, while the colour of the plant needs to be a darker green as it has a higher chlorophyll concentration which increases photosynthetic rate. Overall, It allows individuals to know under which environmental conditions plants grow best in order to have a higher photosynthesis rate, however for the results to be comprehensive more environmental results need to be tested. Further investigations need to be carried out in order to confirm the accuracy, reliability and validity of the results.
Literature review
All living organisms need oxygen to grow and reproduce. Plants do not consume food like humans and animals, instead they convert light energy, water and carbon dioxide into oxygen and sugar. Plants make their own energy through a process called photosynthesis. This is important in agriculture as it provides nutrients for the crop and in photosynthesis, plants constantly absorb and release gases in a way which creates sugar for food. Plants convert light energy, water, and carbon dioxide into oxygen and sugar. They can then use the sugar as an energy source to fuel their growth.
Photosynthesis provides energy that drives all the plants metabolic functions, it is the main source of food on earth which provides us with fibre, medicine and fuel, it releases oxygen which is the most important element for the survival of all life. It is also the most significant part of the food chain as many animals have plants as their only food source.
Photosynthesis takes place in the chloroplasts within the plant's cells. The chloroplasts contain special pigments that react to light. Chlorophyll is one of the pigments that can absorb light in the blue and red spectrum from the visible light spectrum. Chlorophyll does not absorb light in the green spectrum of light but reflects it instead. This is why leaves with chlorophyll usually appear green. During the first part of photosynthesis the lightdependent reaction chlorophyll and other pigments harness the light energy to produce NADPH (nicotinamide adenine dinucleotide phosphate) and ATP, (triphosphate) which are two types of energy-carrier molecules. At the same time, water is split into oxygen (O2) and protons (H+). The next stage is lightindependent and is often referred to as the dark reaction. In this step, the two energy-carrier molecules, NADPH and ATP, are utilised in a series of chemical reactions called the Calvin cycle. In the Calvin cycle, the plants take carbon dioxide (CO2) from the air and use it to ultimately make sugars such as glucose or sucrose. These sugars can be stored for later use by the plant as an energy source to fuel its metabolism and growth.
Photosynthesis is beneficial in aquaculture as it supplies fish ponds with oxygen, removes carbon dioxide and removes wastes such as nitrates, ammonia and urea. Photosynthesis is slower underwater as it is difficult for the light to reach underneath the water in places such as oceans. The most important factor of photosynthesis in agriculture is food production. The world’s demand for food is constantly increasing, this is why it is important for scientists and farmers to understand photosynthesis and explore the potential improvements of photosynthesis that can cause faster plant growth. If farmers find a way to increase the rate of photosynthesis then that will also increase the yield of the crop which is why the rate of photosynthesis and this topic are highly significant.
In the near future the demand for food will be enormous. The rising human population and the changing patterns in land use mean that the world's food production rates will need to be increased by at least 50% by 2050. Most of this extra demand comes from developing countries and grain demand is also expected to increase highly over the next two decades.
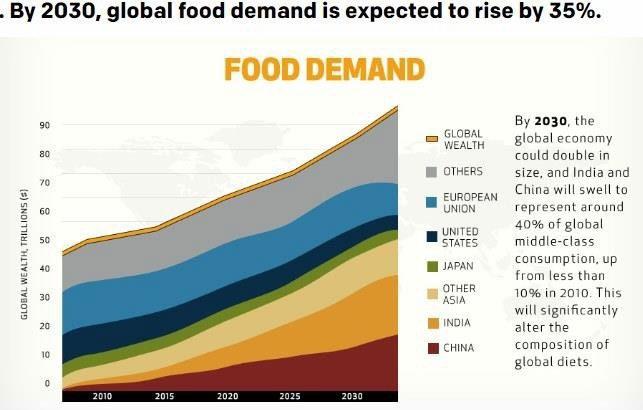
Figure 1: graph representing the increase in food demand within a range of countries
Light intensity
Light intensity impacts the rate of photosynthesis as higher light intensity means more light called "photons" are available to hit the leaves of the plant. The rate of photosynthesis can increase when there is more light available as it will allow the plant to drive all the reactions that are necessary for photosynthesis to occur. Too much light for a plant can also be negative causing dryness meaning that light intensity has a limit.
Literature data
2021. [online] Available at: <http://www.esalq.usp.br/lepse/imgs/cont eudo_thumb/How- does-the-level-of-lightaffect-the-rate-of-photosynthesis.pd> [Accessed 8 December 2021].
Explains the environmental condition of light intensity and how it is related to the rate of photosynthesis, (the improvements in the conversion of light energy has been the central part of a crop's improvement.)
Temperature
The chemical reactions which allow photosynthesis to occur, and the combining of carbon dioxide and water for the production of glucose are all controlled by enzymes. The rate of photosynthesis is affected by temperature.
Low temperatures cause the rate of photosynthesis to be decreased and leads to a decrease in glucose production causing stunted growth in the plants. Medium temperatures allows the enzymes to work at optimum levels leading to an increase in photosynthesis rates while High temperatures causes the enzymes to denature, not work efficiently and makes them lose their shape leading to a decline in the photosynthesis rate.
Scientific research question
‘Which type of environmental factors (sunlight vs shade (light intensity), temperature and colour of plant) affect the rate of photosynthesis in different plant seedlings (Chilli, rose apple plant and parsley) when tested through the floating leaf disk assay.’
Scientific hypothesis
‘Without optimal amounts of sunlight, appropriate lighting and optimal temperature, a plant's photosynthesis rate will decrease.’
Methodology
Choosing and growing appropriate plants for investigation.
The plant that was chosen includes chilli which was tested through temperature, light intensity and the colour of the plant/chlorophyll concentration. Species were grown in different conditions over a period of 9 weeks in spring 2022 in sample groups of 10 seedlings per condition. The floating leaf disk assay is found on the sciencebuddies website, (https://www.sciencebuddies.org/) which was reconstructed and adapted in order to create a new experiment. For detailed methods, visit the appendixes.
Floating leaf disk assay
The floating leaf disk assay utilises the rate at which oxygen is produced or consumed as a measure of the processes of photosynthesis. Disks are punched from leaf tissue and a vacuum is used to replace air in the spongy mesophyll with liquid, making the disks sink. As photosynthesis takes place in light, oxygen is produced. The accumulating gas makes the disks buoyant and they float. The rate of photosynthesis in the leaf disks is calculated after determining the time required for submerged leaf disks to float.

Figure 2. Leaf assay picture
Analysis of results
The results were analysed using both descriptive and inferential, using appropriate statistical methods (mean, standard deviation and student's T test) using Microsoft Excel 365.
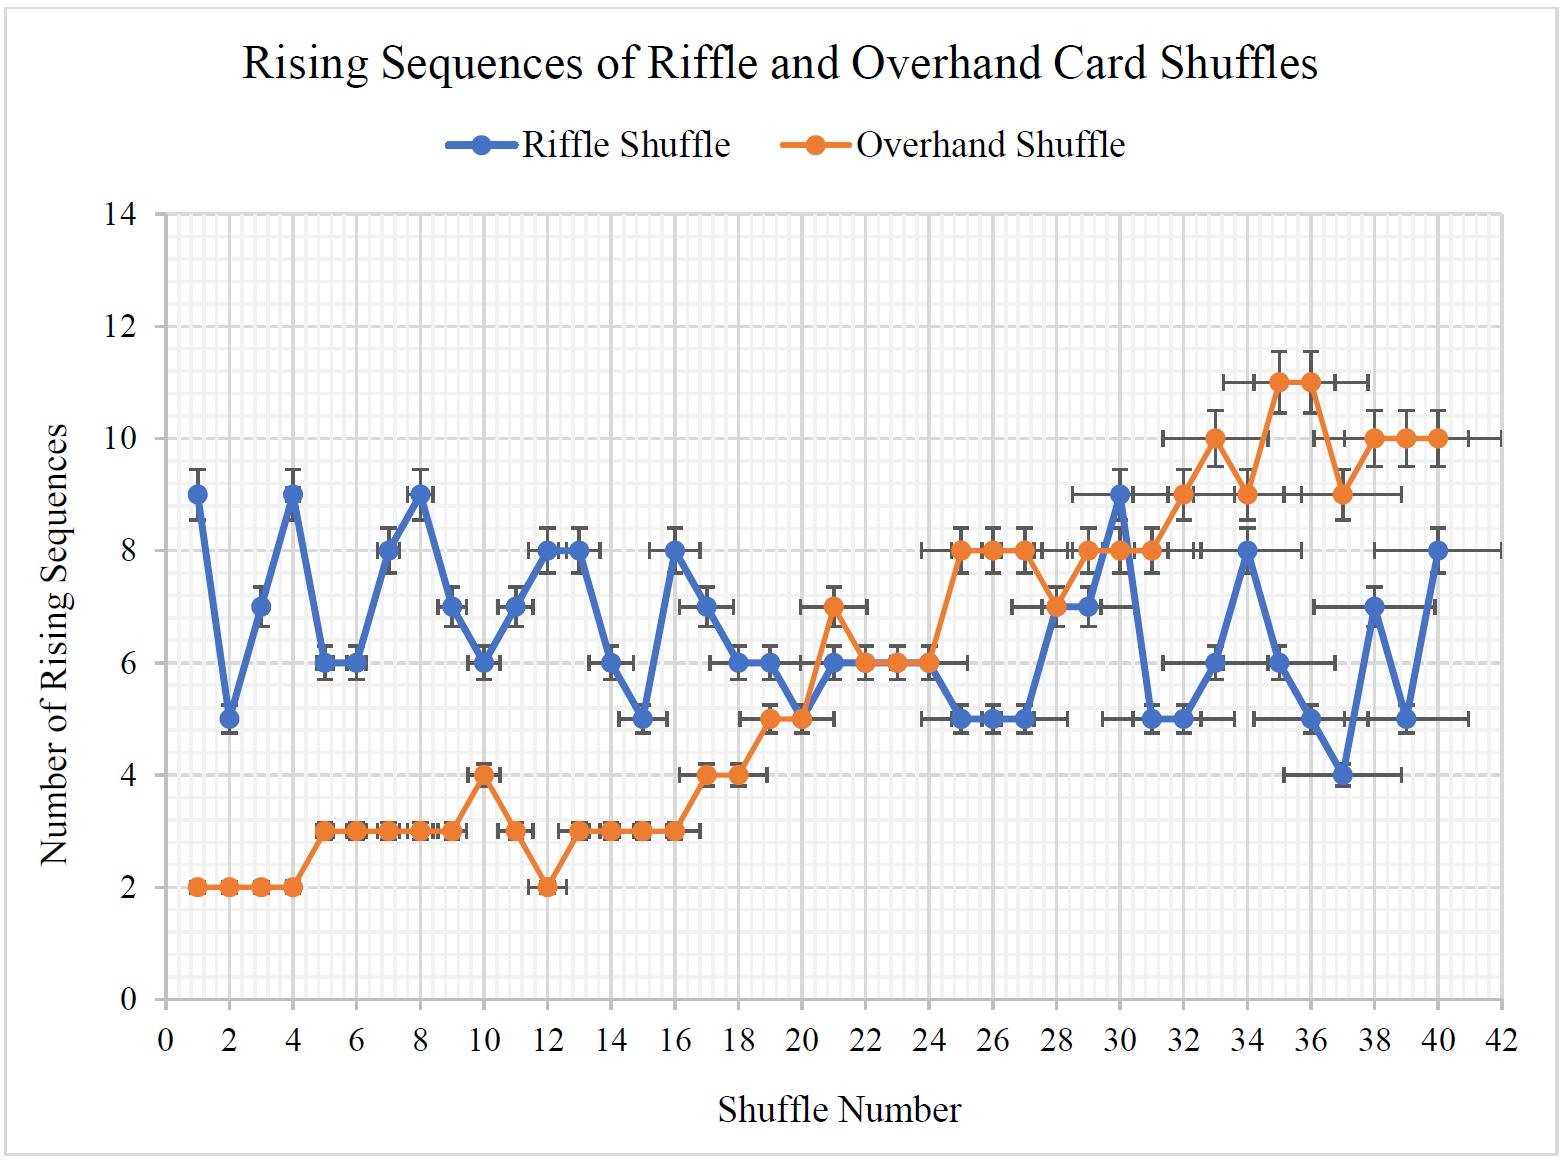
The results have been analysed by comparing them to the results of other individual’s experiments which have similar qualities and features to this investigation and also using appropriate statistical tests to determine the significance of the results. Figure 2 provides an example of results done by another individual who did a similar experiment to this by using the floating leaf disk assay which is highly useful for the data analysis. A good way to collect data is to count the number of floating disks at the end of a fixed time interval; for example, after every minute until all disks are floating. The time required for 50% of the leaves to float represents the Effective Time (ET50). ET50 can be determined by graphing the number of disks floating over time, as shown in Figure 2. An ET50 of 11.5 minutes, for example, as shown in Figure 2, would mean that after 11.5 minutes, 50% of the leaves (5 out of the 10) floated on top of the baking soda solution. In the context of oxygen production, you could also say that an ET50 value of 11.5 minutes means that it took 11.5 minutes to produce enough oxygen to make 50% of the leaf disks float.

Figure 3: Example results for a different floating leaf disk assay. The graph shows the time on the x-axis and the number of floating leaves on the y-axis. The Effective Time (ET50) represents the time required for 50% of the leaves to float. By extrapolating from the graph, the 50% floating point in this graph is about 11.5 min.
Results
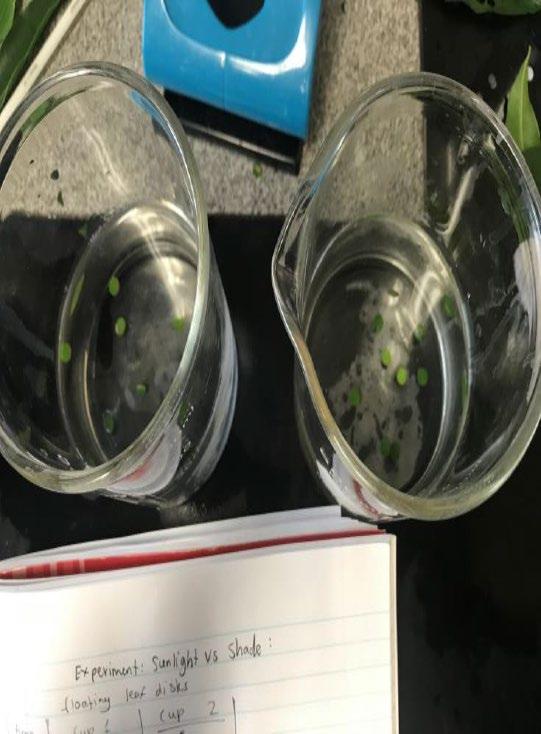
Figure 4: Experimental setup for the sunlight vs shade experiment.

Figure 5: experimental setup for the first experiment (temperatures of hot, cold and room.)
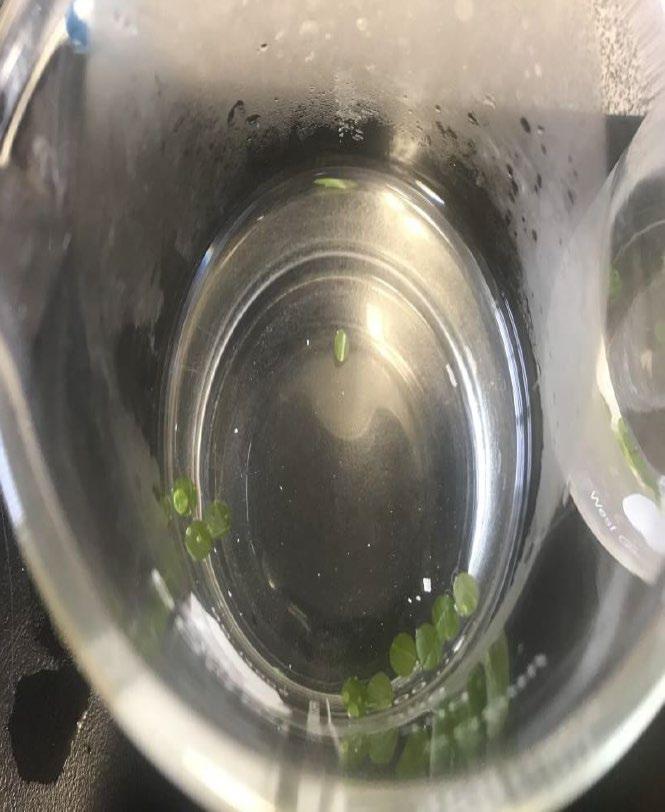
Figure 6: The 9 floating leaf disks are visible/can be counted in this image in the hot water temperature of (37 degrees) which both reduces bias and increases accuracy of results.

Figure 7: Graph illustrating all the experimental results (trials for each environmental condition), including the mean/average and standard deviation.

Figure 8: Treatment 1 (left) is hot water (37 deg), Treatment 2 (middle) is cold water (10 deg) and treatment 3 (right) is room temperature (20 deg.) Through analysis of this graph, it is clearly evident that the higher the temperature goes, the higher the rate of photosynthesis is.
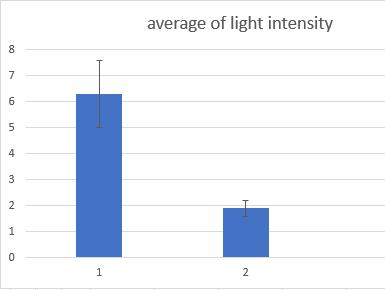
Figure 9: Treatment 1 (left) illustrates the results for sunlight exposure of the plant, while treatment 2 (right) exposes the results for the plant which was in the shade. Through analysing this graph, it is clearly evident that plants which are exposed to sunlight produce an increased photosynthesis rate.

Figure 10: Demonstrates the colour of the plant/chlorophyll concentration and the role it plays in photosynthesis production. The lighter (orange/yellow plant) on the right of the graph highlights decreased photosynthesis rate, while the darker green plant (which has the higher chlorophyll concentration) on the left of the graph, has an increased and higher photosynthesis rate production than the lighter coloured plants.
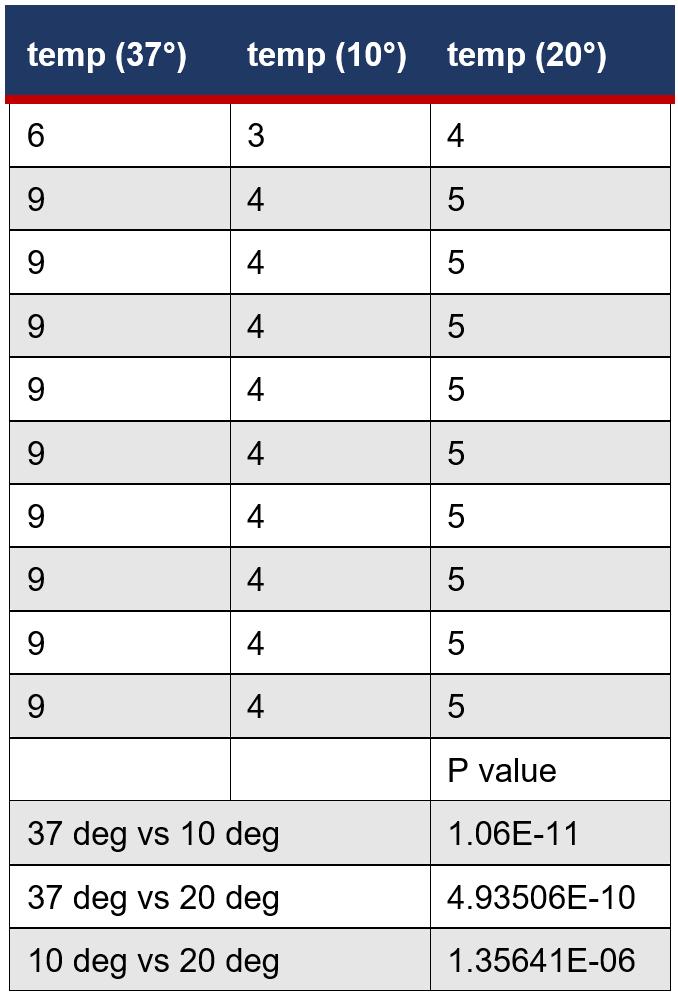
Figure 11: Statistical test of the temperatures
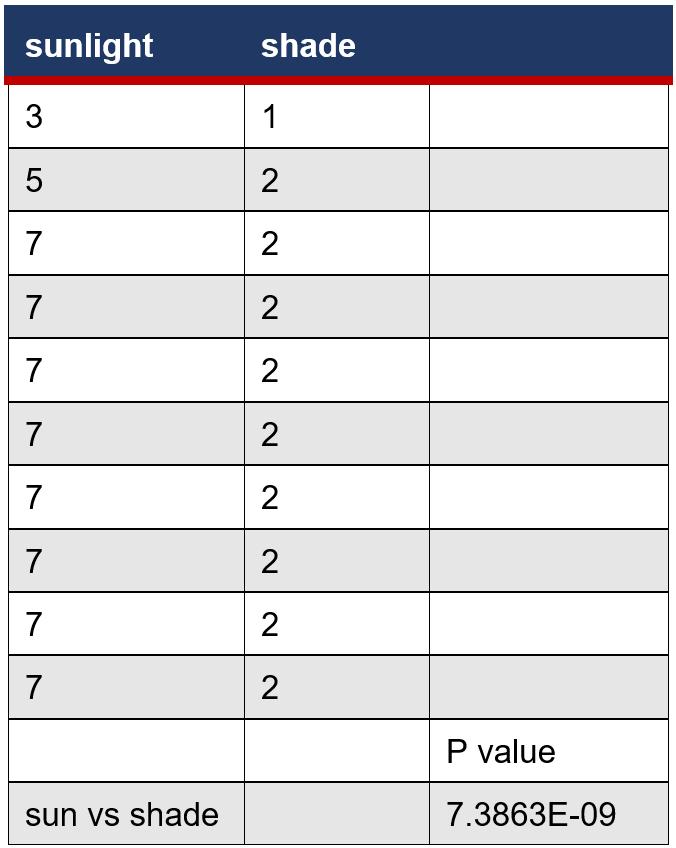
Figure 12: Statistical test of results from sun vs shade
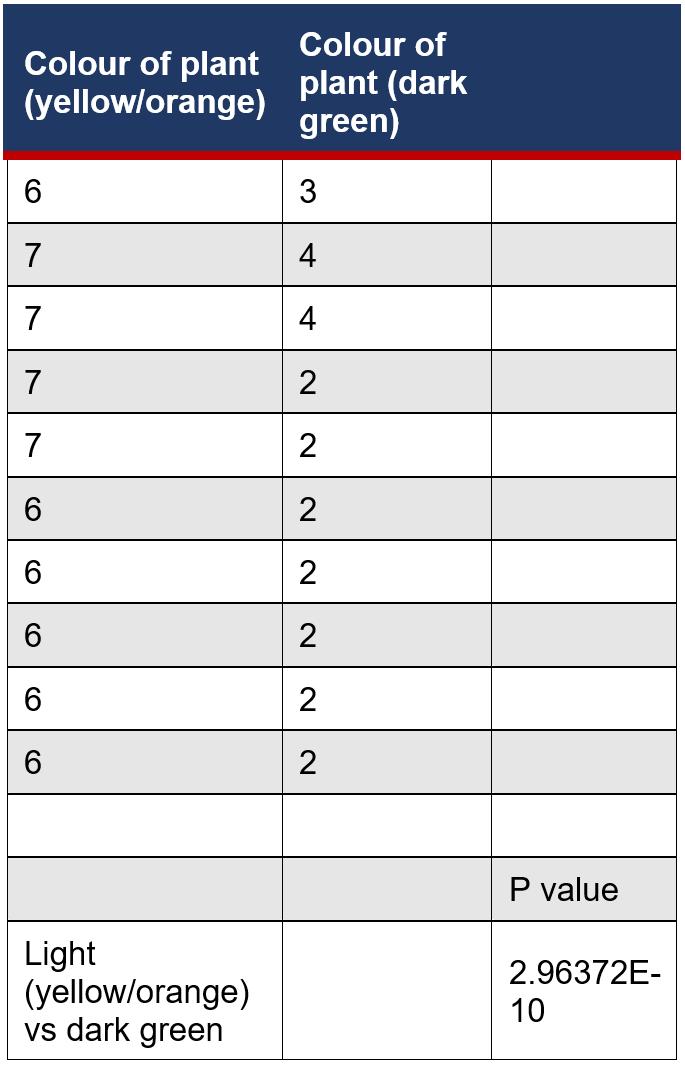
Figure 13: Statistical test of the colour of plant/chlorophyll concentration
Discussion
Through analysing and interpreting the results, it can be seen that environmental factors such as temperature, light intensity and the colour of the plant have an effect on the rate of photosynthesis. Temperature has an effect on the rate of photosynthesis as higher temperatures (hotter) increase photosynthesis, due to the fact that photosynthesis is a chemical reaction which is accelerated with temperature, but at extremely high temperatures, the enzymes that carry out photosynthesis can lose their shape and functionality, and the photosynthetic rate declines rapidly. The graph within figure 8 highlights this as higher temperatures lead to an increased photosynthesis production. This is demonstrated within the results as in the beaker which contained the hot water (37 degrees celsius) 9 of the floating leaf disks floated to the top, while in the beaker that contained cold water (10 degrees) only 4 had risen to the top. Enzymes are protein molecules used by living organisms to carry out biochemical reactions. The proteins are folded into a particular shape, and this allows them to bind efficiently.
At low/cold temperatures (10 degrees) photosynthesis rate declines, this is illustrated in figure 8 as the cold temperature water had the least amount of floating leaf disk assays floating to the top of the beaker (only 4), the enzymes that carry out photosynthesis did not work efficiently, and this decreased the photosynthetic rate. This leads to a decrease in glucose production and will result in stunted growth within the plant. At medium/room temperatures, (20 degrees) the photosynthetic enzymes work at their optimum levels, so photosynthesis rates are generally high. Within the results, the beaker which contained room/optimal temperature, 5 of the floating leaf disk assays had risen to the top. Highlighting the effect that different temperatures have on photosynthesis rate within plants and that higher temperatures lead to a higher photosynthesis rate.
Light intensity is one of the important factors which affect the rate of photosynthesis. Light intensity directly affects the light-dependent reaction in photosynthesis and indirectly affects the light-independent reaction. Very high light intensities may slow the rate of photosynthesis due to the bleaching of chlorophyll. However, plants exposed to such conditions usually have protective features such as thick, waxy cuticles and hairy leaves. Increasing the light intensity increases the rate of photosynthesis, until another factor (limiting factor) becomes in short supply.
This is expressed within the results as in figure 9, the beaker with the plant that was exposed to sunlight had more floating leaf disks (7) rising to the top of the beaker, while treatment 2 which involved the plant being exposed to more shade had less floating leaf disks floating (only 2). This illustrates the powerful effect that higher light intensity has on increasing the rate of photosynthesis as it is clearly evident that plants which are exposed to sunlight produce an increased photosynthesis rate.
If a plant is a darker green, then it should photosynthesize faster as the plant contains more chloroplasts and thus has more chlorophyll (a pigment) which is one of the most important components for photosynthesis to occur. Chlorophyll absorbs the light energy required to convert carbon dioxide and water into glucose. Chlorophyll is green meaning that it absorbs the red and blue parts of the electromagnetic spectrum and reflects the green part of the spectrum. Leaves with more chlorophyll are better able to absorb the light required for photosynthesis. This is reflected within my results as the graph within figure 10 illustrates that the beaker which contained the dark green plant (which has a higher chlorophyll concentration) allowed more photosynthesis to be produced due to more floating leaf disk assays rising to the top (6-7) while the beaker which contained the lighter coloured part of the plant/leaf (yellow/orange) had less floating leaf disk assays (2) at the end of the trials/10 minutes as shown in figure 10. This demonstrates the effect that chlorophyll has on photosynthesis in increasing it drastically.
Some limitations involved within this experiment include the temperature which could not be kept at a constant throughout the experiment. Experimental results and design need to be further investigated in order to further improve the investigation. Systematic uncertainties/errors and bias are those that occur due to faults in the measuring instrument or in the techniques used within the experiment. The accuracy of measurements subject to systematic errors cannot be improved by repeating those measurements. Systematic errors can be difficult to detect but once they are detected, they can be reduced by refining the methods and techniques. Systematic errors are deviations from the true value by a constant amount and they affect the accuracy. A systematic uncertainty within the experiment is the timer which was used to time how long it takes for the floating leaf disk assays to float to the top of the beaker, this is a uncertainty as it is difficult to start and stop the watch at the exact same points.
Within the investigation, bias is very limited as plants have been selected randomly. The experiment is reliable as there are a large number of trials (10). Repeating the experiment or testing a certain factor multiple times in order to make sure the results are similar is highly important within scientific investigations. The trials involved observing how many floating leaf disks floated to the top of the beaker at the end of each minute, until the time reached 10 minutes. Validity is also important as it determines whether the results/experiment answers the research question. The experiment contains validity as it tests the rate of photosynthesis under different environmental conditions through utilising the floating leaf disk assay. The experiment is also accurate as it involved proper planning of the equipment and materials used in the experiment. Mean and standard deviation are also methods used to calculate the results which increase the accuracy.
Qualitative data which was collected increases the validity of this investigation. Photographs were taken during the conduction of the experiment. Figure 4 and 5 provides evidence on how the experiment was set up, and figure 6 illustrates the 9 floating leaf disks which are floating at the top of the beaker which can be clearly seen and counted from the image. This was the hot temperature water of 37 degrees which had the most leaf disks floating to the top.
The statistical test performed was two tailed T test with equal variants in excel (tail=2) and (type=2). When the temperature of 37 degrees was compared with the temperature of 10 degrees, the student's T test revealed that the P value (1.06x10 to the power of -11) was smaller than the alpha value of 0.05 meaning that the photosynthesis rate at 37 degrees and the photosynthesis rate at 10 degrees were statistically and significantly different. This is revealed in the graph of figure 11. If P is less than 0.05 then the mean of the treatments are statistically and significantly different.
Brown and colleagues also support this investigation. Their article also highlights this difference using the leaf disk assay as their findings demonstrate that their results are statistically and significantly different as their P value is below 0.05 which further highlights that our findings are scientifically accurate.
Conclusion
Overall, this investigation tested the rate of photosynthesis within plants under different environmental conditions such as temperature, light intensity and the colour of plant/chlorophyll concentration Through the analysis and interpretation of the results from the experiment, it can be seen that higher temperatures and light intensity are more suitable for the rate of photosynthesis as they increase it, while darker/greener plants with more chlorophyll concentration allow for a higher rate of photosynthesis which is clearly evident within the graphs and figures available. The floating leaf disk assay was utilised throughout the experiment in order to determine the rate of photosynthesis amongst the different environmental conditions listed. The results were analysed through inferential and descriptive appropriate statistical methods and techniques such as mean, standard deviation and student's T test using microsoft excel 365, where it can be concluded that the results from this particular experiment are accurate, reliable and valid and answer the research question and overall hypothesis of this investigation.
References
Society, N., 2021. Calvin Cycle. [online] National Geographic Society. Available at: <https://www.nationalgeographic.org/med ia/calvincycle/#:~:text=The%20Calvin%20 cycle%20is%20a%20part%20of%20phot osynthesis%2C%20the%20process,from %20sunlight%20and%20carbon%20dioxi de.&text=Background%20Info%20Vocab ulary- ,The%20Calvin%20cycle%20is%20a%20 process%20that%20plants%20and%20al gae,food%20autotrophs%20need%20to% 20grow.> [Accessed 8 December 2021].
Sciencing. 2021. Why Is Photosynthesis Important for All Organisms?. [online] Available at: <https://sciencing.com/photosynthesisimportant-organisms-6389083.html> [Accessed 8 December 2021].
2021. [online] Available at: <https://study.com/academy/answer/listthree-reasons-why-photosynthesis-isimportant-to-your-life.html> [Accessed 8 December 2021].
Towers, L. and Towers, L., 2021. Water quality: a priority for successful aquaculture. [online] Thefishsite.com. Available at: < https://thefishsite.com/articles/waterquality-a-priority-for-successfulaquaculture#:~:text=Photosynthesis%20i s%20one%20of%20the,activities%20in% 20standing%20pond%20aquaculture.&te xt=In%20 addition%20to%20supplying%20 oxygen,ammonia%2C%20 nitrates%2C%20and%20urea.> [Accessed 8 December 2021].
2021. [online] Available at: <https://www.jstor.org/stable/4447960> [Accessed 8 December 2021]. (This article further developed my interest in the floating leaf disk assay as it is very informative and useful.)
Nature.com. 2021. Photosynthesis, Chloroplast | Learn Science at Scitable. [online] Available at: <https://www.nature.com/scitable/topicpa ge/photosynthetic-cells14025371/#:~:text=In%20 plants%2C%20 photosynthesis%20takes%20place,long% 20failed%20with%20the%20organelle.> [Accessed 8 December 2021].
Kaiser, E., Morales, A., Harbinson, J., Kromdijk, J., Heuvelink, E. and Marcelis, L., 2021. Dynamic photosynthesis in different environmental conditions.
Jstor.org. 2021. Patterns of Photosynthesis under Natural Environmental Conditions on JSTOR. [online] Available at: <https://www.jstor.org/stable/pdf/1933105 .pdf> [Accessed 8 December 2021].
Vu, M., Douëtte, C., Rayner, T., Thoisen, C., Nielsen, S. and Hansen, B., 2021. Optimization of photosynthesis, growth, and biochemical composition of the microalga Rhodomonas salina an established diet for live feed copepods in aquaculture.
Ahmad, P., Ahanger, M., Alyemeni, M. and Alam, P., n.d. Photosynthesis, productivity, and environmental stress.
Rabinowitch, E. and Govindjee, n.d. Photosynthesis
Patel, B., 2021. Co-Generation of Solar Electricity and Agriculture Produced by Photovoltaic and Photosynthesis Dual Model by Abellon, India.
Gibbs, M. and Akazawa, T., 1979. Photosynthetic carbon metabolism and related processes. Berlin: Springer.
Science Buddies. 2021. Use Floating Leaf Disks to Study Photosynthesis | Science Project. [online] Available at: <https://www.sciencebuddies.org/science -fair-projects/projectideas/PlantBio_p053/plantbiology/photosynthesis-leaf-disk-assay> [Accessed 8 December 2021].
Wang, Y., Zhang, Y., Han, J., Li, C., Wang, R., Zhang, Y. and Jia, X., 2021. Improve Plant Photosynthesis by a New Slow-Release Carbon Dioxide Gas Fertilizer. [online] Improve Plant Photosynthesis by a New Slow-Release Carbon Dioxide Gas Fertilizer. Available at: <https://www.ncbi.nlm.nih.gov/pmc/article s/PMC6648988/#:~:text=The%20use%20 of%20fertilizer%20to,get%20a%20 higher%20 drop%20yield.> [Accessed 8 December 2021].
Comparison of Leaf Disk, Greenhouse, and Field Screening Procedures for Evaluation of Grape Seedlings for Downy Mildew Resistance (Brown, M., Moore, J., Fenn, P. and McNew, R., 1999. Comparison of Leaf Disk, Greenhouse, and Field Screening Procedures for Evaluation of Grape Seedlings for Downy Mildew Resistance. HortScience, 34(2), pp.331-333.)
Appendices
Detailed method:
1. Fill up the first beaker with 300ml of body temperature water and add ⅛ teaspoon of baking soda and a drop of dish soap into the water and gently stir the solution
2. Punch out 10 leaf disks from the first plant (lettuce) using a hole puncher.
3. Remove the plunger of the syringe and place the leaf disks inside
4. Place the plunger back in the syringe and push it down leaving a small gap of air (don’t crush the leaf disks.)
5. Suck up a small amount of the baking soda/dish soap solution into the syringe and hold it vertically
6. Push out the air out of the syringe
7. Close the opening of the syringe using a finger and pull the plunger back creating a vacuum
8. Hold the vacuum for around 15 seconds while shaking the syringe lightly (the vacuum will remove all the air from the leaf disks)
9. Release the plunger and remove your finger from the syringe releasing the vacuum (the leaf disks should sink to the bottom)
10. Repeat steps 7, 8, and 9 if all leaf disks don't sink
11. Pour the leaf disks and solution into an empty beaker
12. Repeat this same procedure two more times and add each set of 10 leaf disks in an empty beaker (you should have 3 beakers with 10 leaf disks in each one)
13. Add cold water into the first beaker, body temperature water into the second one and hot water into the third one
14. Start a timer and at the end of each minute, record the number of floating disks in each cup
15. Swirl the disks around slightly, to avoid them getting stuck to the cup.
16. Continue the experiment until all of the leaf disks are floating in one of the cups
17. Repeat this procedure using the different environmental conditions and the different plant types each time.
Collect and record quantitative data using graphs, time charts and tables to note down how long it took for the leaf disks to float in the solution under different environmental conditions. For example making a graph that shows the photosynthesis rate for each tested condition, using a timer and thermometer and recording the exact temperatures and the exact times which will contribute to the reliability and accuracy of my experiment.
The collection of qualitative data also plays a big role in the overall results of this investigation. This includes the observation of what is happening throughout my experiment such as what I can see (using my 5 senses) and describing the different features of the experiment, it can also involve taking pictures and analysing/explaining them further.
Avoiding systematic and random errors and reducing uncertainty within experimental data is significant and involves the repetition of the experiment at least three times, paying attention and constantly editing the data in case of errors and mistakes, using quality equipment, preparing ALL materials, having a controlled environment and double-checking all observations, recordings and measurements.
Recording and organising the results involved the use of different methods and techniques such as using a logbook, timing/measuring temperatures, tabulating (drawing and completing a table of results), taking photographs throughout the experiment and of the results, using specific apps (to identify trees and plants) and taking videos. For example taking photos of the leaf disk to demonstrate how many are floating at the top. The data and results were also stored on a USB, computer, emails and phone.