18 minute read
Bioaccumulation Of Microplastics And Their Respective Chemicals Within Seafood Of Different Trophic Levels: A Meta Study


Bioaccumulation Of Microplastics And Their Respective Chemicals Within Seafood Of Different Trophic Levels: A Meta Study
Flynn Croaker – Coffs Harbour Senior College
Abstract
The increasing amount of microplastics (MPs) in the ocean raises concerns regarding the bioaccumulation of harmful and toxic chemicals which build up in seafood species. This meta looked at current data and surveyed the available information to depict whether different trophic levels make sea creatures that are commonly eaten by humans more susceptible to MPs and their respective chemicals which cause bioaccumulation. The results showed that there are discrepancies in the amount of information available, however, there is a good amount of evidence supporting that lower trophic levels are more susceptible to MP consumption and the toxic chemicals that accumulate. There would need to be an increase in laboratory-based experiments on the topic to have certain results.
LITERATURE REVIEW
Microplastic Identification
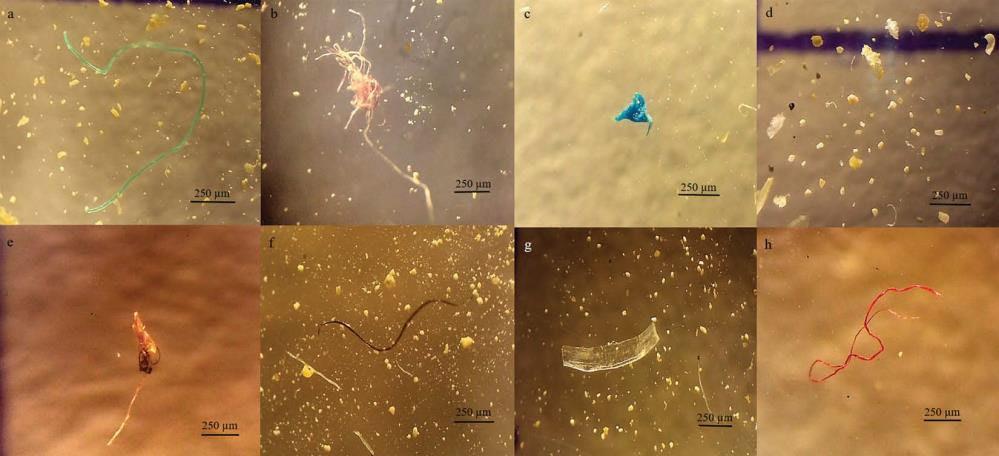
Microplastics are microscopic pieces of plastic that are less than 5mm in diameter. These can be either primary or secondary pieces. Primary MPs are small particles created for commercial use, this also encompasses microfibers that have rubbed off clothing and other materials. Secondary MPs are plastic pieces that have broken down from a larger piece of plastic, this decomposing is caused by environmental factors, usually ocean waves and the sun’s radiation waves. Since these foods are small, they are quite frequently mistaken throughout the marine food chain as food. As these MPs break down further, they can give off toxic chemicals which can be harmful to these animals.
Figure 1. Some detected microplastics (MPs) in seafood species’ muscles from the Persian Gulf. The scale bar represents 250 μm. (Akhbarizadeh, Moore & Keshavarzi 2019)
Seafood Identification
Any sea creature which is known to be eaten by any general population regardless of the circumstances e.g. a cultural food or a nation's traditional food.
Trophic Level Calculation (Diet Composition)
Trophic levels depend upon what a species eats. It can be obtained from stable isotopes analyses, trophic ecosystem models, or stomach content analyses. As an example, a fish consuming 50% herbivorous-zooplankton (trophic level 2) and 50% zooplanktoneating fish (trophic level 3) would have a trophic level of 3.5. Trophic levels (TL) can be calculated from where n is the number of species or groups of species in the diet, DCi is the proportion of the diet consisting of species i, and TLi is the trophic level of species i. Thus, using dietary data, the trophic level of the predator is determined by adding 1.0 to the average trophic level of all the organisms that it eats. (Yodzi, Reichle & Trites 2017)
The trophic magnification factor (TMF) was calculated mathematically based on the relationship between trophic level (TL) and the concentration of contaminants. TMF was calculated using the following equation:
TMF = eb
Where b is the slope of the equation below:
Trophic Transfer of Microplastics
lnC_biota = a + (b x TL)
If TMF of a contaminant is below 1, the contaminant is not biomagnified (Won et al. 2018) and (Akhbarizadeh, Moore & Keshavarzi 2019)
QUESTION
Research question: Do MPs and their respective chemicals cause bioaccumulation more within seafood of lower trophic levels?
HYPOTHESES
Alternative Hypothesis: Seafood species of lower trophic levels will be more susceptible to the bioaccumulation of MP chemicals.
Null hypothesis: Seafood species of higher trophic levels will be more susceptible to the bioaccumulation of MP chemicals.
METHOD
To present a meta-analysis and systematic review of all scientific literature globally, analysing the data on MP contaminants within specific aquatic species. This literature was screened through a rigorous framework [Fig 1]. A thorough search was conducted to find literature regarding the bioaccumulation of MPs within seafood species of different trophic levels. The exploration for literature was not limited to a specific search platform and was finalised in August 2022, covering the years 2012 to 2022. The search included the following terms: Microplastics, bioaccumulation, fish, effects, toxic and impacts. If they fit this model, the data was scrutinised and isolated, allowing the location of relevant information which was study specific. Meta-analysis then took place, and the amount of data would need to be sufficient to support the study. Further, they also had to meet a level of validity. This was calculated through their study level and risk of bias [Fig 2]. Any literature which did not sufficiently satisfy these requirements was not included. These sources had to also uphold a deeper level of conceptual conclusions and analysis within their results and have a clear, descriptive research method. Additional resources were acquired through the bibliographies from the literature that was going to be used. Once the relevant resources were acquired, the data was extracted and consolidated, this entailed extracting the relevant data to the specific research area and then making an assessment of the quality of the studies. This collected data was then evaluated to highlight the extent of between-study inconsistency (heterogeneity). Those results were pooled to calculate summary measures and the measure of effect, expanding the analysis on a macro study scale. These summaries created a general overall regression for the data, giving a trend in which the information was heading. These findings were then interpreted and provided recommendations within discussion for future works regarding the bioaccumulation of MPs within seafood species.
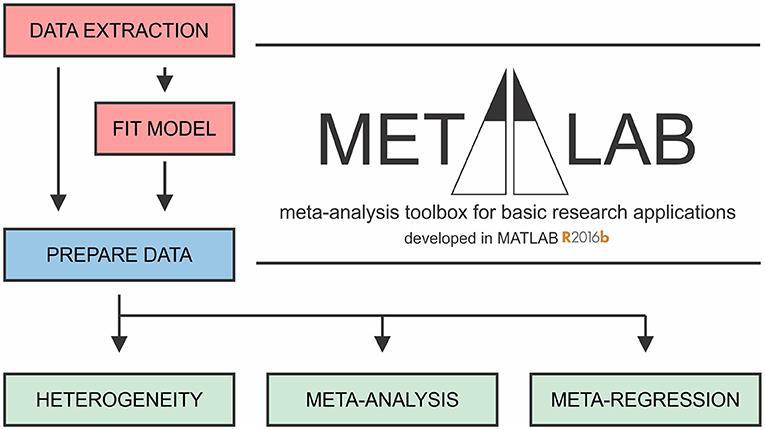
General framework of MetaLab. The Data Extraction module assists with graphical data extraction from study figures. Fit Model module applies MonteCarlo error propagation approach to fit complex datasets to model of interest. Prior to further analysis, reviewers have opportunity to manually curate and consolidate data from all sources. Prepare Data module imports datasets from a spreadsheet into MATLAB in a standardized format. Heterogeneity, Metaanalysis and Meta-regression modules facilitate meta-analytic synthesis of data. (Mikolajewicz 2019)
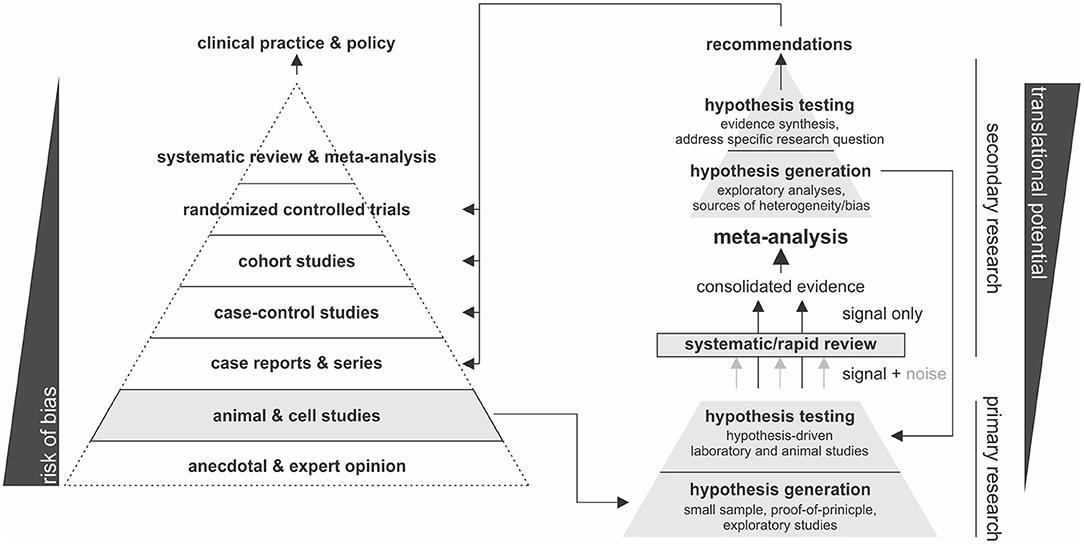
Figure 2. Proposed Framework of the validity through a process of considering both risk of bias and level of research. (Mikolajewicz 2019)
RESULTS
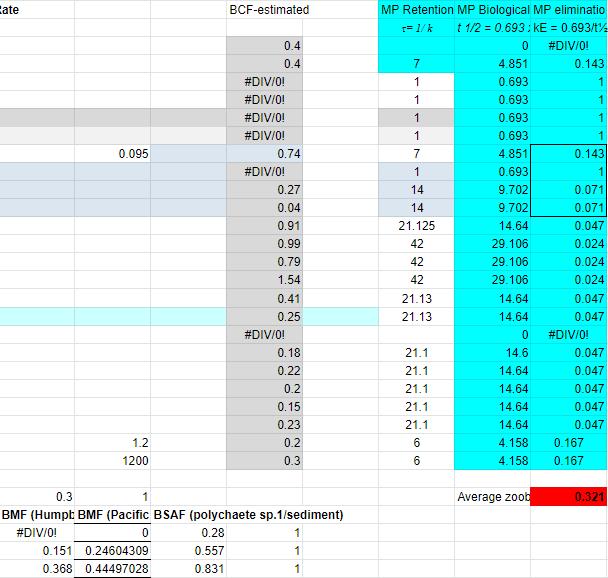
[Figure 1] suggests that there is a significant correlation between the amount of microplastic intake that occurs as trophic levels change. This graph proposes that seafood of a higher trophic level will be subject to less microplastic intake, making them less susceptible to bioaccumulation. This may be because the higher a sea creature's trophic level, the less likely they are to be directly affected by the lower trophic level’s accidental consumption of MPs mistaking them for food. The Portunus armatus remains an outlier and this may be because of the foods in its diet which are mostly made up of smaller organisms which cannot accumulate a lot of MPs. This puts forward that this diet is a not particularly prevalent occurrence, some organisms throughout all trophic levels which are made an anomaly due to their diets. The results within the trophic magnification factor (TMF) calculation suppose that the contaminants were not biomagnified throughout the food web because the TMF was below 1, causing no development of bioaccumulation within the animals of higher trophic levels (TMF=0.72). This study put forward that biomagnification was not occurring in their studied organisms through their diet as the Biomagnification factor (BMF) < 1.
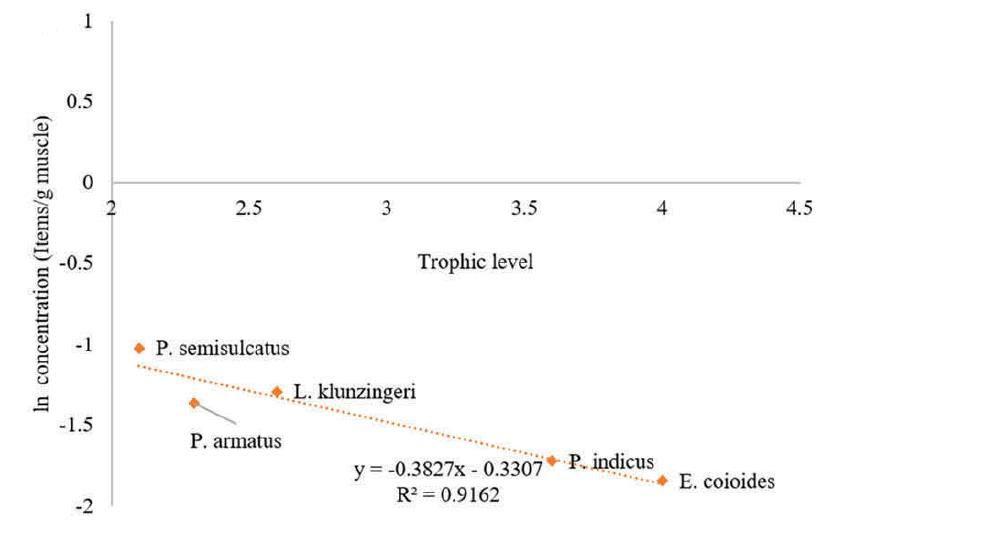
Figure 1. Relationship between MPs and trophic level of studied organisms from the Persian Gulf. (Akhbarizadeh, Moore & Keshavarzi 2019)
This data proposes that there are, on average, the most MPs within seafood from trophic levels 2-3 and 5. Level 1 is almost ruled out completely as it is composed of microorganisms that break down the food they consume, making them not as susceptible to bioaccumulation. There is a very significant difference between the results recorded in situ and in the laboratory. The lab has a much higher number of MPs per individual, this is most likely because of the controlled nature of the environment, allowing them to observe the changes in bioaccumulation of MPs, which again in [Fig 2. D] reaffirms that most MP bioaccumulation occurs within seafood around the trophic level of 2.5. Though in situ it is by chance whether species consume a higher number of MPs, however, it is clear to see a distinction between the means [Fig 3. a) and b)] across all the trophic levels, supporting the theory that around levels 2-3 and 5, more bioaccumulation takes place. This random intake in situ is the cause for so many outliers, all of which aren't able to be correlated according to their trophic level, and this randomness is controlled when in the lab, as the results prove there to be fewer outliers except for at trophic level 2, potentially because they are more susceptible to mistaking MPs for food based on their diet.
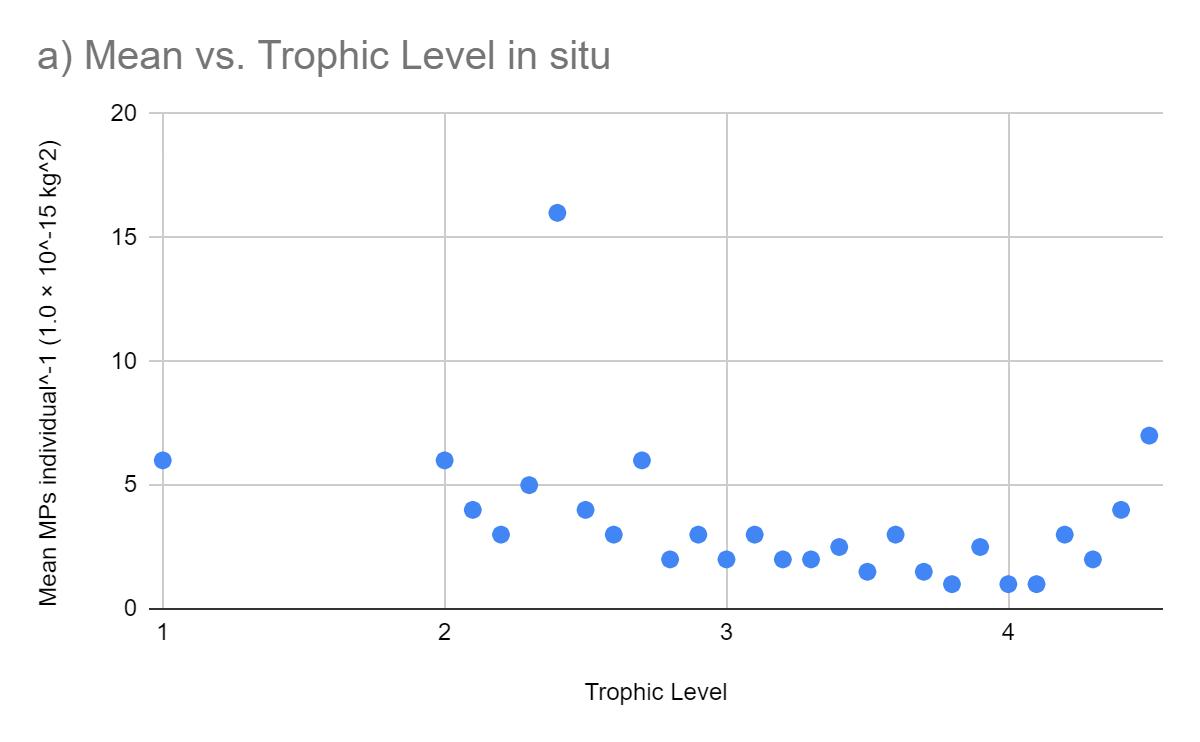
Figure 2. Body burden of bioaccumulated microplastics individual-1 estimated for different trophic levels, based on reports for marine species (a) collected in situ from levels 1 to 4.5 and
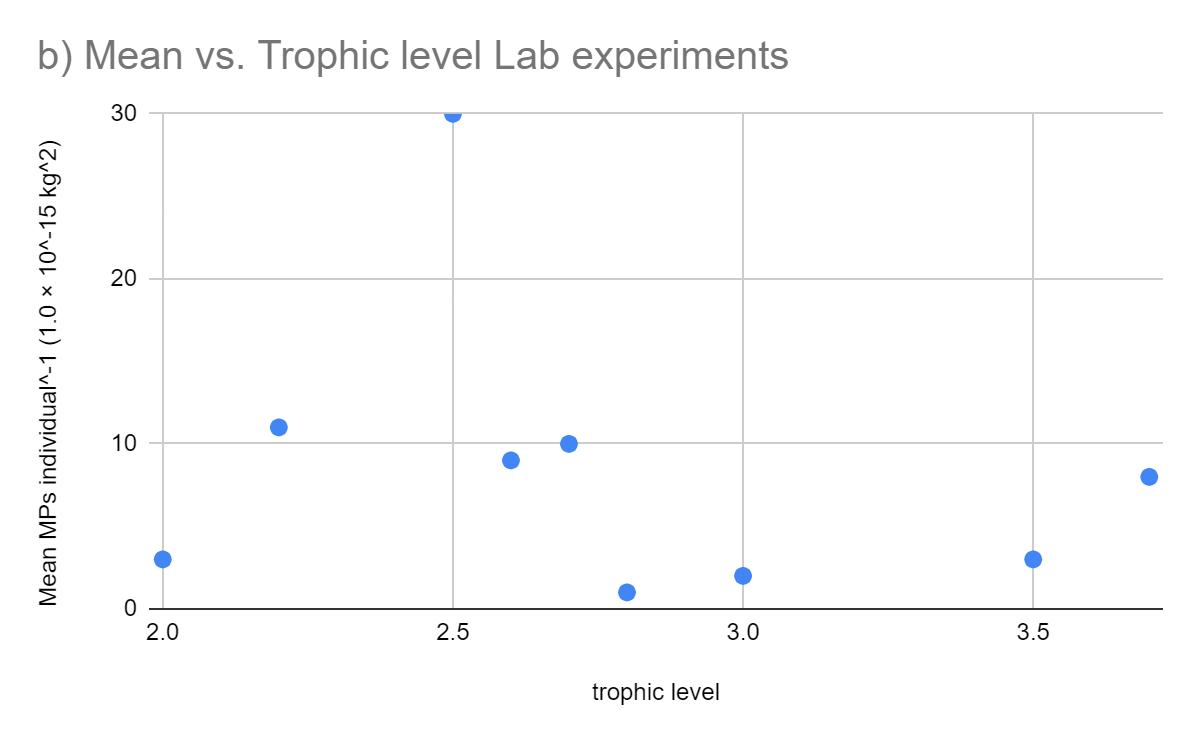
(b) exposed in laboratory experiments from levels 2 to 3.7. Trophic levels have been grouped into to a single decimal place, e.g. level 4.2 includes 4.21 to 4.29. (Miller, Hamann & Kroon 2020)
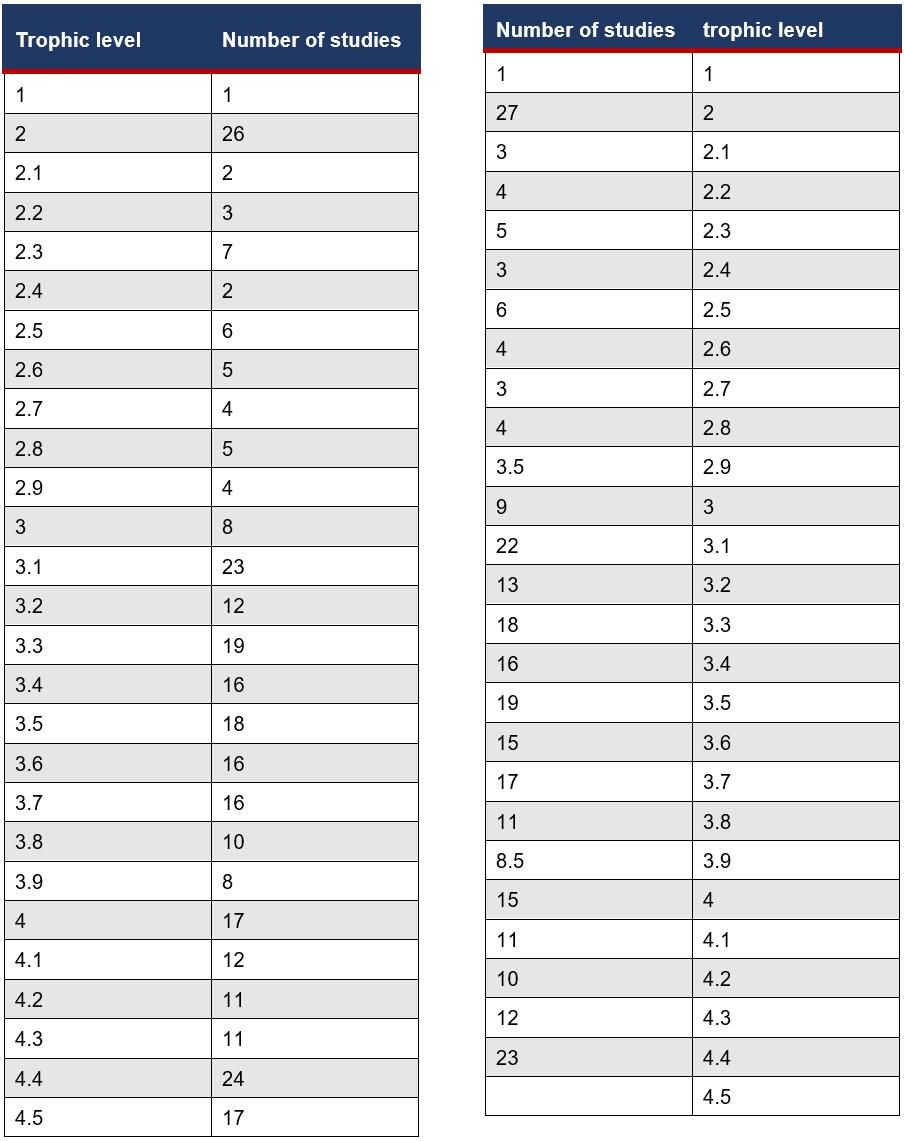
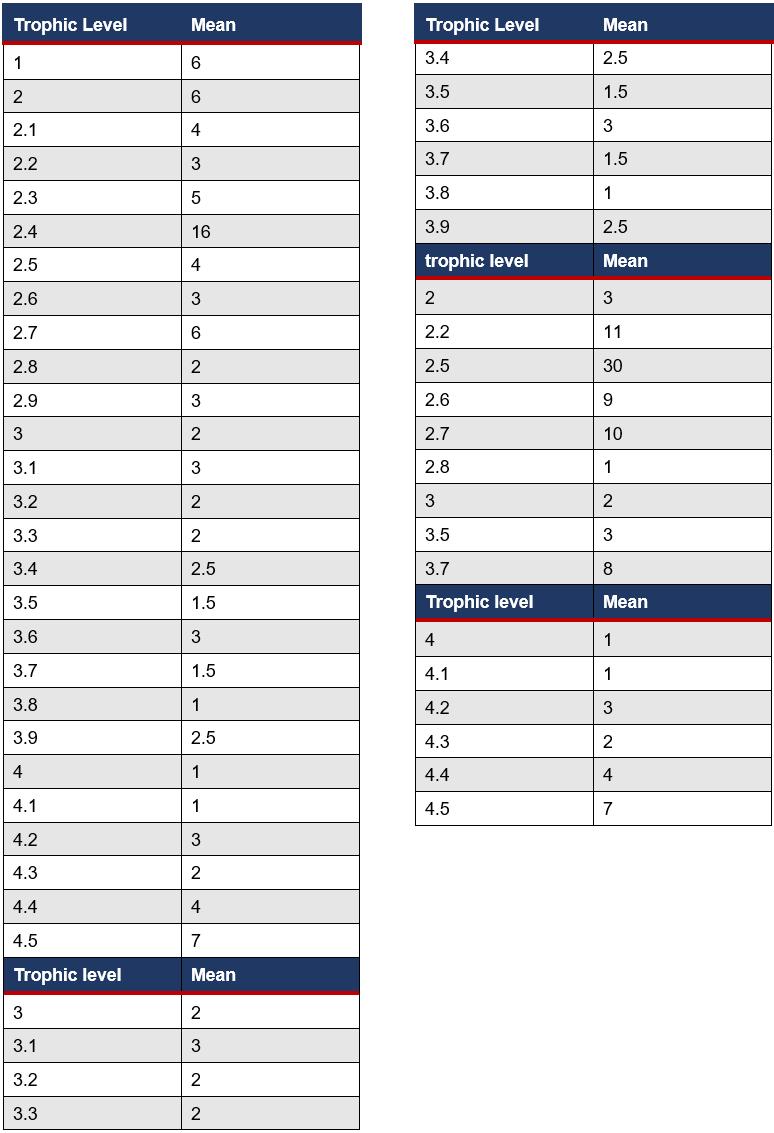
Upon looking at [figure 3] there’s an immediate realisation surrounding the lack of data from levels 2 to 3, even though there is still a large number of studies encountering MP chemical bioaccumulation. The significant difference between 2.8 and 2.9 is most likely due to the lack of results, therefore the data may not be accurate. There doesn’t at first appear to be a specific trend in the chemical confirmations, however, something to note is the spike at trophic level 2.5, an area which has been of interest in other studies too, being the largest spike in MP intake, bioaccumulation and chemical accumulation as well. If the amount of study being done from 2-3, it would be assumed that there would be similar fluctuating results, however, there would most likely be a slightly lower average due to their trophic level being lower, meaning that they’re more likely to live a shorter life, not allowing for as much accumulation of toxic chemicals from MPs.
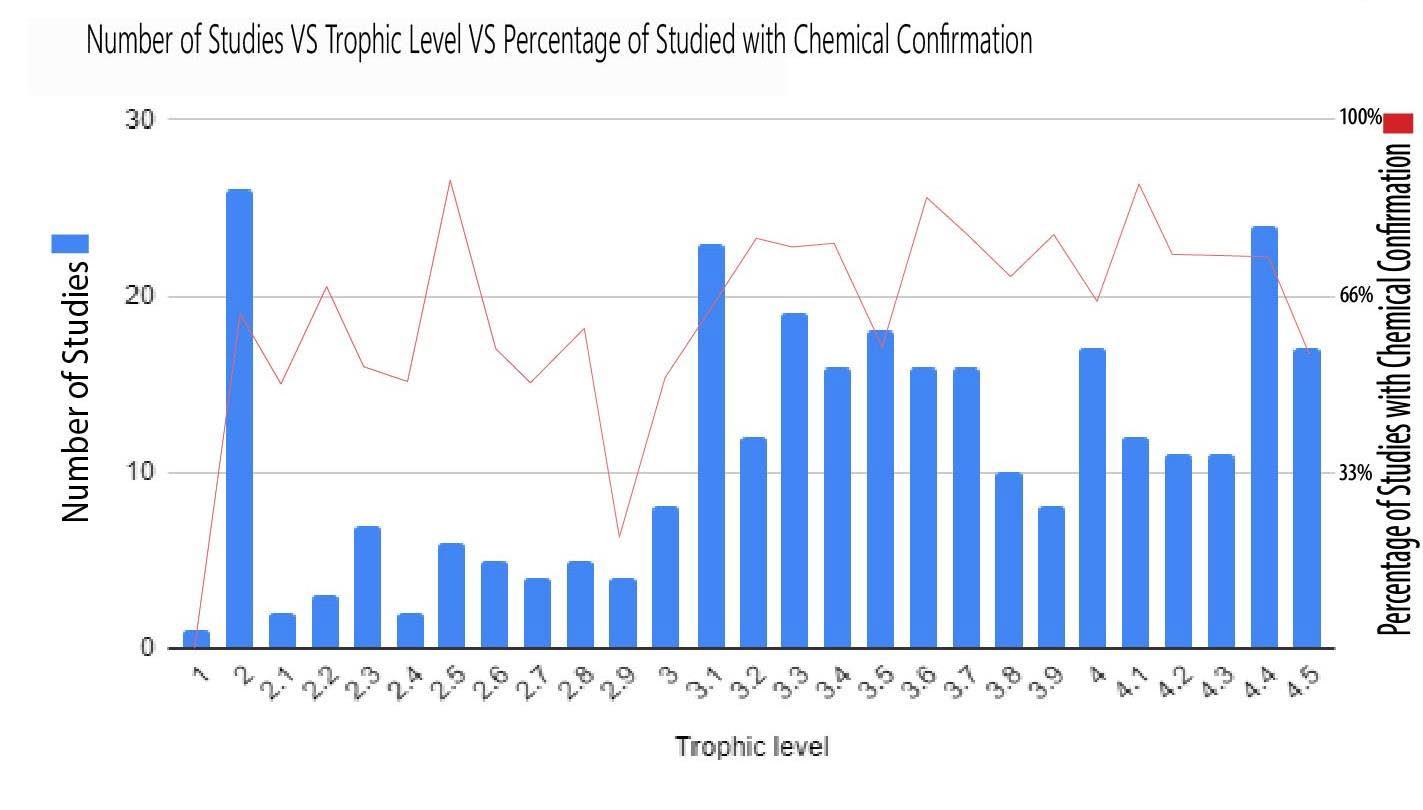
Fig 3. Frequency of microplastic (MP) chemicals confirmed in comparison to the number of studies done. Reporting on studies with marine species collected in situ. Data has been organised by trophic level, which are grouped into to a single decimal place, i.e. level 4.2 includes 4.21 to 4.29. (Miller, Hamann & Kroon 2020)
Within low abiotic concentrations, there is a constant downward trend, this infers that the higher the trophic level, the fewer MPs they have. As the simulation goes on, some sea creatures move up the levels system. This increase in the levels lowers the amount of bioaccumulation that takes place, again reaffirming the previous studies of which’s data has shown that there is a substantial increase in bioaccumulation/MP intake at around the level of 2.5. Something interesting about this data is that as time goes on, the trend steepens [fig 5 C-D] and then it flattens out with a lack of correlation, suggesting that in the end, all species will bioaccumulate the same number of MPs over the long term. In the high abiotic simulation, this trend does not remain [fig. 6]. Proving that at the start of the simulation there was a much stronger correlation than in the longer term, which has no significant direction or correlation, appearing to be quite random. This ending in the data, though over a longer time, with no clear direction in the data, appearing to be flat also suggests that over the long term, the species will have roughly the same amount of MP bioaccumulation. The randomness of this in situ study suggests that the correlation could be stronger if given the right data set.
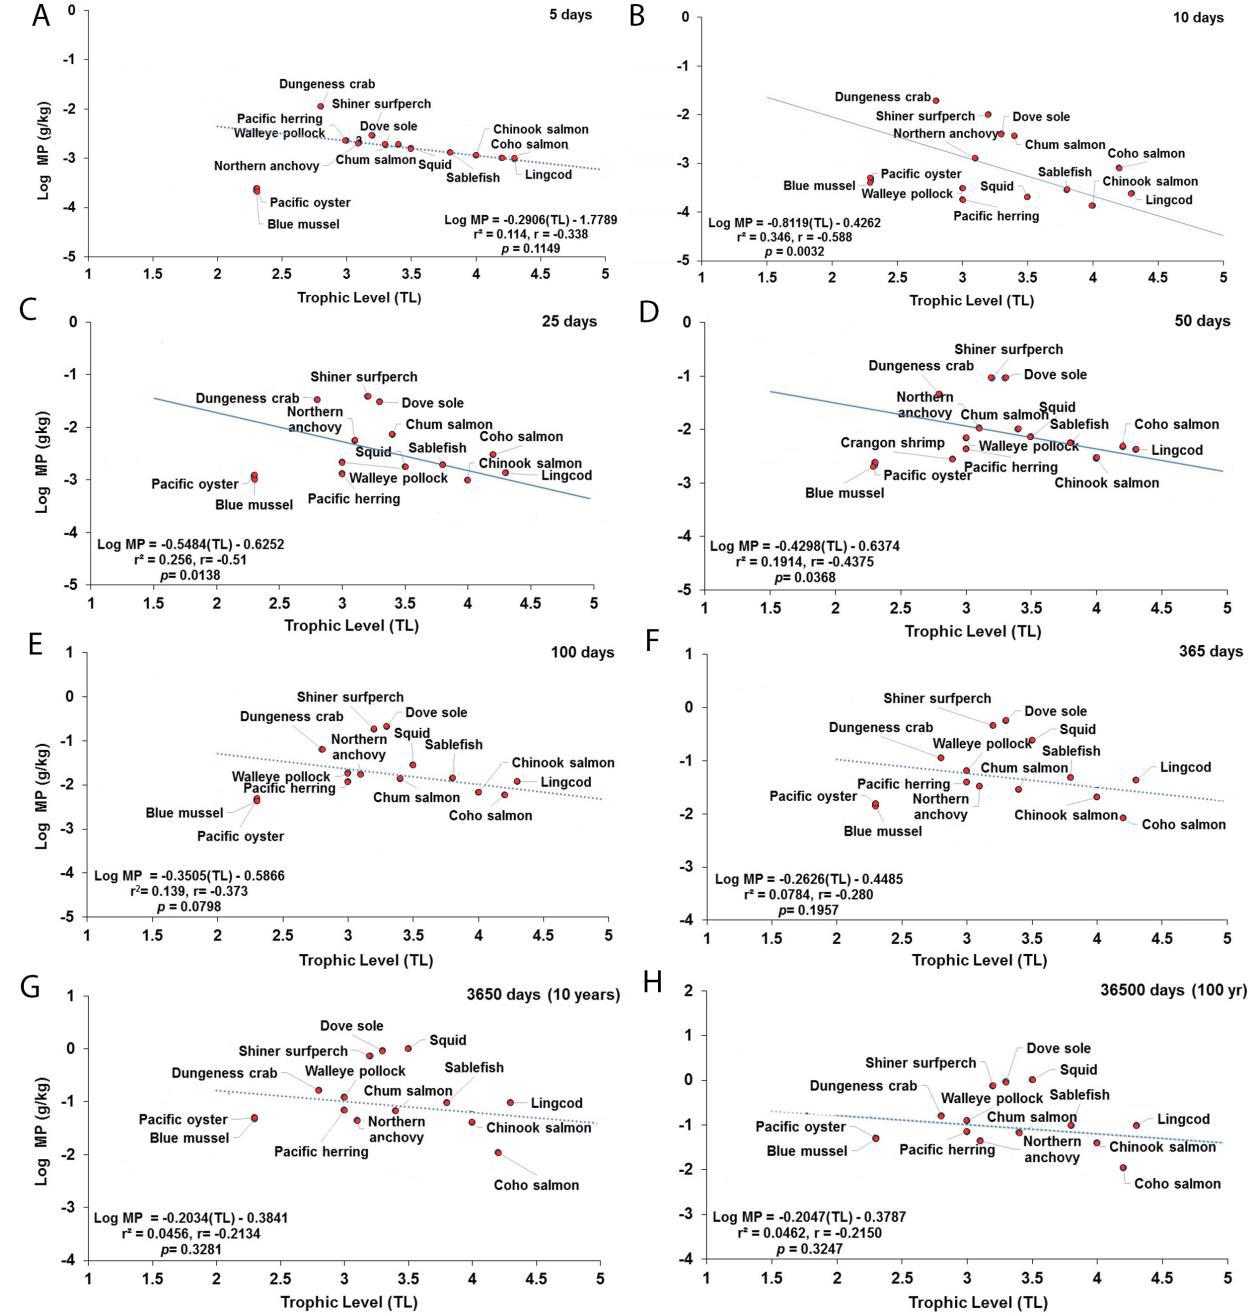
Figure 5. Projections of the apparent trophic magnification factor (TMF) as a function of predicted concentration of microplastics (MPs) versus trophic level (TL) in the cetaceans’ food web of the Northeastern Pacific for simulations under a scenario of low abiotic concentrations (scenario 1: seawater = [0.003 particles/L]; and sediment = [0.266 g/kg dw] at: (A) 5 days (lack of significant relationship); (B) 10 days (regression line indicates a strong negative, significant relationship); (C) 25 days (regression line indicates a moderate and negative, significant relationship); (D) 50 days (regression line indicates a weak and negative, significant relationship); (E) 100 days (lack of significant relationship); (F) 365 days or 1 year (lack of significant relationship); (G) 3650 days or 10 year (lack of significant relationship); and (H) 36500 days or 100 year (the dotted line indicates the slope direction and a negative positive trend, but lack of a significant relationship). (Alava 2020)
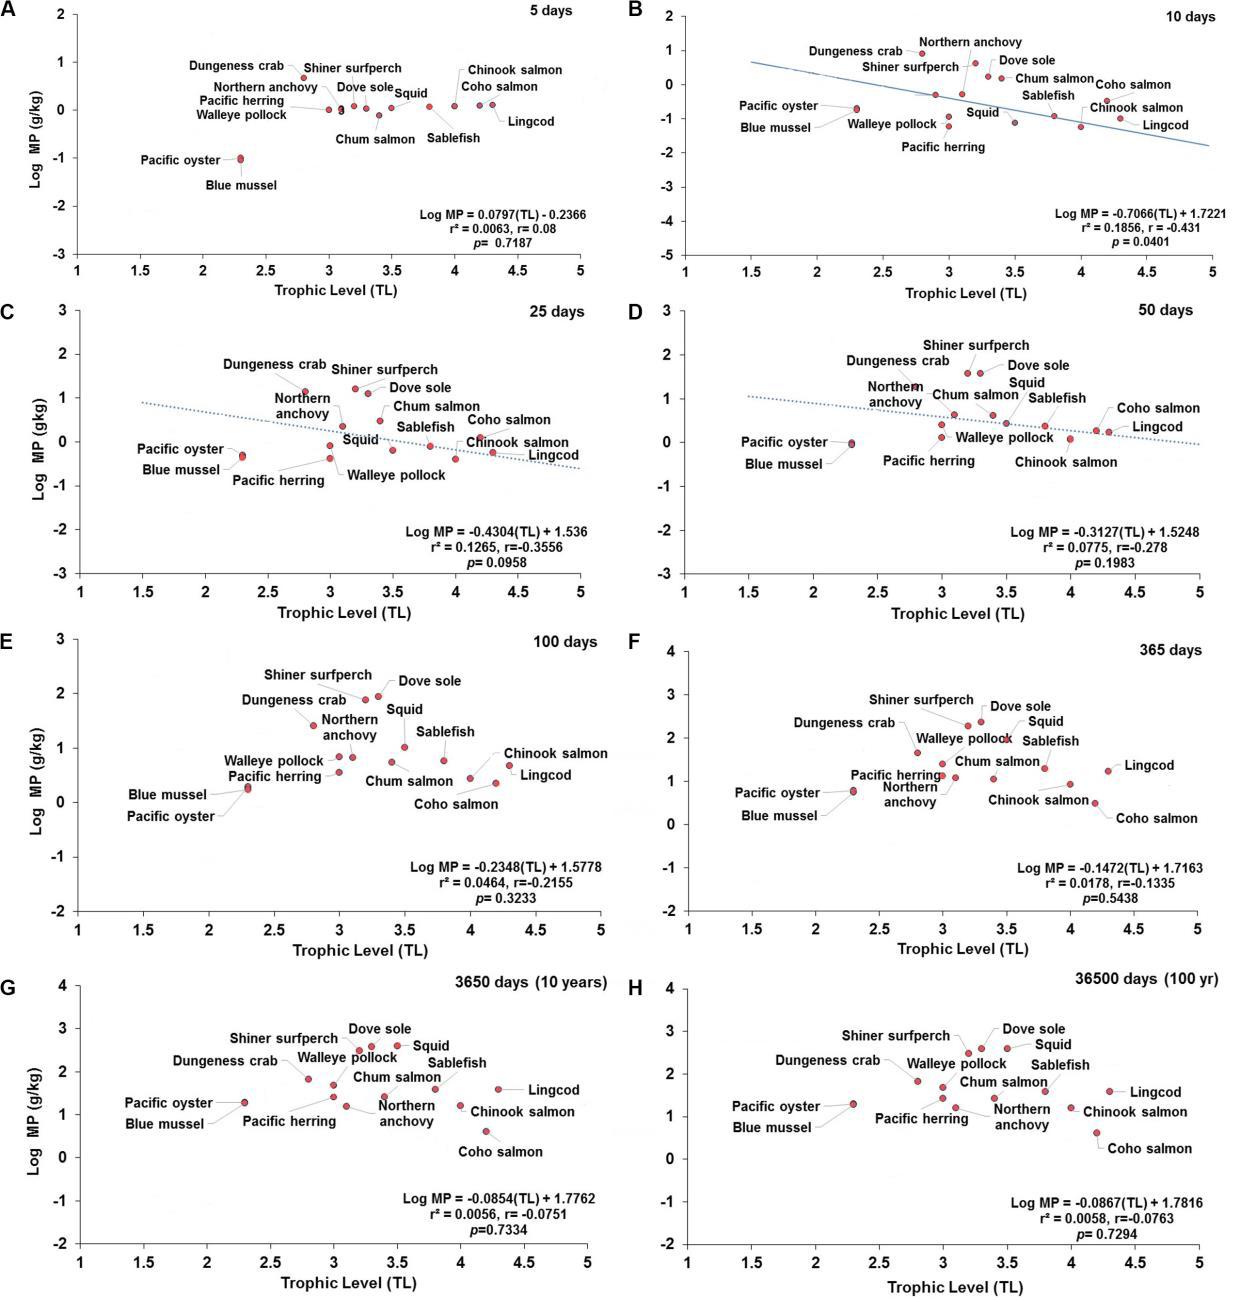
Figure 6. Projections of the apparent trophic magnification factor (TMF) as a function of predicted concentration of microplastics (MPs) versus trophic levels (TL) in the cetaceans’ food web of the Northeastern Pacific for simulations under a scenario of high abiotic concentrations (scenario 3: seawater = [0.04 g/L]; and, sediment = [111 g/kg dw] at: (A) 5 days (the regression shows lack of significant relationship); (B) 10 days (regression line indicates a negative, significant relationship); (C) 25 days (dotted line indicates a negative trend but not a significant relationship; (D) 50 days (dotted line indicates a negative trend, but lack of significant relationship); (E) 100 days (dotted line indicates a negative trend, but lack of significant relationship); (F) 365 days or 1 year (lack of significant relationship); (G) 3650 days or 10 years (lack of significant relationship); and (H) 36500 days or 100 year (lack of significant relationship). (Alava 2020)
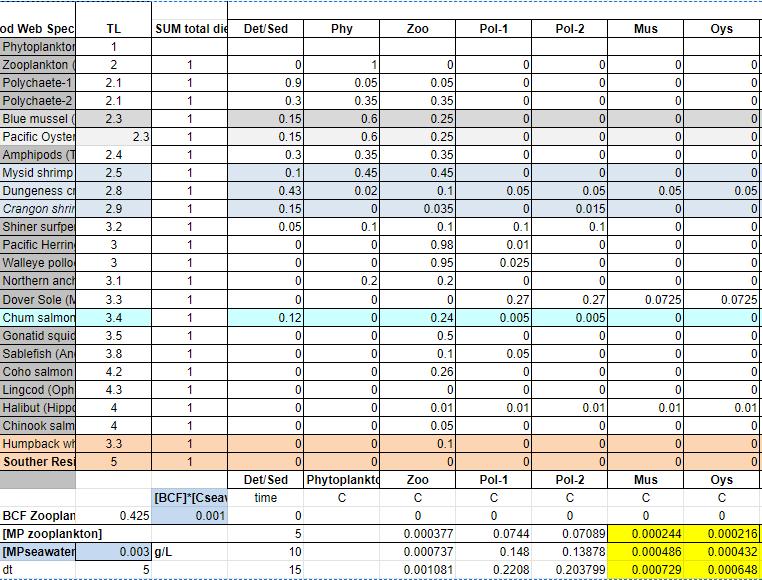
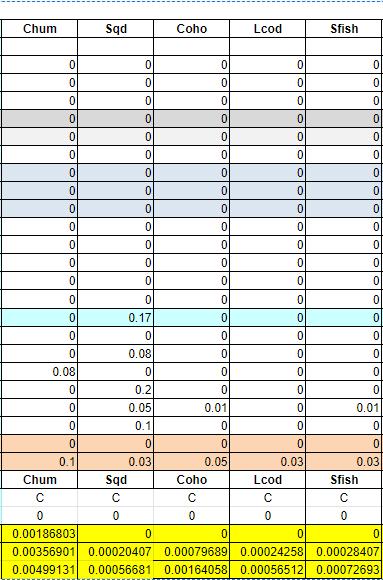
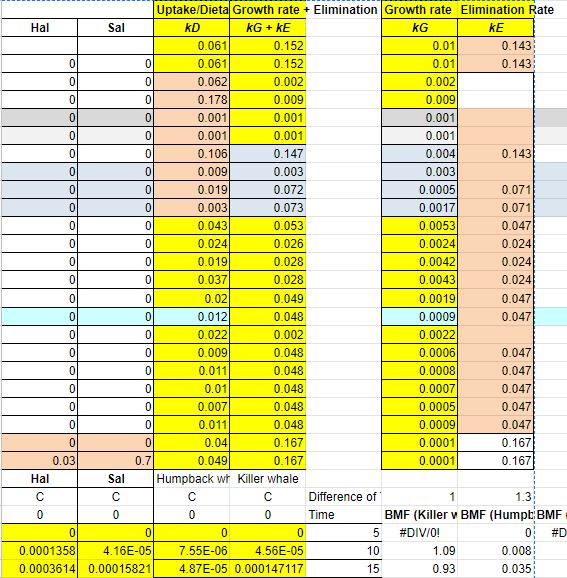
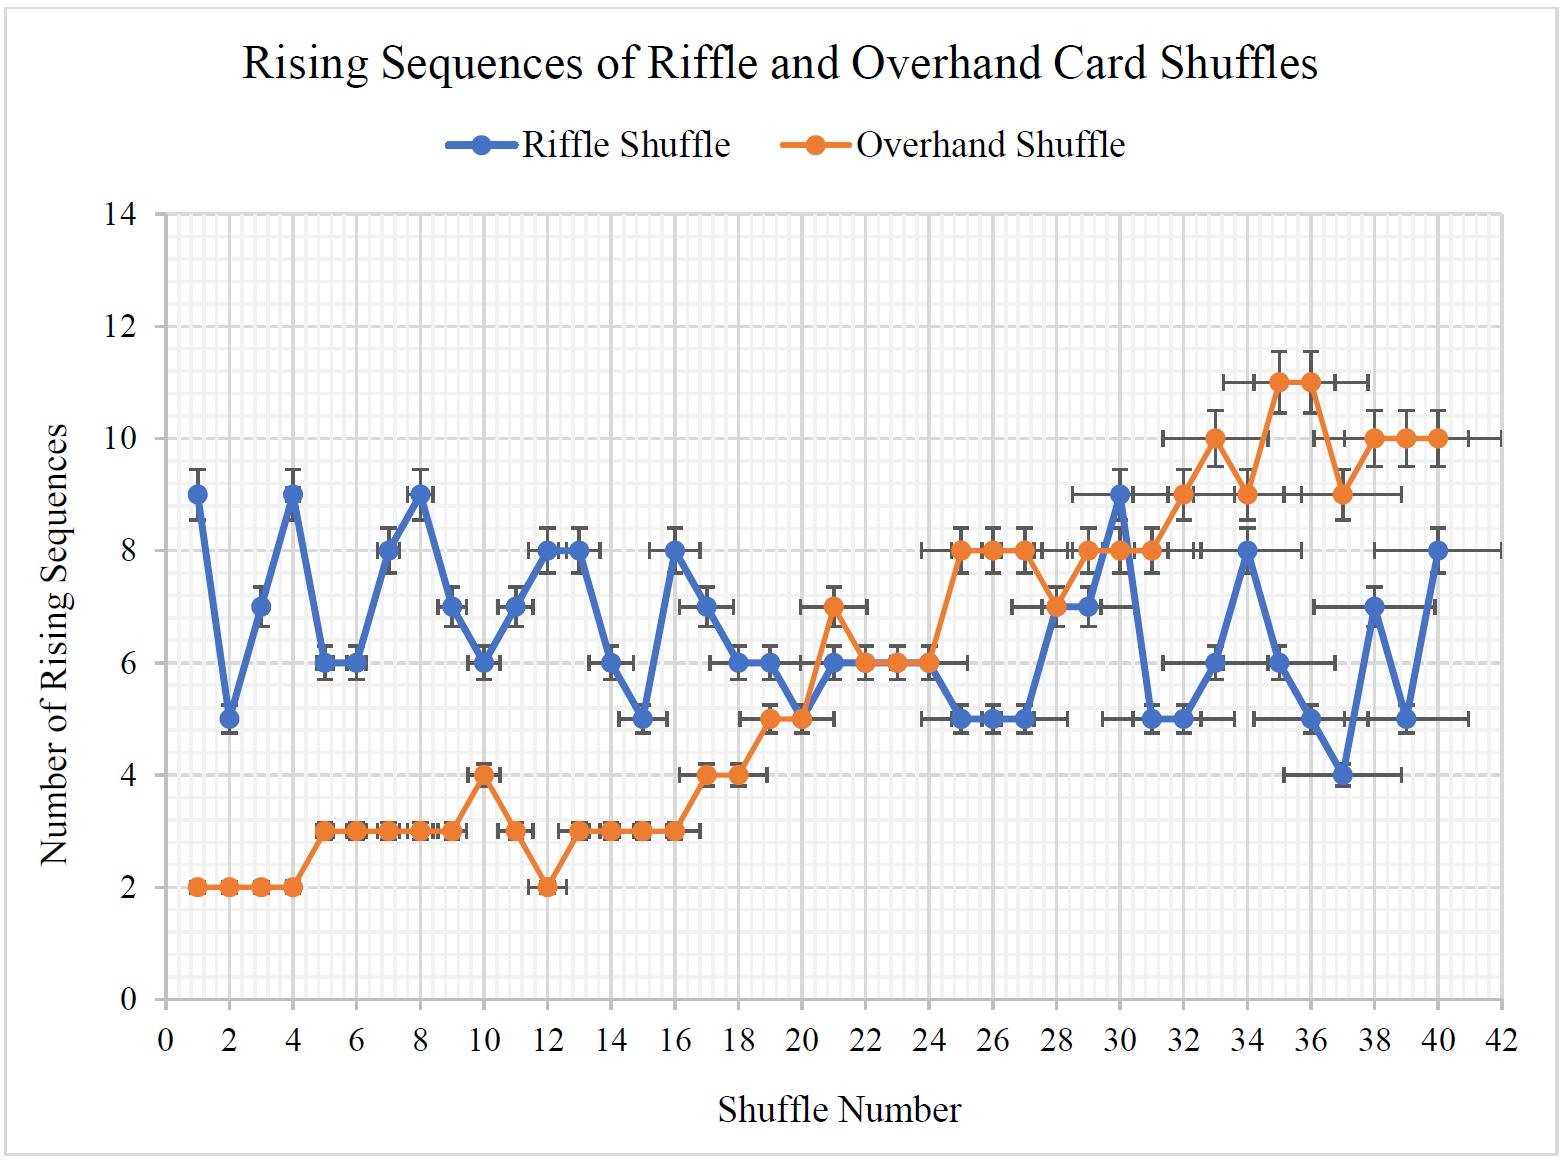
This logarithmic data set provides insight into the nature of when the most MPs are consumed within different seafood species. Certain species such as the gonatid squid increase their intake of MPs as they get older; in comparison to a Dungeness crab which is very limited in its increase of accumulated MPs over time, has a plateau-like statistic from around 120 days. This may suggest that the Dungeness crab learns how to tell the difference between MPs and real food early on in their lifespan. This is surprising as they sit around a 2.7 trophic level, placing them near the usually spiking 2.5 trophic level. There isn’t a specific weight of MPs that all species meet at the end of the simulation as potentially suggested in [Figs 5 and 6] however, this graph suggests that there is quite a widespread in the closing MPs weight. Around 30 days it is clear to see that there is a very similar and strong correlation between all the seafood species and their MP weight, all sitting around 0.005 g/kg.
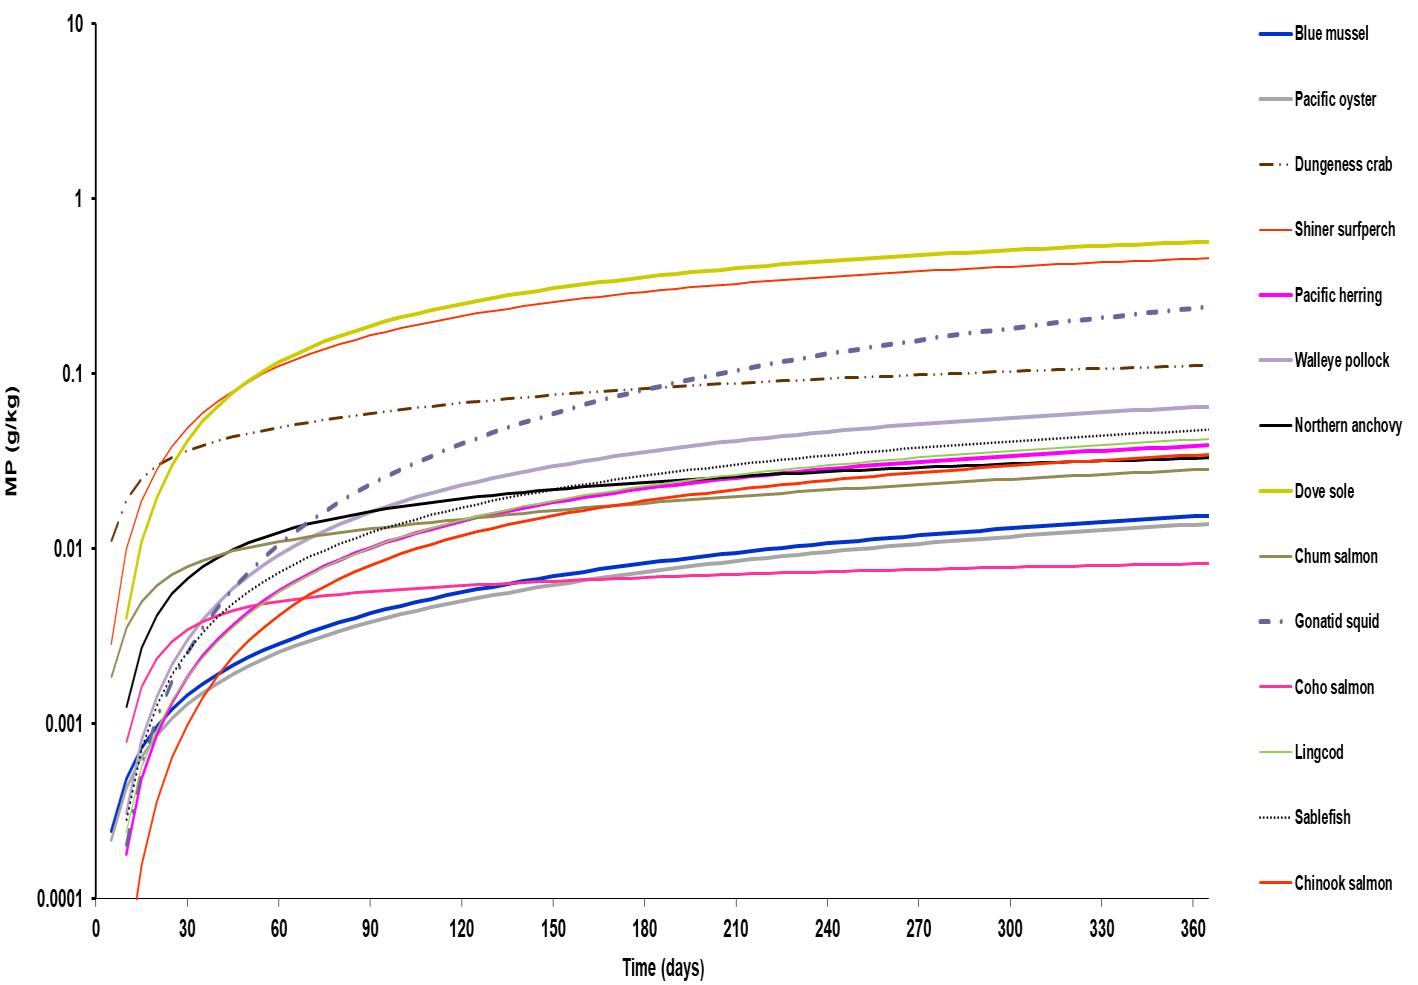
Figure 7. Simulation presenting the projections of microplastics (MPs) bioaccumulation in seafood organisms derived from Alava's 2020 Mammalian Foodweb model simulation of projected microplastic bioaccumulation.
DISCUSSION
The data ultimately differs quite a lot between studies. This is because of the randomness within situ and the lack of data conducted within laboratories. There are studies that both confirm that more bioaccumulation takes place in levels 2-3, and in converse, there is one study that supports there being more accumulation of MPs within levels 3-4.5; This one study also explores the number of papers that have been done on the different trophic levels and it highlights a discrepant number of studies looking at lower levels, causing their data on the percentage of chemical confirmations to be potentially inaccurate. In summary, the data studied indicates that the seafood species which are around a 2.5 trophic level are the most susceptible to MP accumulation, however, there isn’t enough data in a controlled environment to be certain.
This supports the hypothesis given that the study suggests that fish of lower trophic levels will be more susceptible to the bioaccumulation of MP chemicals. These results suggest that if humans want to take the utmost measures to avoid MP consumption, they should avoid filter feeders (muscles, oysters, scallops etc.), deposit feeders (bass, eels, crabs etc.) and grazers (lobsters, shrimp etc.). The limitations of study are around the lack of research done in specific areas. These areas include lower trophic levels lack of studies done, and a lack of studies done in controlled environments such as labs to eliminate the randomness of data which can give clearer and more concise results, allowing for more accuracy and reliability. For further study, there would need to be a deeper understanding of the nature of MP bioaccumulation within all trophic levels, more studies would need to be done in a laboratory setting that has more controlled variables. This is the future direction to further this area of research because the number of MPs the species are being exposed to can be limited by the people conducting the research, in comparison to in situ which varies depending on where the species are. However, the effects of doing a study in a lab could affect their eating habits and thus change the outcome of the final data, if this was the case there would just need to be a filling of the data done on lower trophic level seafood species in situ. This study could be implicated to give a deeper insight into the seafood which is the healthiest to eat regarding a lack of MP chemicals and MPs themselves, proving from this research to be food from higher trophic levels as they have appeared to have less MP bioaccumulation.
This report is an important step as it not only highlights the conclusions that can be drawn from existing studies but also proposes where there is a lack of data that can help further develop this area of study. The studies done were majorly targeting marine organisms rather than species that humans eat, meaning their research may have missed more in-depth seafood-specific data as it wasn’t what they were looking for. There is also the limitation that some of the figures used are based on simulations built upon calculations rather than actual real-world data. There is a seemingly larger focus on the biomagnification of MPs within food chains within marine ecosystems rather than bioaccumulation. This data could potentially be used and manipulated to draw further conclusions regarding bioaccumulation rather than biomagnification. A lack of correlation in some results is most likely due to the random nature of in situ environments, which may by chance show a lack of correlation between MPs and trophic levels, or in other studies, it may demonstrate a strong correlation, neither would be “wrong” however, this means a vast number of studies are needed to be done to average the data and gain a deeper analysis of the whole study area. This is why a suggested laboratory test would be more efficient as it can collect more specific results which aren’t limited to chance. This study can not only enable people to be aware of the seafood which is the least likely to have MPs, but it can also allow companies to target certain fish markets which are less susceptible to MP bioaccumulation, making their products more appealable.
CONCLUSION
The findings suggest that overall, there is a spike in MP bioaccumulation at trophic level 2.5. Generally, there is a higher number of MP intake from levels 2-3, however, due to the randomness of the in-situ setting, it is a lot harder to measure because of a lack of controllable variables in terms of how many MPs are introduced to different species. This information demonstrates an acceptance of the alternative hypothesis: Seafood species of lower trophic levels will be more susceptible to the bioaccumulation of MP chemicals. A study evaluating the amount of data there already is surrounding the MP consumption regarding the percentage of chemical confirmations within the species demonstrated that there was a significant discrepancy between the amount of research on MP consumption for seafood species in trophic levels 2-2.9, but there was a comfortable amount of study on levels 34.5. This posed the question of whether the data and analysis were accurate, however, this is hard to judge as it is in a random environment rather than in a laboratory which would have a significant increase in the variables which could be controlled. In situ environments provide a lot less explainable results than if they were to be tested in laboratories, as the experiment conductor can target variables and isolate causes for different effects, however, in situ it could be one of many different unknown factors. Ultimately, there would need to be a lot more research in both situ and laboratories targeting specifically the different trophic levels, not leaving any discrepancies in what levels are tested, and targeting seafood species rather than general marine organisms, as it allows a further development of understanding which can be implemented to improve human health and quality of life.
ACKNOWLEDGMENTS
The author would like to acknowledge and thank all the sources which have contributed to the final conclusions of this study.
REFERENCES
1. Akhbarizadeh, R, Dobaradaran, S, Nabipour, I, Tajbakhsh, S, Darabi, AH & Spitz, J2020, ‘Abundance, composition, and potential intake of microplastics in canned fish’, Marine Pollution Bulletin, vol. 160, p. 111633.
2. Akhbarizadeh, R, Moore, F & Keshavarzi, B 2019, ‘Investigating microplastics bioaccumulation and biomagnification in seafood from the Persian Gulf: a threat to human health?’, Food Additives & Contaminants: Part A, vol. 36, no. 11, pp. 1696–1708.
3. Alava, JJ 2020, ‘Modeling the Bioaccumulation and Biomagnification Potential of Microplastics in a Cetacean Foodweb of the Northeastern Pacific: a Prospective Tool to Assess the Risk Exposure to Plastic Particles’, Frontiers in Marine Science, vol. 7.
4. Andreas, Hadibarata, T & Sathishkumar, P 2021, ‘Microplastic contamination in the Skipjack Tuna (Euthynnus affinis) collected from Southern Coast of Java, Indonesia’, Chemosphere, vol. 276, p. 130185.
5. Haidich, AB 2010, ‘Meta-analysis in Medical Research’, Hippokratia, vol. 14, LITHOGRAPHIA Antoniadis I.Psarras Th. G.P., no. Suppl 1, pp. 29–37.
6. Hansen, C, Steinmetz, H & Block, J 2021, ‘How to conduct a metaanalysis in eight steps: a practical guide’, Management Review Quarterly.
7. Hussien, NA 2021, ‘Investigating microplastics and potentially toxic elements contamination in canned Tuna, Salmon, and Sardine fishes from Taif markets, KSA’, Open Life Sciences, vol. 16, no. 1, pp. 827–837.
8. Kim, J-H, Yu, Y-B & Choi, J-H 2021, ‘Toxic effects on bioaccumulation, hematological parameters, oxidative stress, immune responses and neurotoxicity in fish exposed to microplastics: A review’, Journal of Hazardous Materials, vol. 413, p. 125423.
9. Mikolajewicz, N 2019, ‘Meta-Analytic Methodology for Basic Research: A Practical Guide’, Frontiers in Physiology, vol. 10, no. 1.
10. Miller, ME, Hamann, M & Kroon, FJ 2020, ‘Bioaccumulation and biomagnification of microplastics in marine organisms: A review and meta-analysis of current data’, in A Mukherjee (ed.), PLOS ONE, vol. 15, no. 10, p. e0240792.
11. Rios-Fuster, B, Alomar, C, Viñas, L, Campillo, JA, Pérez-Fernández, B, Álvarez, E, Compa, M & Deudero, S 2021, ‘Organochlorine pesticides (OCPs) and polychlorinated biphenyls (PCBs) occurrence in Sparus aurata exposed to microplastic enriched diets in aquaculture facilities’, Marine Pollution Bulletin, vol. 173, p. 113030, viewed 10 September 2022
12. Schäfer, S 2015, ‘Bioaccumulation in aquatic systems: methodological approaches, monitoring and assessment’, Environmental Sciences Europe, vol. 27, no. 1.
13. Stanley, M 2022, Microplastics | National Geographic Society, education.nationalgeographic.org, National Geographic Society.
14. Won, E-J, Choi, B, Hong, S, Khim, JS & Shin, K-H 2018, ‘Importance of accurate trophic level determination by nitrogen isotope of amino acids for trophic magnification studies: A review’, Environmental Pollution, vol. 238, pp. 677–690.
15. 15. Yodzi, P, Reichle, DE & Trites, AW 2017, Trophic Level - an overview | ScienceDirect Topics, Sciencedirect.com.
APPENDIX
https://docs.google.com/spreadsheets/d/1 FdGtaQpN8HiI75qMaMzWecu7l1cj1oudy 5ToyJWvLDQ/edit?usp=sharing