The Role of Intergovernmental Fiscal Transfers in Improving Education Outcomes

Page 98

62 |  The Role of Intergovernmental Fiscal Transfers in Improving Education Outcomes

FIGURE 4.9

Gender parity index, by state 160

145

140

100

124 104

98 84

80

84 58

60

85

86

87 68

91

88

103 92 91 88

99 93

94

114 100 95 98 96 9896 94

99 79

68

100

103

77

87

94 90

57

40 20

Primary

Su da n

ar G ez ira W hi te N ile No So rth ut er h n Ko r No do rth fa n K or do No fa n rth D ar fu r Ri ve rN ile Bl ue Ni So le ut h D ar fu r Kh ar to um

Se nn

Ka ss al a ra l D W a es rfu tK r or do fa Ea n st D ar fu W r es tD ar fu r El -G ad ar if Re d Se a

0

Ce nt

Percent

120

Secondary

Source: World Bank calculations based on data from National Household Budget and Poverty Survey 2014–15.

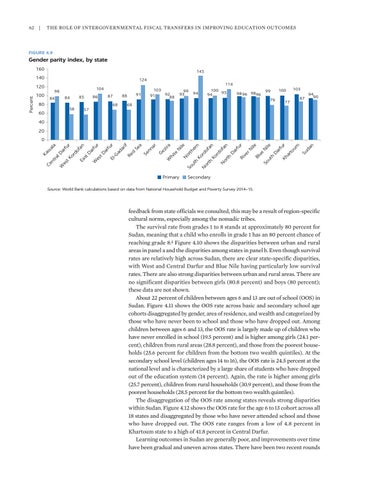
feedback from state officials we consulted, this may be a result of region-specific cultural norms, especially among the nomadic tribes. The survival rate from grades 1 to 8 stands at approximately 80 percent for Sudan, meaning that a child who enrolls in grade 1 has an 80 percent chance of reaching grade 8.2 Figure 4.10 shows the disparities between urban and rural areas in panel a and the disparities among states in panel b. Even though survival rates are relatively high across Sudan, there are clear state-specific disparities, with West and Central Darfur and Blue Nile having particularly low survival rates. There are also strong disparities between urban and rural areas. There are no significant disparities between girls (80.8 percent) and boys (80 percent); these data are not shown. About 22 percent of children between ages 6 and 13 are out of school (OOS) in Sudan. Figure 4.11 shows the OOS rate across basic and secondary school age cohorts disaggregated by gender, area of residence, and wealth and categorized by those who have never been to school and those who have dropped out. Among children between ages 6 and 13, the OOS rate is largely made up of children who have never enrolled in school (19.5 percent) and is higher among girls (24.1 percent), children from rural areas (28.8 percent), and those from the poorest households (25.6 percent for children from the bottom two wealth quintiles). At the secondary school level (children ages 14 to 16), the OOS rate is 24.5 percent at the national level and is characterized by a large share of students who have dropped out of the education system (14 percent). Again, the rate is higher among girls (25.7 percent), children from rural households (30.9 percent), and those from the poorest households (28.5 percent for the bottom two wealth quintiles). The disaggregation of the OOS rate among states reveals strong disparities within Sudan. Figure 4.12 shows the OOS rate for the age 6 to 13 cohort across all 18 states and disaggregated by those who have never attended school and those who have dropped out. The OOS rate ranges from a low of 4.8 percent in Khartoum state to a high of 41.8 percent in Central Darfur. Learning outcomes in Sudan are generally poor, and improvements over time have been gradual and uneven across states. There have been two recent rounds


Turn static files into dynamic content formats.

Create a flipbook

Articles inside

Notes

2min
page 333

References

9min
pages 334-339

Key policy directions

2min
page 332

Fiscal transfer mechanisms

2min
page 312

education?

2min
page 311

10.2 Education expenditure in Shandong, 2018

7min
pages 307-309

9.1 Evolution of the allocation mechanism in school finance

2min
page 288

9.2 Improving education outcomes in Ceará, Brazil

5min
pages 296-297

Key policy directions to strengthen decentralized education financing

5min
pages 294-295

Introduction

2min
page 301

9.4 Pillars for central government education transfers to municipalities

4min
pages 284-285

governments

7min
pages 274-276

Conclusion

2min
page 265

References

3min
pages 268-270

Notes

7min
pages 266-267

8.2 Change in IDEB scores, 2005–17

1min
page 263

Impact of Brazil’s decentralized financing system on subnational spending and education outcomes

2min
page 258

in Ceará

4min
pages 253-254

8.10 Federal contributions to FUNDEB, 2007–17

2min
page 252

8.7 Brazil’s results on PISA, 2000–18

1min
page 245

8.1 Learning poverty in Brazilian municipalities, 2017

1min
page 244

8.1 Preuniversity education responsibilities of governments in Brazil

4min
pages 240-241

Introduction

4min
pages 237-238

References

1min
pages 235-236

7.9 Impact of total local expenditure on reading

2min
page 230

7.1 Distribution of education transfers as a zero-sum game

5min
pages 217-218

7.9 Subnational education spending by financing source, 2018

4min
pages 211-212

How is the system financed? Effects of decentralized financing system on subnational spending

2min
page 207

and 2018

2min
page 201

6.13 Transfers and education spending

1min
page 191

Context

1min
page 199

7.12 Allocation of education transfers, 2005–19

2min
page 215

6.15 Predicted education outcomes and district spending

1min
page 194

6.14 District spending and education outcomes

4min
pages 192-193

Introduction

1min
page 173

Fiscal transfer mechanisms

2min
page 183

References

12min
pages 168-172

Notes

9min
pages 165-167

Key policy directions to strengthen the decentralized education finance system

5min
pages 163-164

5.24 GERs in government primary schools, by LG, 2019/20

1min
page 155

and high primary GER and falling secondary GER, 1996/97–2019/20

1min
page 152

Effects of the decentralized finance system on subnational spending and education outcomes

4min
pages 150-151

Introduction

4min
pages 121-122

5.2 Government responsibilities under the Education Act

12min
pages 127-132

4.18 Fund flows in education

1min
page 109

for education

5min
pages 103-104

governments

2min
page 93

4.1 Population pyramid of Sudan, 2000–30

1min
page 90

4.9 Gender parity index, by state

2min
page 98

Notes

2min
page 82

Introduction

1min
page 89

References

10min
pages 83-88

Political economy constraints

2min
page 81

transfers for education

13min
pages 75-80

Education (FUNDEB

2min
page 66

Intergovernmental transfers

2min
page 48

3.3 Marginal effects of fiscal transfers on subnational education spending

5min
pages 61-62

3.3 The No Child Left Behind Act in the United States

5min
pages 72-73

outcomes?

5min
pages 70-71

Tax assignment

2min
page 47

Impact of fiscal transfers in education: A literature review

7min
pages 51-53
Issuu converts static files into: digital portfolios, online yearbooks, online catalogs, digital photo albums and more. Sign up and create your flipbook.
The Role of Intergovernmental Fiscal Transfers in Improving Education Outcomes by World Bank Publications - Issuu