The Role of Intergovernmental Fiscal Transfers in Improving Education Outcomes

Page 90

54 |  The Role of Intergovernmental Fiscal Transfers in Improving Education Outcomes

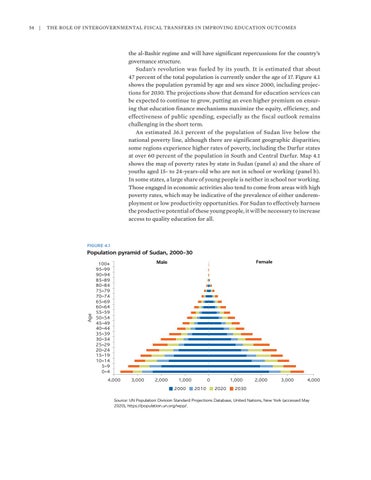
the al-Bashir regime and will have significant repercussions for the country’s governance structure. Sudan’s revolution was fueled by its youth. It is estimated that about 47 percent of the total population is currently under the age of 17. Figure 4.1 shows the population pyramid by age and sex since 2000, including projections for 2030. The projections show that demand for education services can be expected to continue to grow, putting an even higher premium on ensuring that education finance mechanisms maximize the equity, efficiency, and effectiveness of public spending, especially as the fiscal outlook remains challenging in the short term. An estimated 36.1 percent of the population of Sudan live below the national poverty line, although there are significant geographic disparities; some regions experience higher rates of poverty, including the Darfur states at over 60 percent of the population in South and Central Darfur. Map 4.1 shows the map of poverty rates by state in Sudan (panel a) and the share of youths aged 15- to 24-years-old who are not in school or working (panel b). In some states, a large share of young people is neither in school nor working. Those engaged in economic activities also tend to come from areas with high poverty rates, which may be indicative of the prevalence of either underemployment or low productivity opportunities. For Sudan to effectively harness the productive potential of these young people, it will be necessary to increase access to quality education for all.

FIGURE 4.1

Age

Population pyramid of Sudan, 2000–30 Female

Male

100+ 95–99 90–94 85–89 80–84 75–79 70–74 65–69 60–64 55–59 50–54 45–49 40–44 35–39 30–34 25–29 20–24 15–19 10–14 5–9 0–4 4,000

3,000

2,000

1,000 2000

0 2010

1,000 2020

2,000

3,000

4,000

2030

Source: UN Population Division Standard Projections Database, United Nations, New York (accessed May 2020), https://population.un.org/wpp/.


Turn static files into dynamic content formats.

Create a flipbook

Articles inside

Notes

2min
page 333

References

9min
pages 334-339

Key policy directions

2min
page 332

Fiscal transfer mechanisms

2min
page 312

education?

2min
page 311

10.2 Education expenditure in Shandong, 2018

7min
pages 307-309

9.1 Evolution of the allocation mechanism in school finance

2min
page 288

9.2 Improving education outcomes in Ceará, Brazil

5min
pages 296-297

Key policy directions to strengthen decentralized education financing

5min
pages 294-295

Introduction

2min
page 301

9.4 Pillars for central government education transfers to municipalities

4min
pages 284-285

governments

7min
pages 274-276

Conclusion

2min
page 265

References

3min
pages 268-270

Notes

7min
pages 266-267

8.2 Change in IDEB scores, 2005–17

1min
page 263

Impact of Brazil’s decentralized financing system on subnational spending and education outcomes

2min
page 258

in Ceará

4min
pages 253-254

8.10 Federal contributions to FUNDEB, 2007–17

2min
page 252

8.7 Brazil’s results on PISA, 2000–18

1min
page 245

8.1 Learning poverty in Brazilian municipalities, 2017

1min
page 244

8.1 Preuniversity education responsibilities of governments in Brazil

4min
pages 240-241

Introduction

4min
pages 237-238

References

1min
pages 235-236

7.9 Impact of total local expenditure on reading

2min
page 230

7.1 Distribution of education transfers as a zero-sum game

5min
pages 217-218

7.9 Subnational education spending by financing source, 2018

4min
pages 211-212

How is the system financed? Effects of decentralized financing system on subnational spending

2min
page 207

and 2018

2min
page 201

6.13 Transfers and education spending

1min
page 191

Context

1min
page 199

7.12 Allocation of education transfers, 2005–19

2min
page 215

6.15 Predicted education outcomes and district spending

1min
page 194

6.14 District spending and education outcomes

4min
pages 192-193

Introduction

1min
page 173

Fiscal transfer mechanisms

2min
page 183

References

12min
pages 168-172

Notes

9min
pages 165-167

Key policy directions to strengthen the decentralized education finance system

5min
pages 163-164

5.24 GERs in government primary schools, by LG, 2019/20

1min
page 155

and high primary GER and falling secondary GER, 1996/97–2019/20

1min
page 152

Effects of the decentralized finance system on subnational spending and education outcomes

4min
pages 150-151

Introduction

4min
pages 121-122

5.2 Government responsibilities under the Education Act

12min
pages 127-132

4.18 Fund flows in education

1min
page 109

for education

5min
pages 103-104

governments

2min
page 93

4.1 Population pyramid of Sudan, 2000–30

1min
page 90

4.9 Gender parity index, by state

2min
page 98

Notes

2min
page 82

Introduction

1min
page 89

References

10min
pages 83-88

Political economy constraints

2min
page 81

transfers for education

13min
pages 75-80

Education (FUNDEB

2min
page 66

Intergovernmental transfers

2min
page 48

3.3 Marginal effects of fiscal transfers on subnational education spending

5min
pages 61-62

3.3 The No Child Left Behind Act in the United States

5min
pages 72-73

outcomes?

5min
pages 70-71

Tax assignment

2min
page 47

Impact of fiscal transfers in education: A literature review

7min
pages 51-53
Issuu converts static files into: digital portfolios, online yearbooks, online catalogs, digital photo albums and more. Sign up and create your flipbook.
The Role of Intergovernmental Fiscal Transfers in Improving Education Outcomes by World Bank Publications - Issuu