194 | The Role of Intergovernmental Fiscal Transfers in Improving Education Outcomes
TABLE 7.9 Impact
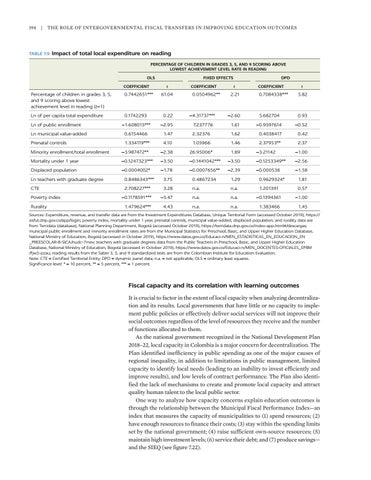
of total local expenditure on reading PERCENTAGE OF CHILDREN IN GRADES 3, 5, AND 9 SCORING ABOVE LOWEST ACHIEVEMENT LEVEL RATE IN READING OLS COEFFICIENT
Percentage of children in grades 3, 5, and 9 scoring above lowest achievement level in reading (t−1)
0.7442651***
Ln of per capita total expenditure
0.1742293
Ln of public enrollment
−1.608015***
FIXED EFFECTS t
61.04
0.22 −2.95
COEFFICIENT
0.0504962**
DPD t
2.21
COEFFICIENT
t
0.7084338***
5.82
−4.31737***
−2.60
5.682704
0.93
7.237776
1.61
−0.9597614
−0.52
Ln municipal value-added
0.6154466
1.47
2.32376
1.62
0.4038417
0.42
Prenatal controls
1.334119***
4.10
1.05966
1.46
2.37953**
2.37
Minority enrollment/total enrollment
−3.987472**
−2.38
26.95006*
1.89
Mortality under 1 year
−0.1247323***
−3.50
−0.1441042***
Displaced population
−0.0004002*
−1.78
−0.0007656**
−3.21142
−1.00
−3.50
−0.1253349**
−2.56
−2.39
−0.000538
−1.58
Ln teachers with graduate degree
0.8486343***
3.75
0.4867234
1.29
0.9629324*
1.81
CTE
2.708227***
3.28
n.a.
n.a.
1.201391
0.57
−0.1178591***
−5.47
n.a.
n.a.
−0.1394361
−1.00
1.479624***
4.43
n.a.
n.a.
1.383466
1.45
Poverty index Rurality
Sources: Expenditure, revenue, and transfer data are from the Investment Expenditures Database, Unique Territorial Form (accessed October 2019), https:// sisfut.dnp.gov.co/app/login; poverty index, mortality under 1 year, prenatal controls, municipal value-added, displaced population, and rurality data are from Terridata (database), National Planning Department, Bogotá (accessed October 2019), https://terridata.dnp.gov.co/index-app.html#/descargas; municipal public enrollment and minority enrollment rates are from the Municipal Statistics for Preschool, Basic, and Upper Higher Education Database, National Ministry of Education, Bogotá (accessed in October 2019), https://www.datos.gov.co/Educaci-n/MEN_ESTADISTICAS_EN_EDUCACION_EN _PREESCOLAR-B-SICA/nudc-7mev; teachers with graduate degrees data from the Public Teachers in Preschool, Basic, and Upper Higher Education Database, National Ministry of Education, Bogotá (accessed in October 2019), https://www.datos.gov.co/Educaci-n/MEN_DOCENTES-OFICIALES_EPBM /fjw5-pzau; reading results from the Saber 3, 5, and 9 standardized tests are from the Colombian Institute for Education Evaluation. Note: CTE = Certified Territorial Entity; DPD = dynamic panel data; n.a. = not applicable; OLS = ordinary least squares. Significance level: * = 10 percent, ** = 5 percent, *** = 1 percent.
Fiscal capacity and its correlation with learning outcomes It is crucial to factor in the extent of local capacity when analyzing decentralization and its results. Local governments that have little or no capacity to implement public policies or effectively deliver social services will not improve their social outcomes regardless of the level of resources they receive and the number of functions allocated to them. As the national government recognized in the National Development Plan 2018–22, local capacity in Colombia is a major concern for decentralization. The Plan identified inefficiency in public spending as one of the major causes of regional inequality, in addition to limitations in public management, limited capacity to identify local needs (leading to an inability to invest efficiently and improve results), and low levels of contract performance. The Plan also identified the lack of mechanisms to create and promote local capacity and attract quality human talent to the local public sector. One way to analyze how capacity concerns explain education outcomes is through the relationship between the Municipal Fiscal Performance Index—an index that measures the capacity of municipalities to (1) spend resources; (2) have enough resources to finance their costs; (3) stay within the spending limits set by the national government; (4) raise sufficient own-source resources; (5) maintain high investment levels; (6) service their debt; and (7) produce savings— and the SIEQ (see figure 7.22).


