Colombia Case Study | 179
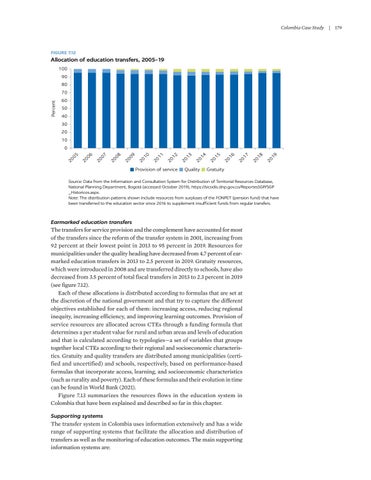
FIGURE 7.12
Allocation of education transfers, 2005–19 100 90 80
Percent
70 60 50 40 30 20 10
Provision of service
Quality
19 20
18 20
17 20
16 20
15 20
14 20
13 20
12 20
11 20
10 20
09 20
08 20
07 20
06 20
20
05
0
Gratuity
Source: Data from the Information and Consultation System for Distribution of Territorial Resources Database, National Planning Department, Bogotá (accessed October 2019), https://sicodis.dnp.gov.co/ReportesSGP/SGP _Historicos.aspx. Note: The distribution patterns shown include resources from surpluses of the FONPET (pension fund) that have been transferred to the education sector since 2016 to supplement insufficient funds from regular transfers.
Earmarked education transfers
The transfers for service provision and the complement have accounted for most of the transfers since the reform of the transfer system in 2001, increasing from 92 percent at their lowest point in 2013 to 95 percent in 2019. Resources for municipalities under the quality heading have decreased from 4.7 percent of earmarked education transfers in 2013 to 2.5 percent in 2019. Gratuity resources, which were introduced in 2008 and are transferred directly to schools, have also decreased from 3.5 percent of total fiscal transfers in 2013 to 2.3 percent in 2019 (see figure 7.12). Each of these allocations is distributed according to formulas that are set at the discretion of the national government and that try to capture the different objectives established for each of them: increasing access, reducing regional inequity, increasing efficiency, and improving learning outcomes. Provision of service resources are allocated across CTEs through a funding formula that determines a per student value for rural and urban areas and levels of education and that is calculated according to typologies—a set of variables that groups together local CTEs according to their regional and socioeconomic characteristics. Gratuity and quality transfers are distributed among municipalities (certified and uncertified) and schools, respectively, based on performance-based formulas that incorporate access, learning, and socioeconomic characteristics (such as rurality and poverty). Each of these formulas and their evolution in time can be found in World Bank (2021). Figure 7.13 summarizes the resources flows in the education system in Colombia that have been explained and described so far in this chapter. Supporting systems
The transfer system in Colombia uses information extensively and has a wide range of supporting systems that facilitate the allocation and distribution of transfers as well as the monitoring of education outcomes. The main supporting information systems are:


