The Role of Intergovernmental Fiscal Transfers in Improving Education Outcomes

Page 211

Colombia Case Study | 175

uncertified counterparts. Finally, certified municipalities have a much higher variation in per student spending, although this might be a result of the difference in sample size between certified municipalities (62 plus Bogotá) and uncertified municipalities (1,038).

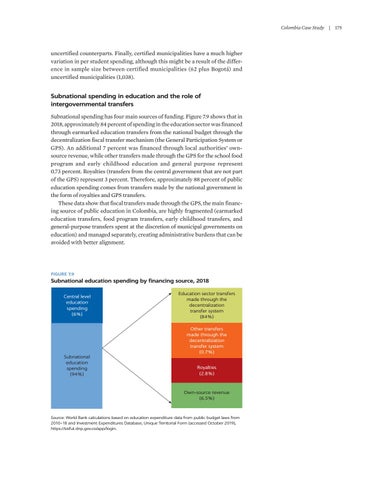
Subnational spending in education and the role of intergovernmental transfers Subnational spending has four main sources of funding. Figure 7.9 shows that in 2018, approximately 84 percent of spending in the education sector was financed through earmarked education transfers from the national budget through the decentralization fiscal transfer mechanism (the General Participation System or GPS). An additional 7 percent was financed through local authorities’ ownsource revenue, while other transfers made through the GPS for the school food program and early childhood education and general purpose represent 0.73 ­percent. Royalties (transfers from the central government that are not part of the GPS) represent 3 percent. Therefore, approximately 88 percent of public education spending comes from transfers made by the national government in the form of royalties and GPS transfers. These data show that fiscal transfers made through the GPS, the main financing source of public education in Colombia, are highly fragmented (earmarked education transfers, food program transfers, early childhood transfers, and ­general-purpose transfers spent at the discretion of municipal governments on ­education) and managed separately, creating administrative burdens that can be avoided with better alignment.

FIGURE 7.9

Subnational education spending by financing source, 2018 Central level education spending (6%)

Subnational education spending (94%)

Education sector transfers made through the decentralization transfer system (84%) Other transfers made through the decentralization transfer system (0.7%) Royalties (2.8%)

Own-source revenue (6.5%)

Source: World Bank calculations based on education expenditure data from public budget laws from 2010–18 and Investment Expenditures Database, Unique Territorial Form (accessed October 2019), https://sisfut.dnp.gov.co/app/login.


Turn static files into dynamic content formats.

Create a flipbook

Articles inside

Notes

2min
page 333

References

9min
pages 334-339

Key policy directions

2min
page 332

Fiscal transfer mechanisms

2min
page 312

education?

2min
page 311

10.2 Education expenditure in Shandong, 2018

7min
pages 307-309

9.1 Evolution of the allocation mechanism in school finance

2min
page 288

9.2 Improving education outcomes in Ceará, Brazil

5min
pages 296-297

Key policy directions to strengthen decentralized education financing

5min
pages 294-295

Introduction

2min
page 301

9.4 Pillars for central government education transfers to municipalities

4min
pages 284-285

governments

7min
pages 274-276

Conclusion

2min
page 265

References

3min
pages 268-270

Notes

7min
pages 266-267

8.2 Change in IDEB scores, 2005–17

1min
page 263

Impact of Brazil’s decentralized financing system on subnational spending and education outcomes

2min
page 258

in Ceará

4min
pages 253-254

8.10 Federal contributions to FUNDEB, 2007–17

2min
page 252

8.7 Brazil’s results on PISA, 2000–18

1min
page 245

8.1 Learning poverty in Brazilian municipalities, 2017

1min
page 244

8.1 Preuniversity education responsibilities of governments in Brazil

4min
pages 240-241

Introduction

4min
pages 237-238

References

1min
pages 235-236

7.9 Impact of total local expenditure on reading

2min
page 230

7.1 Distribution of education transfers as a zero-sum game

5min
pages 217-218

7.9 Subnational education spending by financing source, 2018

4min
pages 211-212

How is the system financed? Effects of decentralized financing system on subnational spending

2min
page 207

and 2018

2min
page 201

6.13 Transfers and education spending

1min
page 191

Context

1min
page 199

7.12 Allocation of education transfers, 2005–19

2min
page 215

6.15 Predicted education outcomes and district spending

1min
page 194

6.14 District spending and education outcomes

4min
pages 192-193

Introduction

1min
page 173

Fiscal transfer mechanisms

2min
page 183

References

12min
pages 168-172

Notes

9min
pages 165-167

Key policy directions to strengthen the decentralized education finance system

5min
pages 163-164

5.24 GERs in government primary schools, by LG, 2019/20

1min
page 155

and high primary GER and falling secondary GER, 1996/97–2019/20

1min
page 152

Effects of the decentralized finance system on subnational spending and education outcomes

4min
pages 150-151

Introduction

4min
pages 121-122

5.2 Government responsibilities under the Education Act

12min
pages 127-132

4.18 Fund flows in education

1min
page 109

for education

5min
pages 103-104

governments

2min
page 93

4.1 Population pyramid of Sudan, 2000–30

1min
page 90

4.9 Gender parity index, by state

2min
page 98

Notes

2min
page 82

Introduction

1min
page 89

References

10min
pages 83-88

Political economy constraints

2min
page 81

transfers for education

13min
pages 75-80

Education (FUNDEB

2min
page 66

Intergovernmental transfers

2min
page 48

3.3 Marginal effects of fiscal transfers on subnational education spending

5min
pages 61-62

3.3 The No Child Left Behind Act in the United States

5min
pages 72-73

outcomes?

5min
pages 70-71

Tax assignment

2min
page 47

Impact of fiscal transfers in education: A literature review

7min
pages 51-53
Issuu converts static files into: digital portfolios, online yearbooks, online catalogs, digital photo albums and more. Sign up and create your flipbook.