The Role of Intergovernmental Fiscal Transfers in Improving Education Outcomes

Page 109

Sudan Case Study | 73

FIGURE 4.18

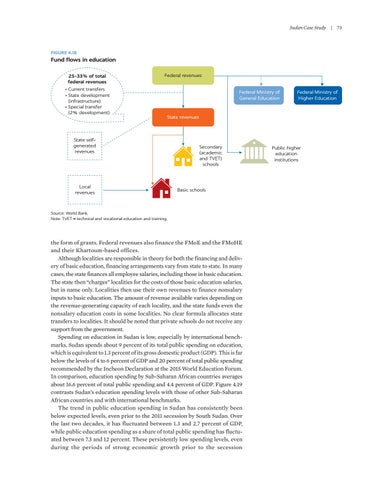
Fund flows in education 25–33% of total federal revenues • Current transfers • State development (infrastructure) • Special transfer (2% development)

Federal revenues Federal Ministry of General Education

Federal Ministry of Higher Education

State revenues

State selfgenerated revenues

Local revenues

Secondary (academic and TVET) schools

Basic schools

Source: World Bank. Note: TVET = technical and vocational education and training.

the form of grants. Federal revenues also finance the FMoE and the FMoHE and their Khartoum-based offices. Although localities are responsible in theory for both the financing and delivery of basic education, financing arrangements vary from state to state. In many cases, the state finances all employee salaries, including those in basic education. The state then “charges” localities for the costs of those basic education salaries, but in name only. Localities then use their own revenues to finance nonsalary inputs to basic education. The amount of revenue available varies depending on the revenue-generating capacity of each locality, and the state funds even the nonsalary education costs in some localities. No clear formula allocates state transfers to localities. It should be noted that private schools do not receive any support from the government. Spending on education in Sudan is low, especially by international benchmarks. Sudan spends about 9 percent of its total public spending on education, which is equivalent to 1.3 percent of its gross domestic product (GDP). This is far below the levels of 4 to 6 percent of GDP and 20 percent of total public spending recommended by the Incheon Declaration at the 2015 World Education Forum. In comparison, education spending by Sub-Saharan African countries averages about 16.6 percent of total public spending and 4.4 percent of GDP. Figure 4.19 contrasts Sudan’s education spending levels with those of other Sub-Saharan African countries and with international benchmarks. The trend in public education spending in Sudan has consistently been below expected levels, even prior to the 2011 secession by South Sudan. Over the last two decades, it has fluctuated between 1.3 and 2.7 percent of GDP, while public education spending as a share of total public spending has fluctuated between 7.3 and 12 percent. These persistently low spending levels, even during the periods of strong economic growth prior to the secession

Public higher education institutions


Turn static files into dynamic content formats.

Create a flipbook

Articles inside

Notes

2min
page 333

References

9min
pages 334-339

Key policy directions

2min
page 332

Fiscal transfer mechanisms

2min
page 312

education?

2min
page 311

10.2 Education expenditure in Shandong, 2018

7min
pages 307-309

9.1 Evolution of the allocation mechanism in school finance

2min
page 288

9.2 Improving education outcomes in Ceará, Brazil

5min
pages 296-297

Key policy directions to strengthen decentralized education financing

5min
pages 294-295

Introduction

2min
page 301

9.4 Pillars for central government education transfers to municipalities

4min
pages 284-285

governments

7min
pages 274-276

Conclusion

2min
page 265

References

3min
pages 268-270

Notes

7min
pages 266-267

8.2 Change in IDEB scores, 2005–17

1min
page 263

Impact of Brazil’s decentralized financing system on subnational spending and education outcomes

2min
page 258

in Ceará

4min
pages 253-254

8.10 Federal contributions to FUNDEB, 2007–17

2min
page 252

8.7 Brazil’s results on PISA, 2000–18

1min
page 245

8.1 Learning poverty in Brazilian municipalities, 2017

1min
page 244

8.1 Preuniversity education responsibilities of governments in Brazil

4min
pages 240-241

Introduction

4min
pages 237-238

References

1min
pages 235-236

7.9 Impact of total local expenditure on reading

2min
page 230

7.1 Distribution of education transfers as a zero-sum game

5min
pages 217-218

7.9 Subnational education spending by financing source, 2018

4min
pages 211-212

How is the system financed? Effects of decentralized financing system on subnational spending

2min
page 207

and 2018

2min
page 201

6.13 Transfers and education spending

1min
page 191

Context

1min
page 199

7.12 Allocation of education transfers, 2005–19

2min
page 215

6.15 Predicted education outcomes and district spending

1min
page 194

6.14 District spending and education outcomes

4min
pages 192-193

Introduction

1min
page 173

Fiscal transfer mechanisms

2min
page 183

References

12min
pages 168-172

Notes

9min
pages 165-167

Key policy directions to strengthen the decentralized education finance system

5min
pages 163-164

5.24 GERs in government primary schools, by LG, 2019/20

1min
page 155

and high primary GER and falling secondary GER, 1996/97–2019/20

1min
page 152

Effects of the decentralized finance system on subnational spending and education outcomes

4min
pages 150-151

Introduction

4min
pages 121-122

5.2 Government responsibilities under the Education Act

12min
pages 127-132

4.18 Fund flows in education

1min
page 109

for education

5min
pages 103-104

governments

2min
page 93

4.1 Population pyramid of Sudan, 2000–30

1min
page 90

4.9 Gender parity index, by state

2min
page 98

Notes

2min
page 82

Introduction

1min
page 89

References

10min
pages 83-88

Political economy constraints

2min
page 81

transfers for education

13min
pages 75-80

Education (FUNDEB

2min
page 66

Intergovernmental transfers

2min
page 48

3.3 Marginal effects of fiscal transfers on subnational education spending

5min
pages 61-62

3.3 The No Child Left Behind Act in the United States

5min
pages 72-73

outcomes?

5min
pages 70-71

Tax assignment

2min
page 47

Impact of fiscal transfers in education: A literature review

7min
pages 51-53
Issuu converts static files into: digital portfolios, online yearbooks, online catalogs, digital photo albums and more. Sign up and create your flipbook.