ECOLOGICAL ASSETS AND STRATEGIES
PROJECT REPORT AUGUST 2019 PRINCIPAL INVESTIGATOR SIMON BUSSIERE PROJECT STAFF MARK LOMBAWA REBECCA OGI
Page intentionally left blank.
TOD WAIPAHU COLLABORATION
2

Page intentionally left blank.
SITE ANALYSIS
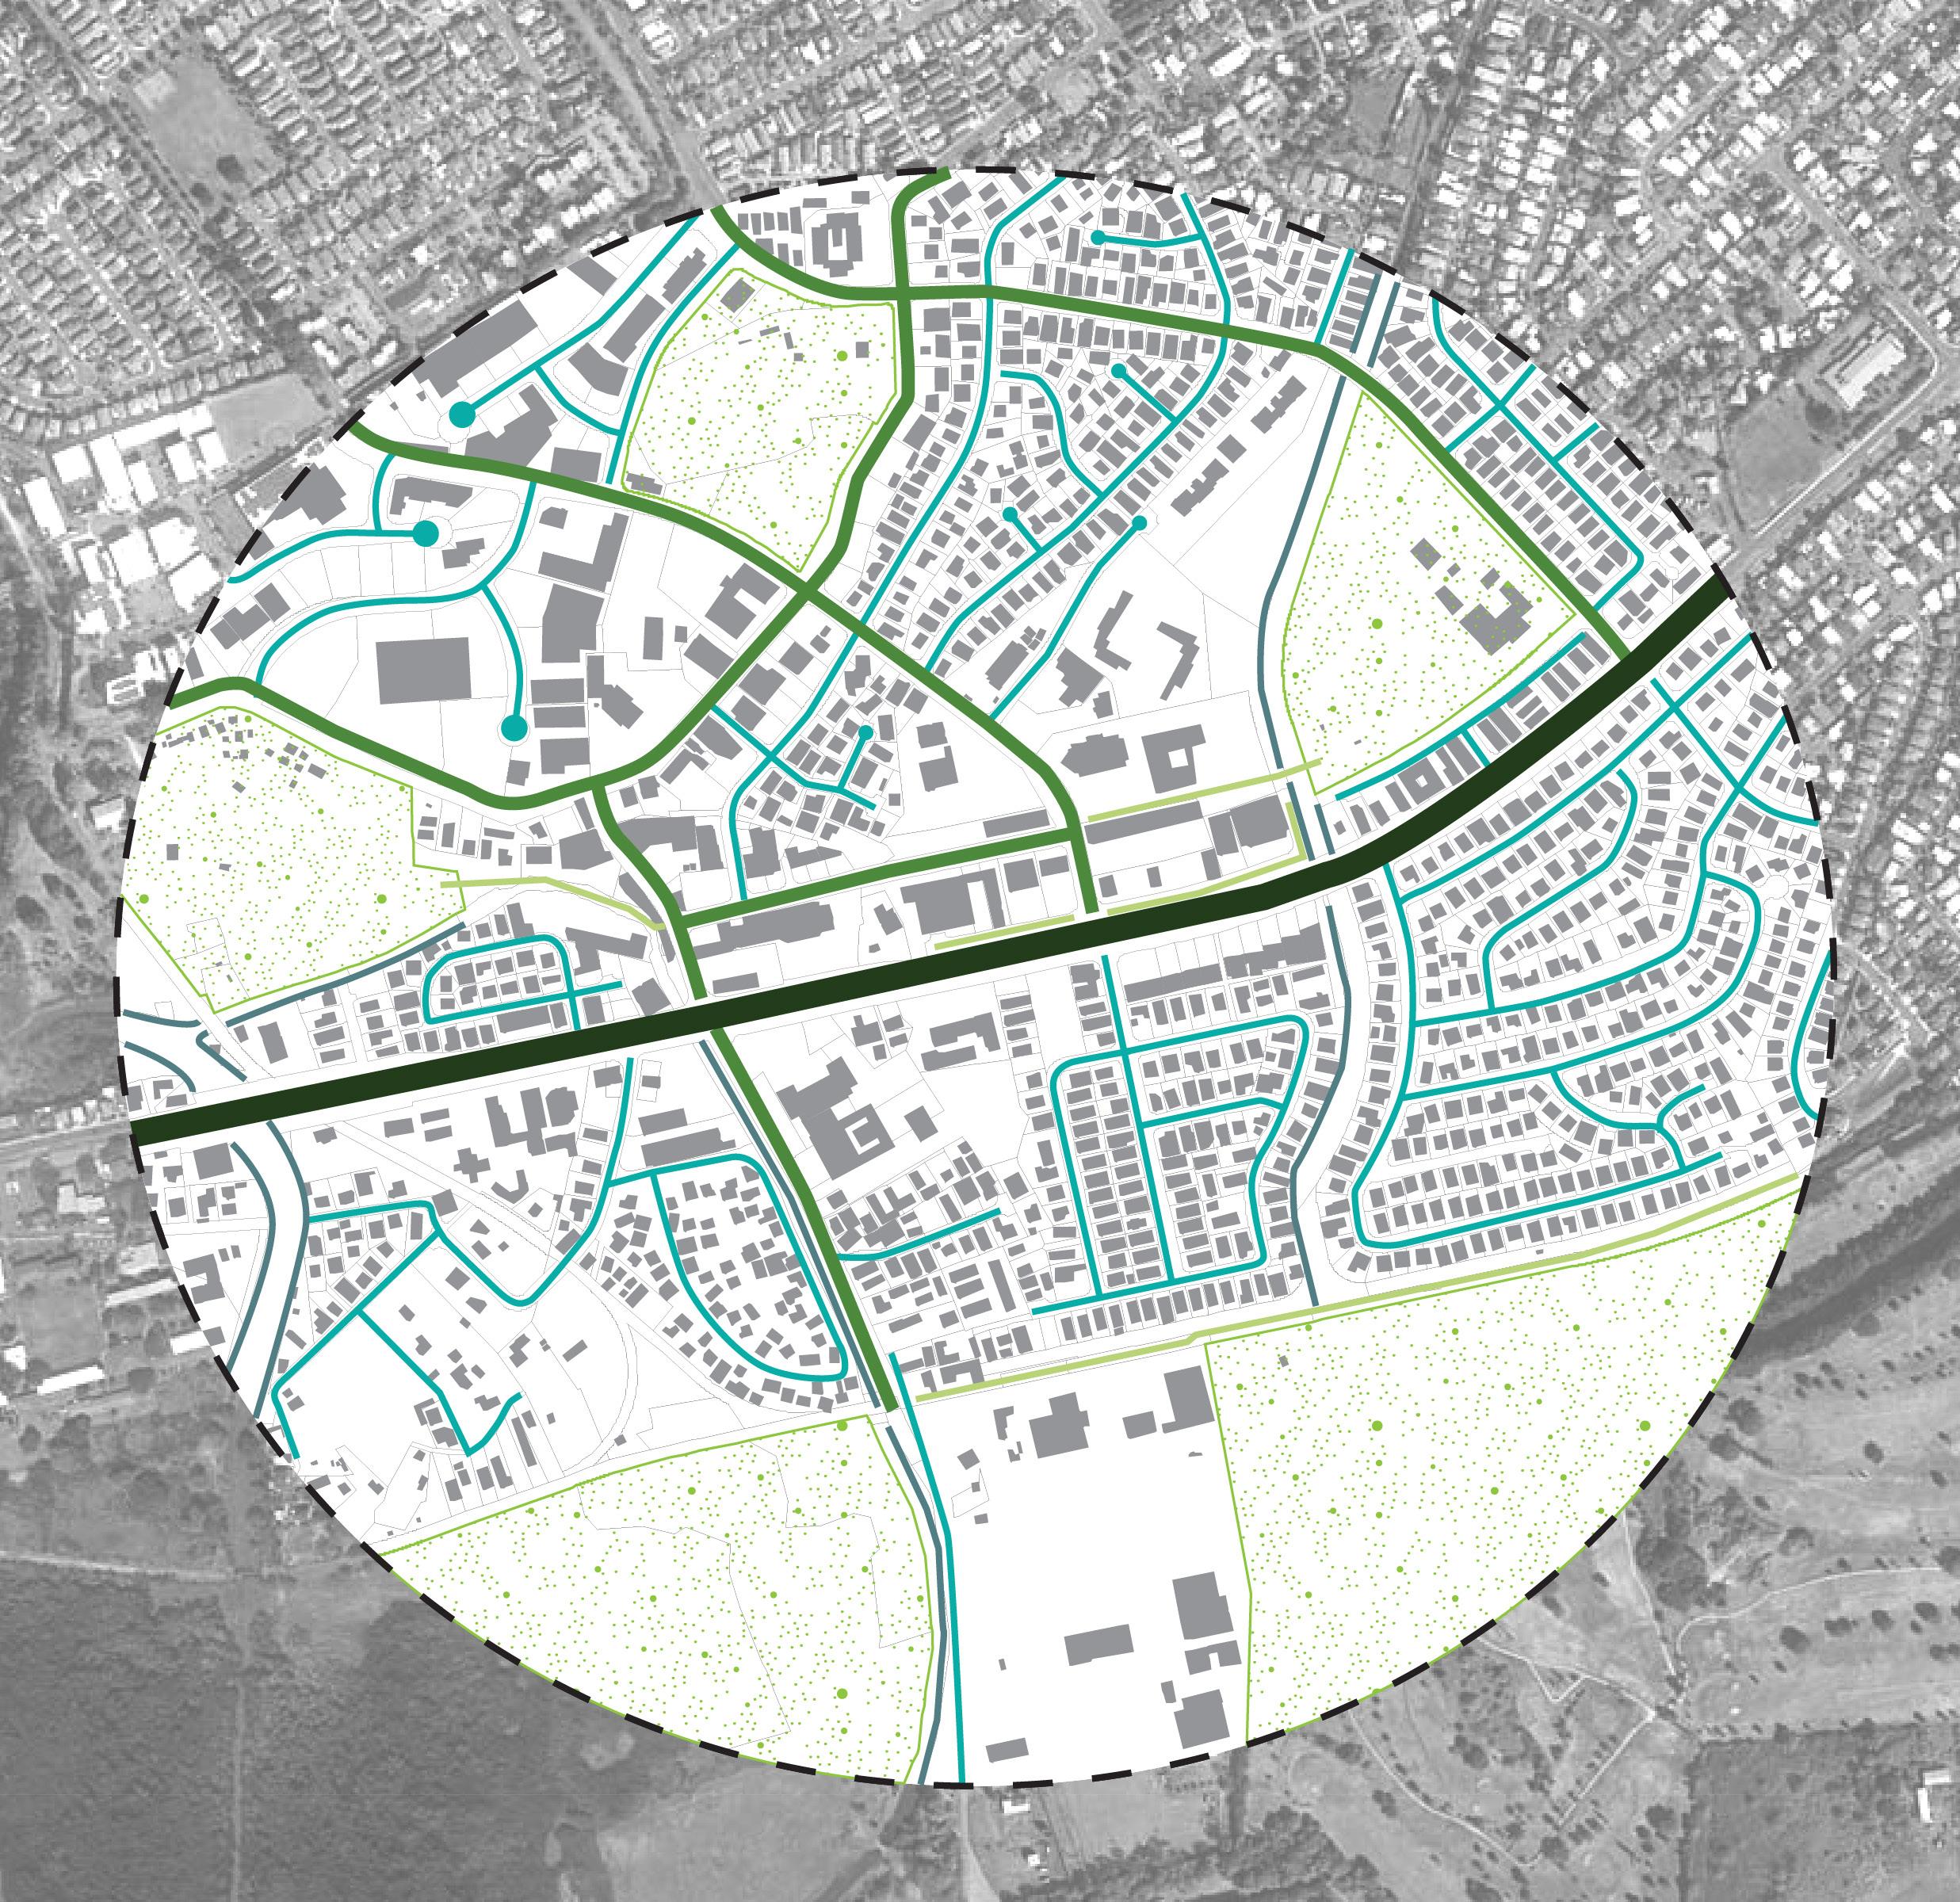
CONNECTIVITY OF THE PROPOSED TOD ZONE
CORRIDOR - LINKING WAIPAHU’S GREEN SPACES URBAN CITIZEN FORESTER SITE INVENTORY
DESIGN CONCEPTS
BY 2035 PHASING
BY 2035 SIMULATION TYPOLOGY CHARACTERISTICS
SAVINGS ANALYSIS
TREE BENEFIT SAVINGS COOLING CALCULATIONS
TREES FOR HONOLULU’S FUTURE DAY PROCLAMATION
SUGGESTED TREE SPECIES MASTER LIST
TREE SPECIES TYPOLOGY LISTS
In response to an increasing average canopy loss across communities in the City and County of Honolulu, Mayor Kirk Caldwell’s office committed on March 9th, 2018 to improving the overall canopy coverage in Honolulu’s urban core to an ambitious 35%. At the time of writing of this report in late 2018, the urban canopy coverage in Waipahu averaged only approximately 9%. That figure includes both private and public land. The substantial projected increase represents a significant investment in the public realm, and is expected to generate a profound impact to the quality of life and the overall ecological health in communities across the City and County.
This brief report is based largely on the momentum of that March 9th Proclamation, and outlines an academic study of existing and potential tree canopy coverage near the Waipahu Transit Station. It was generated by a team of researchers at the University of Hawaiʻi Community Design Center (UHCDC) and prepared for the State of Hawaiʻi Office of Planning (OP). The 1-month study anticipates a process to add to the existing canopy in the coming years, and builds on previous work from a range of public and private agencies including the Hawaiʻi Department of Land and Natural Resources, Division of Forestry and Wildlife (DLNR, DOFAW), The Kaulunani Urban and Community Forestry Program, Trees for Honolulu’s Future, the City & County Office of Climate Change, Sustainability and Resiliency, and Smart Trees Pacific. The UHCDC team referred to several key documents including the 2013 Tree Canopy Report: Honolulu, HI, the 2016 Hawaiʻi Forest Action plan, the 2017 City & County of Honolulu Waipahu Town Action Plan, and the corresponding City & County of Honolulu TOD Brochure for Waipahu.
The study used baseline data from layered spatial analysis and the provided 35% figure to generate a series of maps and diagrams, enclosed in the pages that follow. The study was bolstered by other reports reviewed by the UHCDC team which showed that an additional 64% of land cover could hold more tree canopy. The research team explored several urban canopy precedents from around the globe, and compiled comparable principles and lessons to prepare this visual report which includes a set of maps and recommendations. The initial inventory, conducted with support from Smart Trees Pacific, and The City and County of Honolulu Office of Climate Change, Sustainability and Resiliency (Resilience Office) revealed substantial gaps in the Waipahu TOD zone, generally revealing how the improvement of potential ecological networks across the district in the form of increased canopy coverage would potentially aid in the enhancement of the community as a whole.
In Spring 2017, (ARCH 743) Urban Design Studio VI, a 7th year advanced research and design studio in the professional Doctor
of Architecture Program at the University of Hawai’i School of Architecture focused on mapping and integrating ecological factors into ongoing Transit Oriented Development (TOD) plans for the community of Waipahu. That initial study led to an appreciation for the evident lack of a healthy tree canopy within the TOD zone, particularly in the public realm. At the conclusion of the studio, critics who participated in the design review shared their concern that should the project continue, that some form of canopy assessment and design strategy be shaped in the next stages of the planning and design process. There was some consensus around the idea that such a study could have the potential to help the State and City & County agencies in the development of best-practices, informing current work across agencies and possibly contributing to future TOD canopy design strategies. In light of that support, a proposal was drafted and presented to the State office of Planning as a sub-project to the larger task-order prepared by faculty and staff at the UHCDC. From June 1-30, 2018, a team including Researchers Rebecca Ogi, Mark Lombawa and Professor Simon Bussiere produced the following study. The scope of this study focused geographically on a ¼ mile radius surrounding the Waipahu Transit Station TOD Zone, and developed a set of projections around potential tree canopy improvements.
The initial study was primarily foundational, including basic spatial mapping and analysis of existing landscape data, review of two recent academic studios at the University of Hawaiʻi Department of Urban Planning, and an on-site tree inventory in collaboration with the Honolulu Office of Sustainability and Resilience and Smart Trees Pacific. Following an initial twoweek research period, and with the support of OP, the team worked with Matt Gonser from the City and County’s Office of Climate Change, Sustainability and Resiliency to organize a fieldwork event in collaboration with DLNR DOFAW and Smart Trees Pacific on an inventory of existing trees. Due to the increased development focus of the Transit Oriented Development (TOD) zones, the survey team focused their inventory within a ¼ mile radius of the Waipahu Station TOD. (Page 17.)
That field-verified inventory focused more specifically on the Makai side of the proposed rail in the TOD zone, in the public right-of-way, measuring, identifying and assessing the current ecological value of significant trees in the public realm. The team examined risk factors for tree health, including soil compaction, drainage and proximity to overhead utilities. With the goal of building resilient design strategies into the ongoing and future urban design and planning efforts in Waipahu, the UHCDC team next established a layered visual record of ecological assets through a study of their structure and function of the underlying landscape patterns. The team then drafted a
set of principles and recommendations for future design and planning. Those principles are recorded in the following pages.
Waipahu sits at the mouth of Oʻahu’s central valley, a large ecological saddle formation between the Waiʻanae and Koʻolau shield volcanos, and thus constitutes a massive fresh water resource for the island.
Once considered the Capitol of Oʻahu, Waipahu (wai-, water and pahu, explode or burst) was a major wellspring of cool clear fresh water, and thus a central gathering place for pre-colonial Hawaiian exchange and social interaction. Years of economic extraction and the subsequent development of large-scale mono-functional infrastructures has left the region stripped of much of its original ecological heritage.
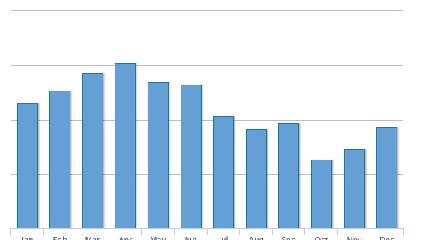
According to data collected at Climatedata.org, the average temperature in Waipahu is 24 degrees Celsius or approximately 75 degrees Fahrenheit.
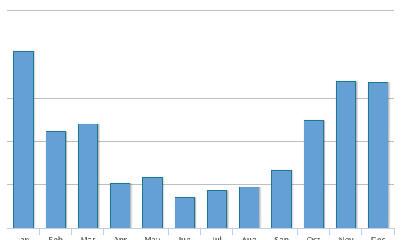
Topographical features on Oʻahu create areas of high and low rainfall. Waipahu is typically dry year-round. However, winter months experience moderate amounts of rain. Waipahu is located in a valley between the Koʻolau and Waiʻanae mountain ranges. Several streams run through the town. However, with impervious surfaces covering a significant area of Waipahu, and with its abundance of high-clay soils, rainfall has little opportunity to be reabsorbed.
Solar radiation is a critical element for Hawaiʻi’s goal for a sustainable future. Photovoltaics and solar heating reduce the
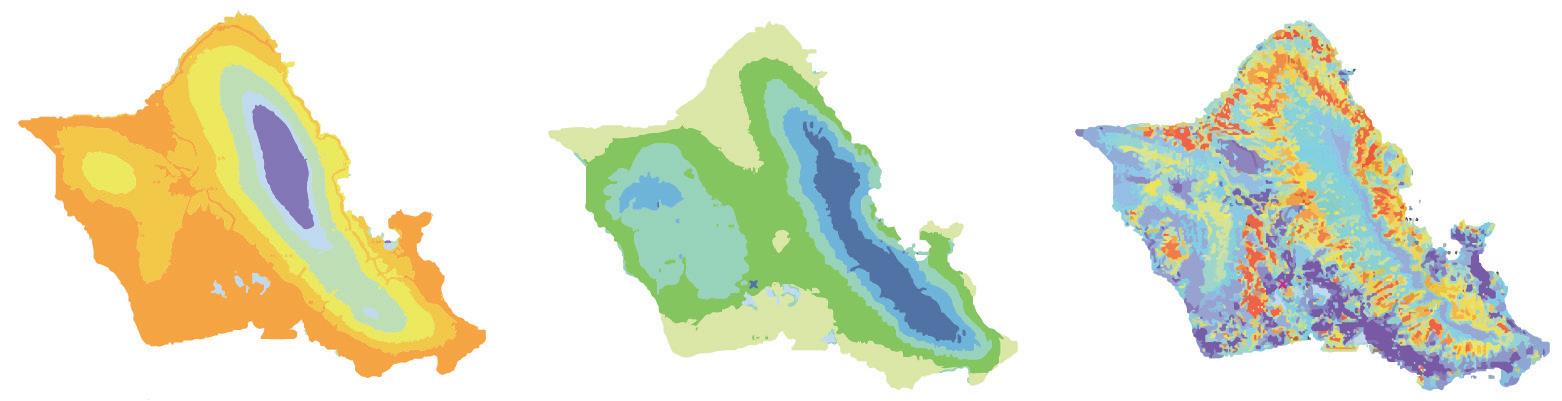
demand for coal- and gas-based electricity. Surfaces like black asphalt absorb solar radiation and reflects energy back as heat. In the urban setting where there is an abundance of these heat-absorbtive surfaces (ex. surface parking lots), average temperatures rise, resulting in what is called the “heat island effect”.
roots
the movement of water through a plant
leaves to facilitate
shade and transpiration
A
to prevent extremes
This phenomenon occurs similarly to how towns near large bodies of water experience milder temperature
This is because water has a high specific heat capacity and can absorb and therefore disperse heat more slowly than air. You can experience this difference when you walk barefoot on a grass field in the middle of the day versus on an asphalt parking lot.
Page intentionally left blank.
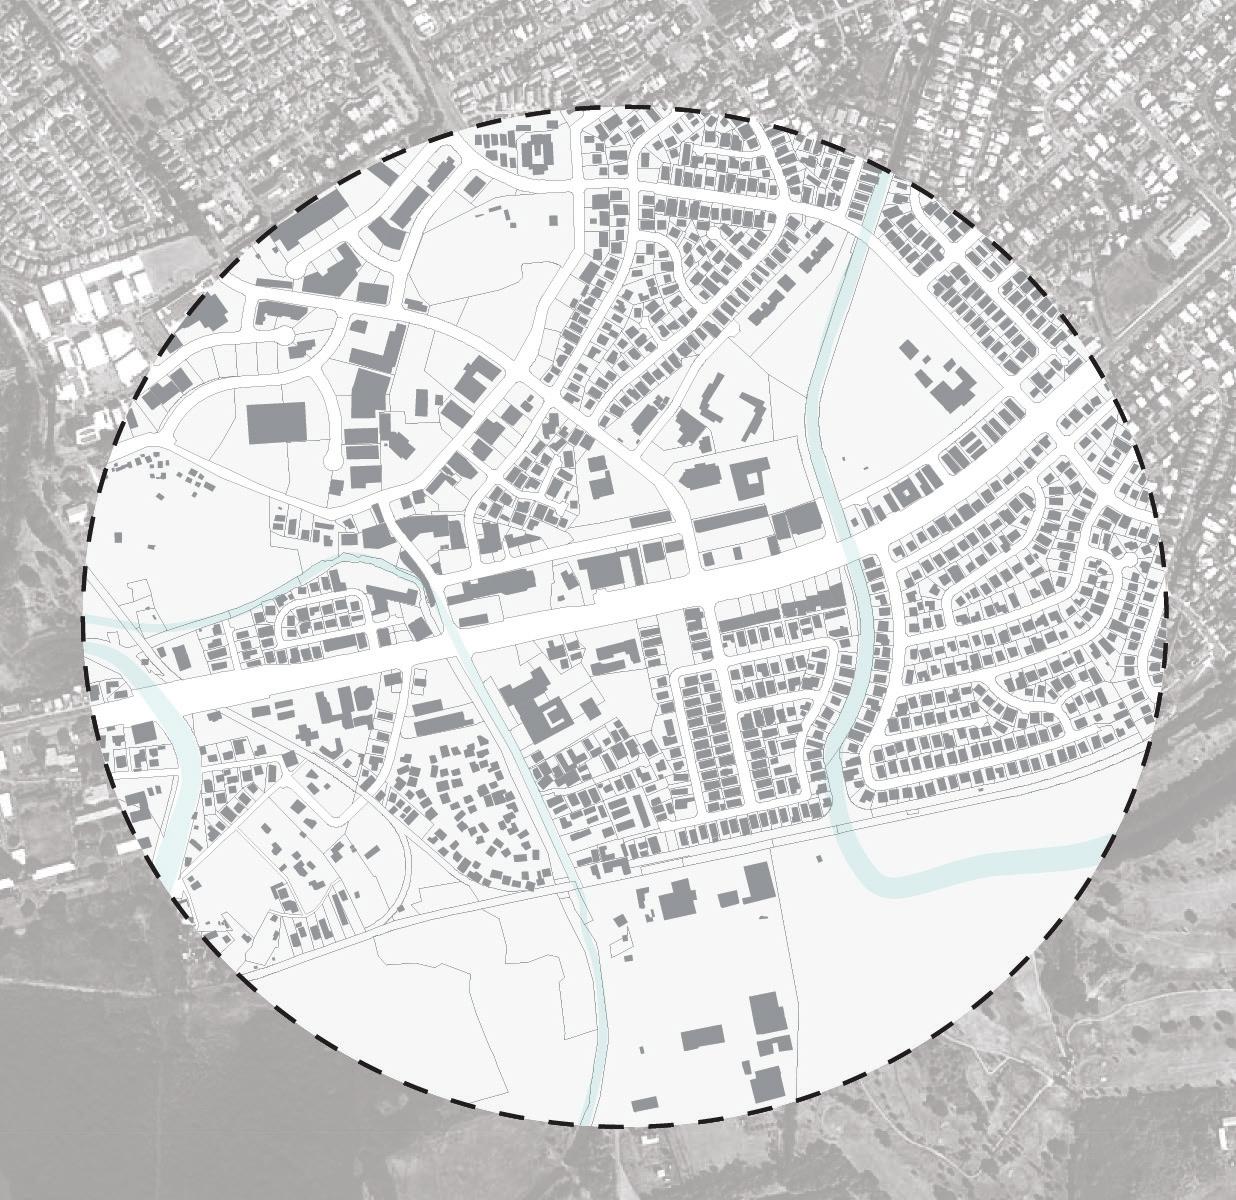
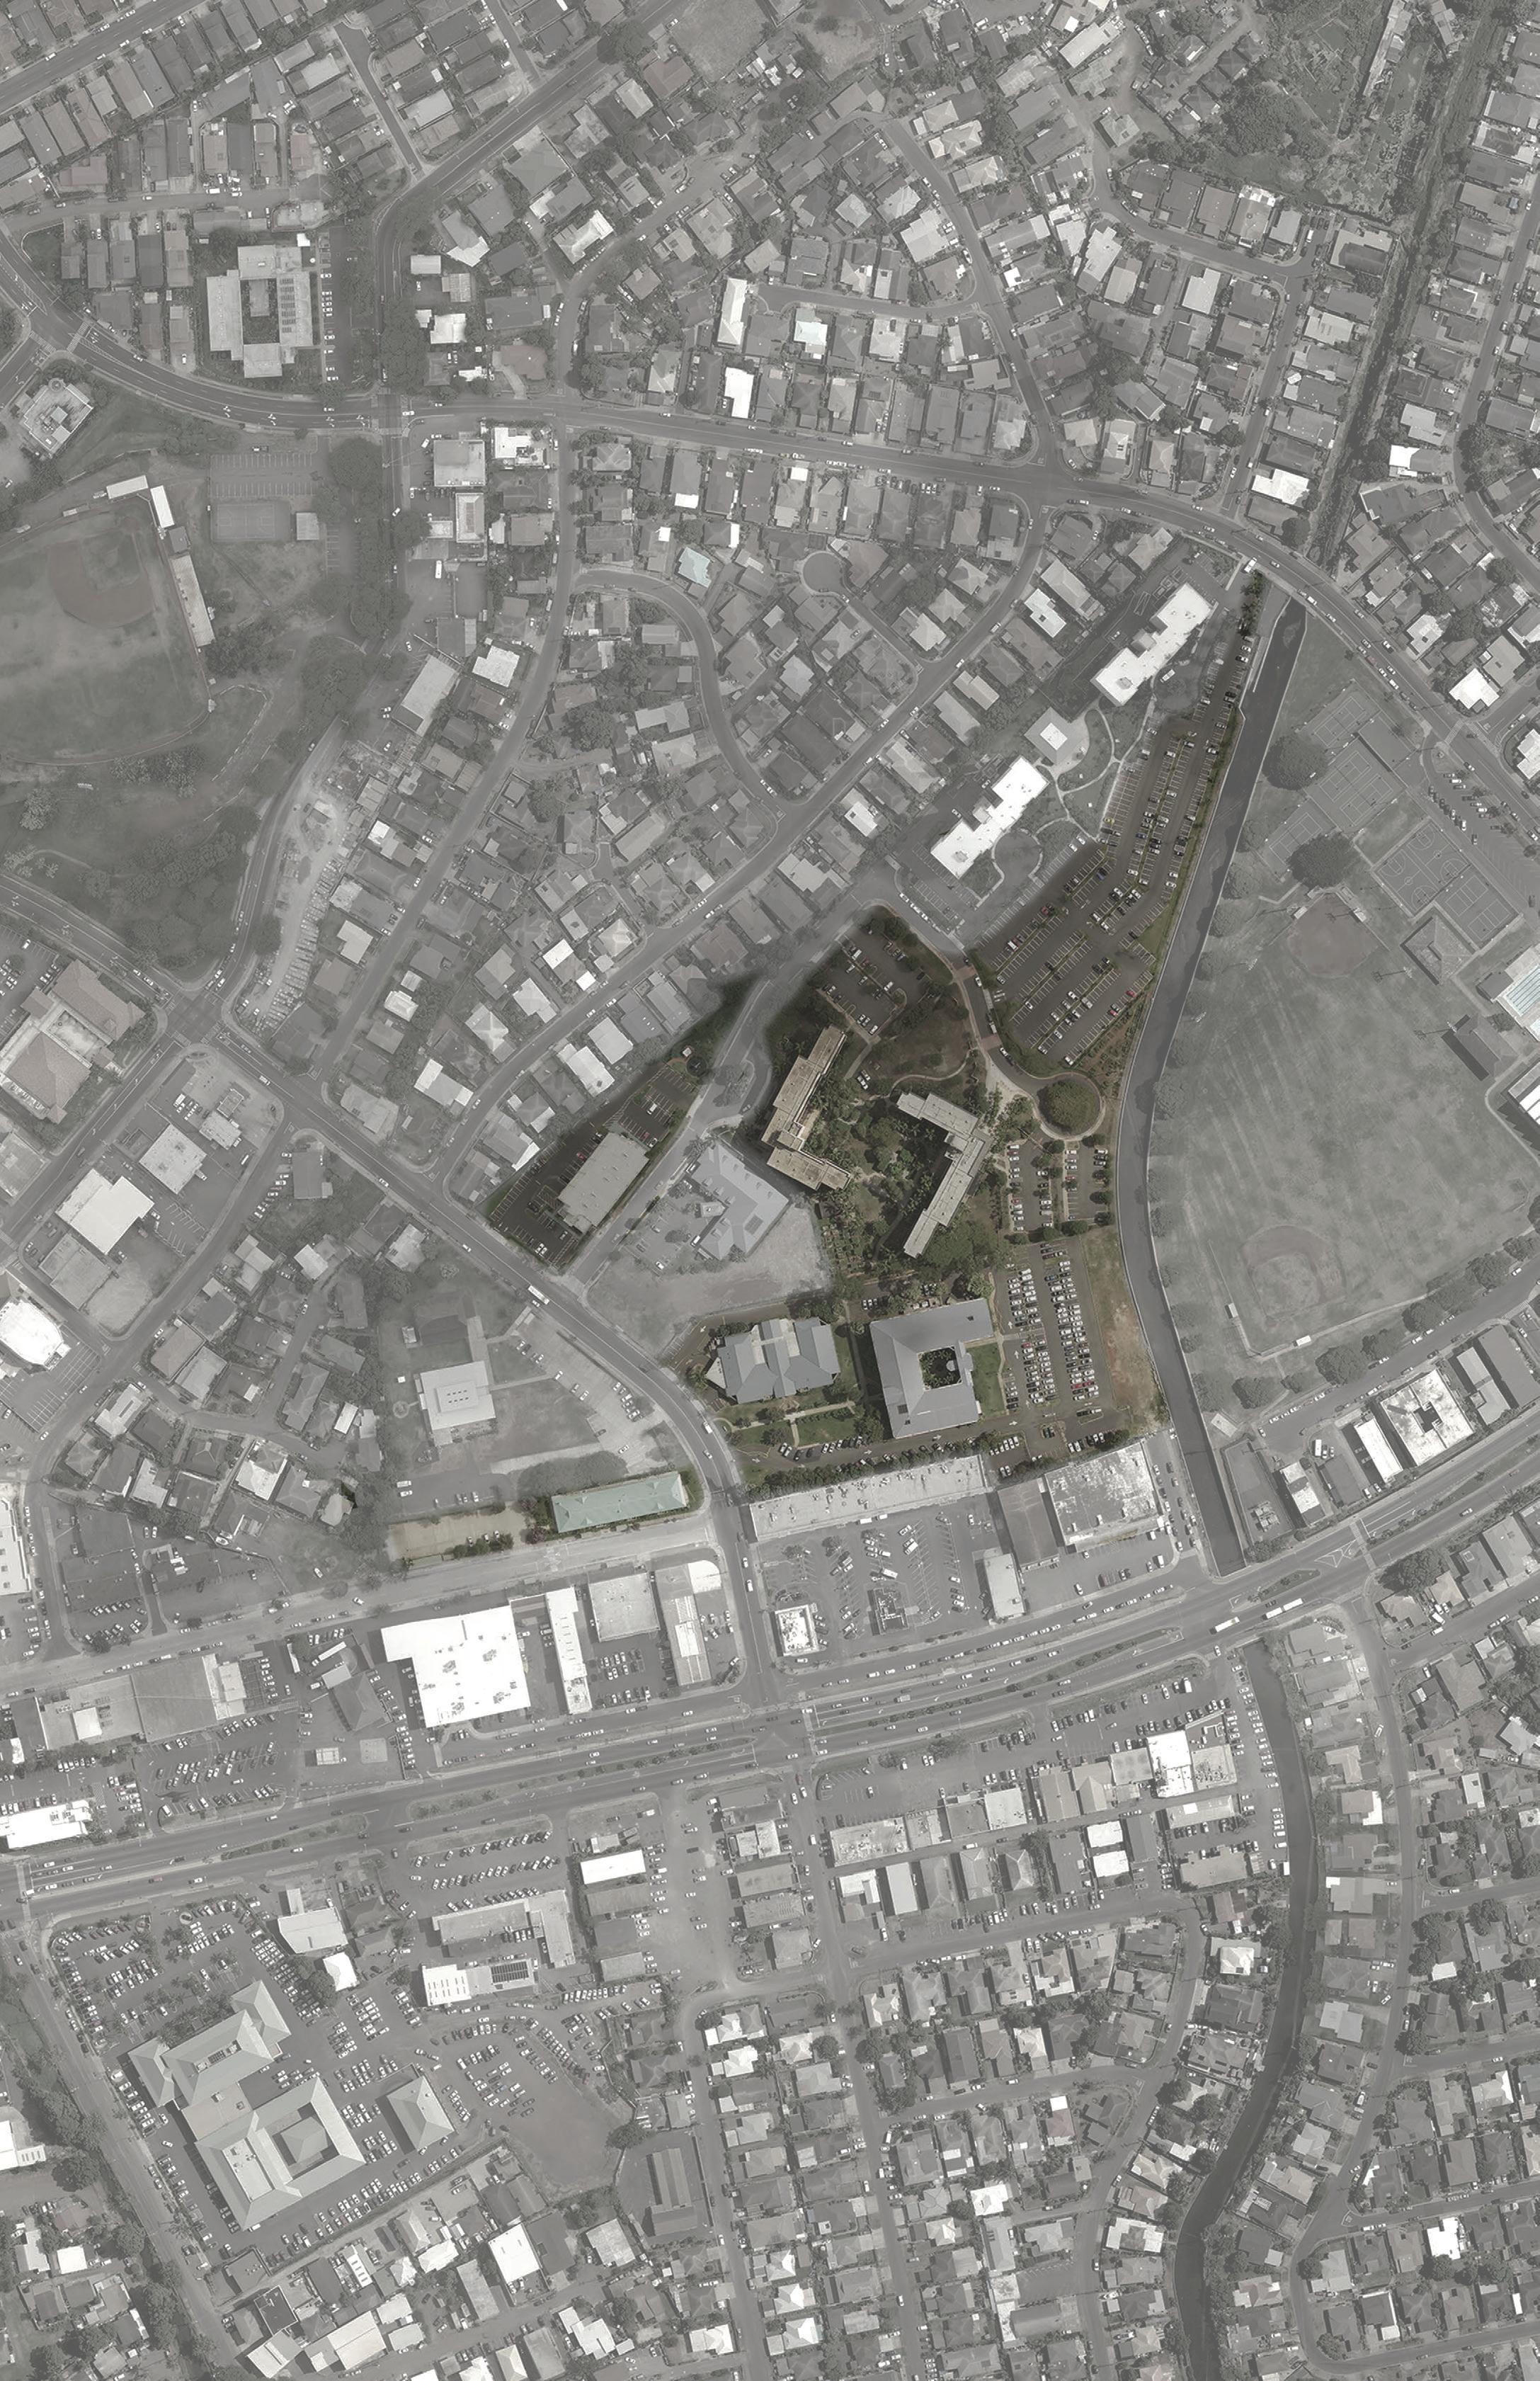
The Waipahu TOD study area is a half mile radius extending from Pouhala Station. The study area includes recreation spaces such as Hawaiʻi Plantation Village, Hans L’Orange Park, Waipahu District Park, Ted Makalena Golf Course, and Pouhala Marsh. The study area also includes commercial and residential neighborhoods.
Despite the presence of large vegetated spaces, tree canopy coverage is low with approximately 9% coverage throughout the entire study area. By utilizing the documents listed on the following page, this report explores different methods to increase canopy coverage and improve the public experience.
Several documents were heavily referenced for the purpose of this tree canopy report. Each document is summarized in the following “Reference Documents” section.
1. City and County of Honolulu. Transit-Oriented Development Zoning Strategy and Process, August 2017.
2. Honolulu City & County TOD. Waipahu Neighborhood TOD Plan, 2016
A Report on Honolulu’s Existing and Possible Tree Canopy
3. Sean MacFaden & Jarlath O’Neil-Dunne University of Vermont Spatial Analysis Laboratory. A Report on Honolulu’s Existing and Possible Tree Canopy, 2010.
Division of Forestry & Wildlife and its Kaulunani Program and Smart Trees Pacific. Tree Canopy Interactive Map
4. Division of Forestry & Wildlife and its Kaulunani Program and Smart Trees Pacific. Tree Canopy Interactive Map. http://cchnl.maps.arcgis.com/apps/ OnePane/basicviewer/index.html?appid=9f94d7913115442b9e1e991c9c3
92f76. Accessed June 18, 2018.
5. City and County of Honolulu. Waipahu Town Action Plan, September 2017.
UHM Urban and Regional Planning. PLAN620 and PLAN678 coursework
6. University of Hawaiʻi at Manoa Department of Urban and Regional Planning. PLAN620 and PLAN678 coursework. Fall 2017.
As visitation to Waipahu increases with the completion of the rail, achieving a high walkability factor will be instrumental to the success of TOD. The presence of trees within the study area has the potential to improve nearly all aspects of the plans listed in the 2017 Transit-Oriented Development Zoning Strategy and Process2 report:
• Land use
• Circulation
• Urban design
• Housing
• Community
• Facilities
• Parking
• Pedestrian amenities
• Historic and cultural enhancements
• Infrastructure
• Opportunities for new development
• Orderly growth
• Improved accessibility around the rail stations
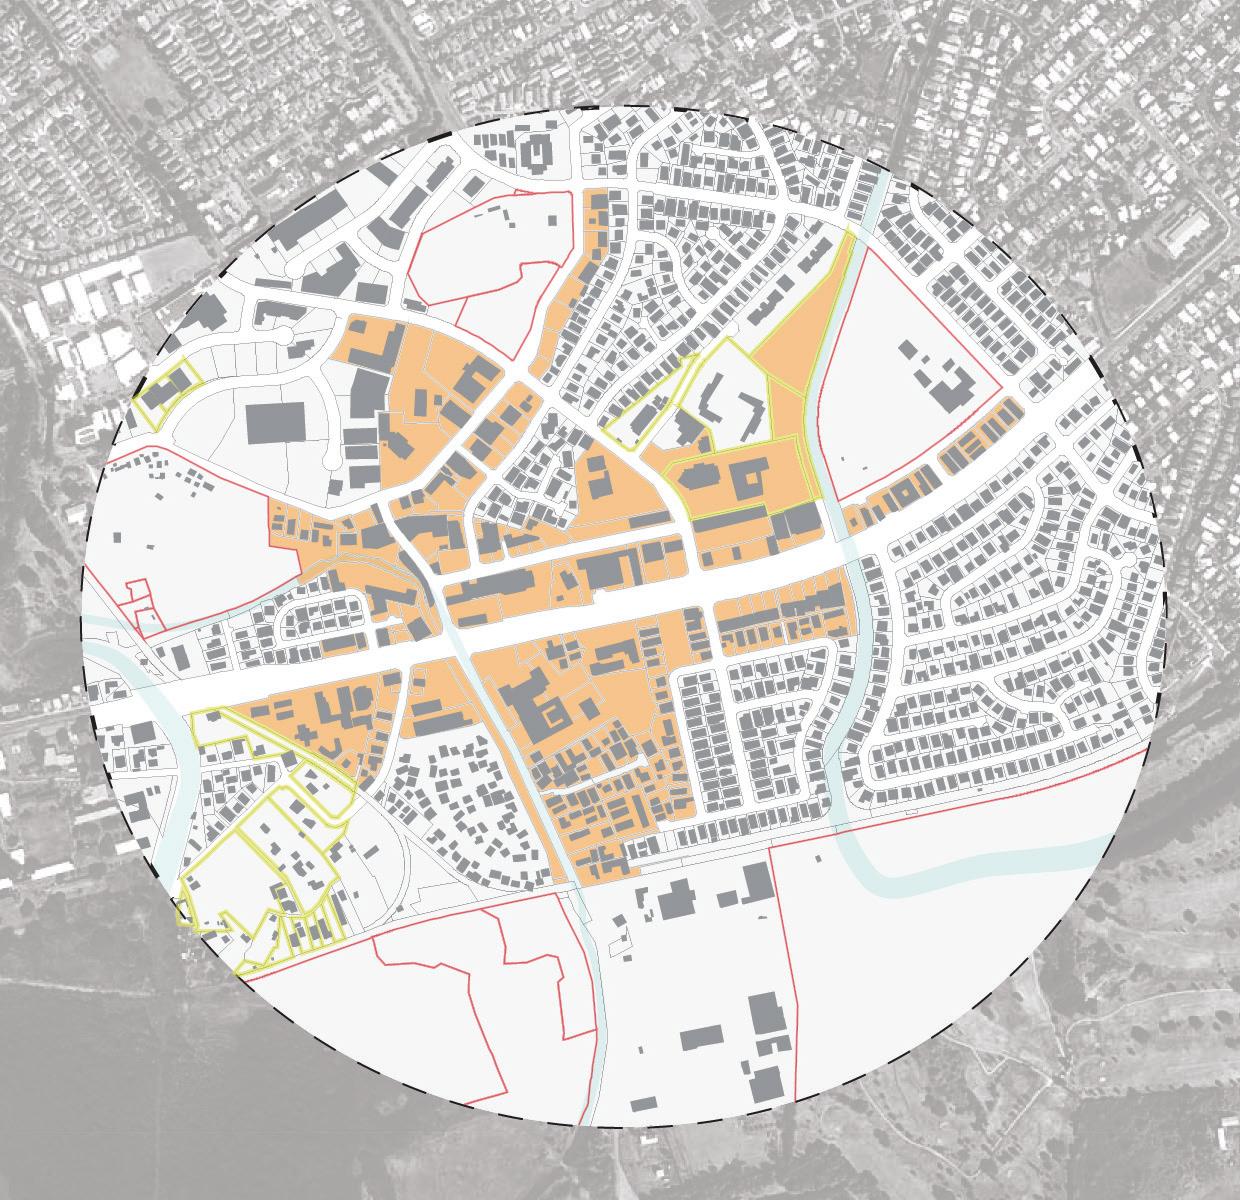
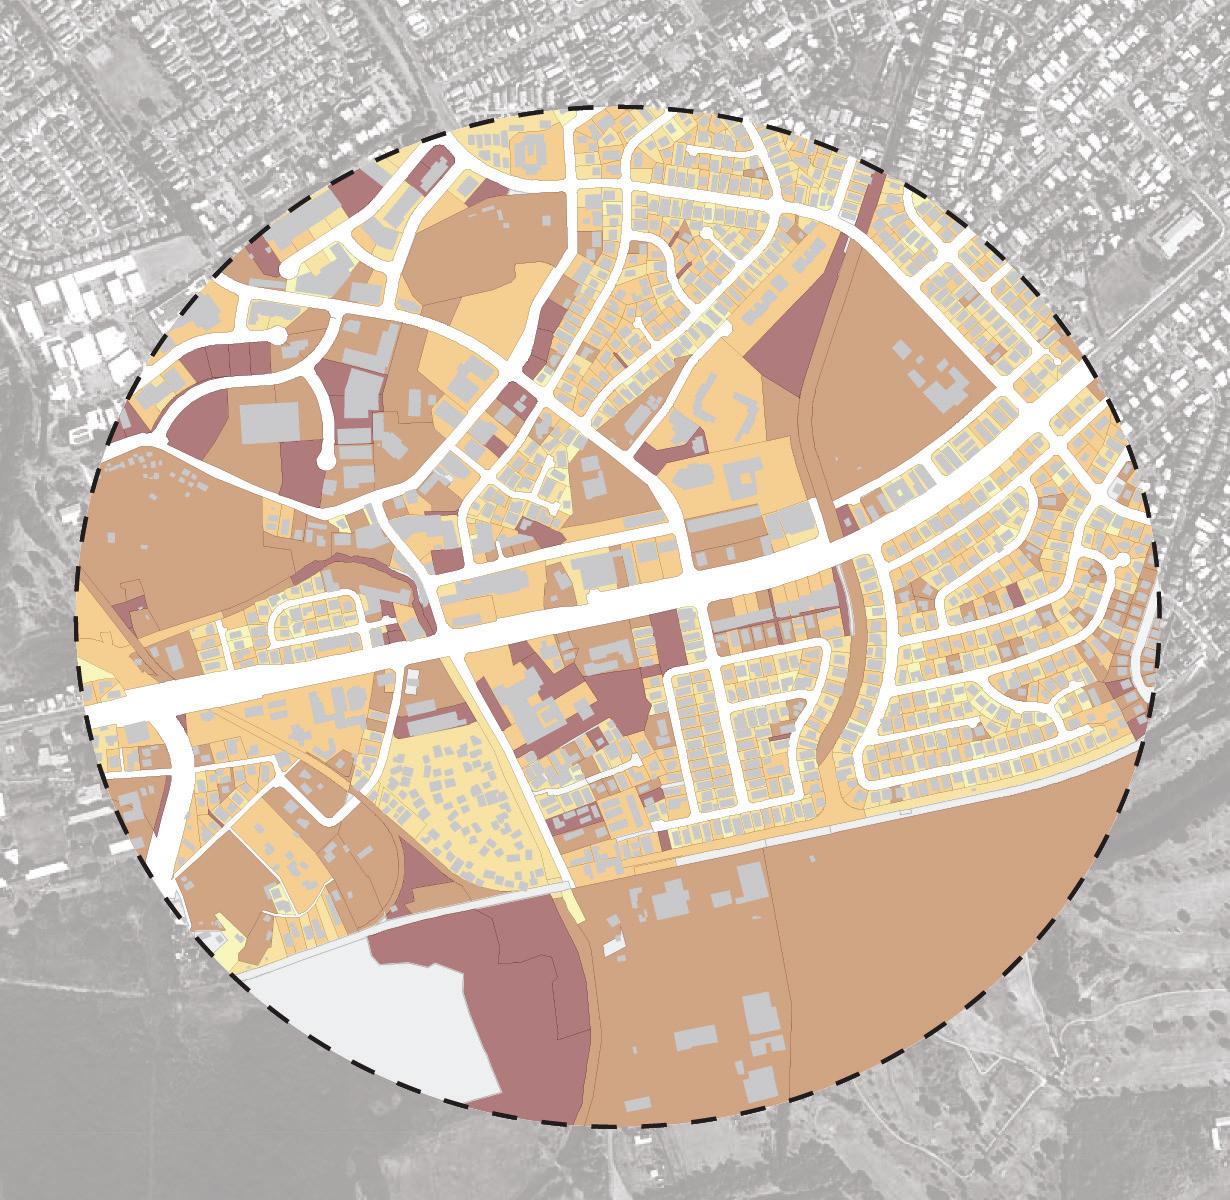
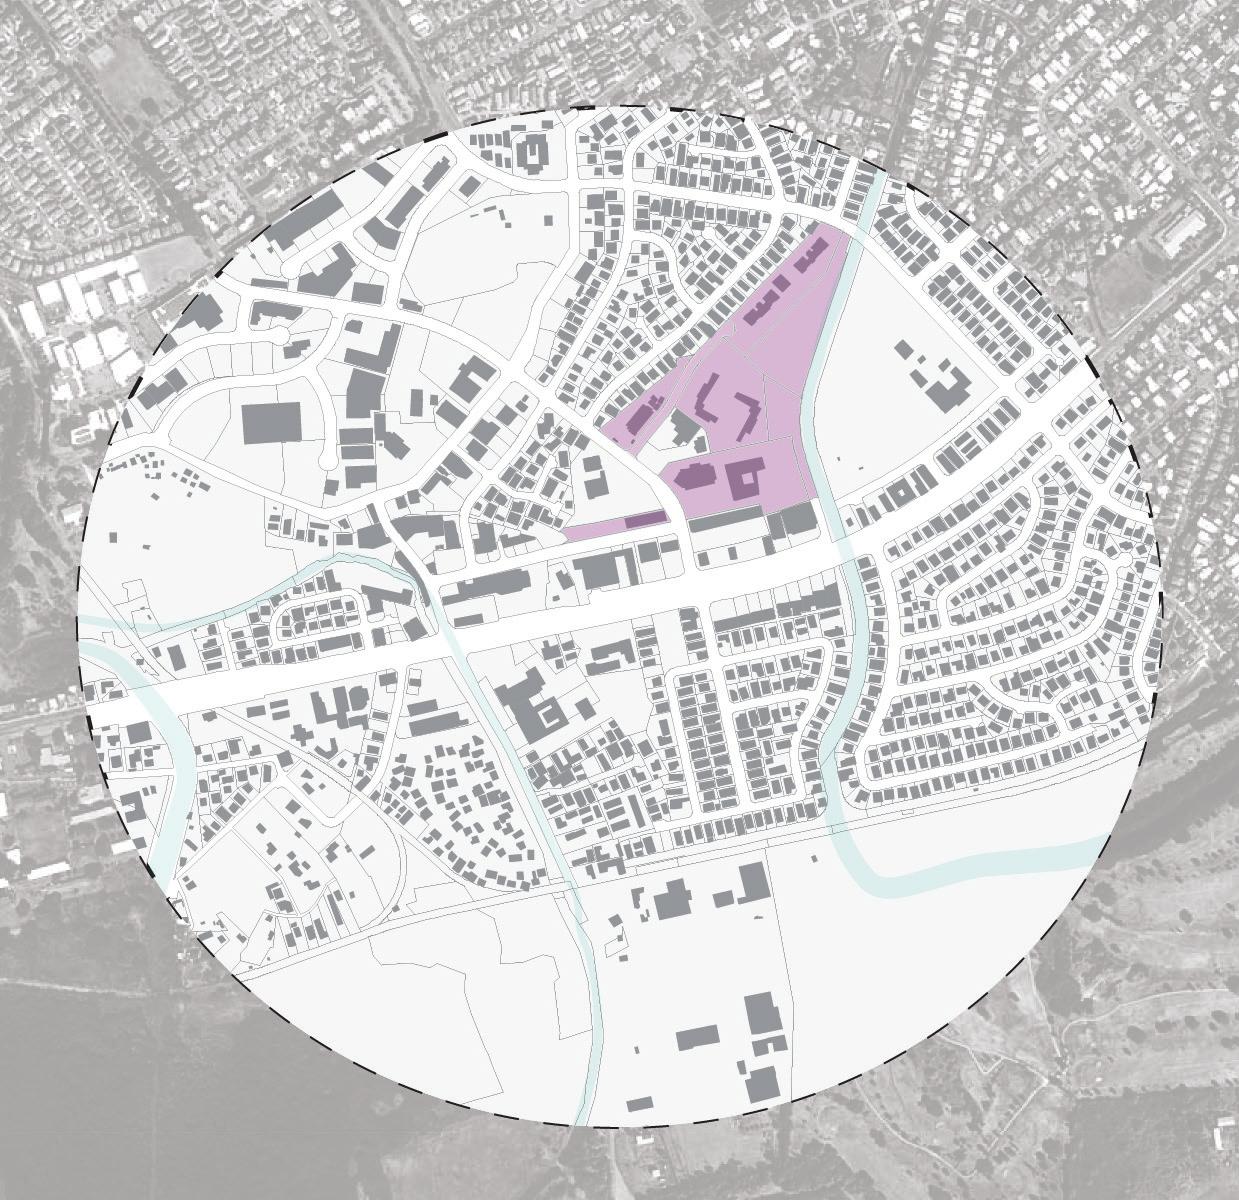
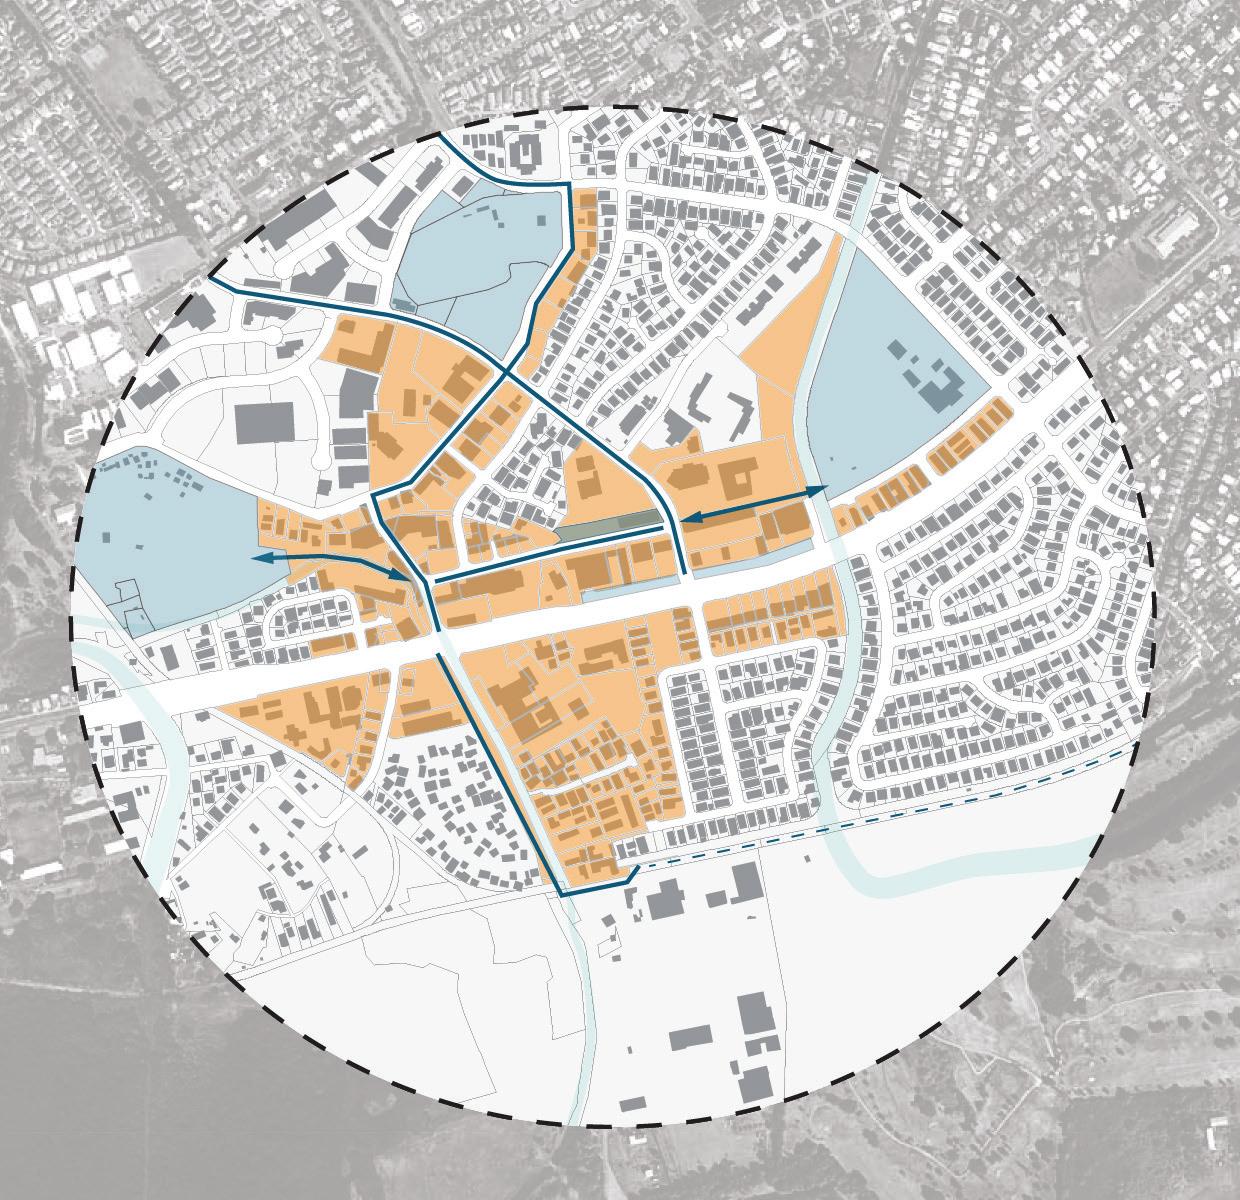
The orange zone at the center of the study area highlights the proposed TOD special district boundary within which, “a general land use scheme must be created that provides for a deliberate, inclusive process to plan for TOD so that welldefined, meaningful, and appropriate regulatory and incentive programs can be adopted for each area around a transit station or type of station.”2 Parcels identified with red and yellow lines designate city-owned and state-owned parcels, respectively.
State and city owned parcels may be identified as first-priority areas in which to implement new vegetation strategies, especially those included in the TOD special district. Planters along streets may be identified as second-priority spaces. As increased plantings create more shade, cooler environments, and make public spaces more visually appealing, street trees may have a better chance of survival. Through tree planting programs and awareness, public perception of street trees may positively shift. Maintenance of street trees may be able to shift away from government-provided maintenance and toward private maintenance as property owners take responsibility for them.
Sources:
1.
Office of Planning. STA_05_Waipahu_TC(20150507KM), June 14, 2015.
State of Hawai
City and County of Honolulu. Transit-Oriented Development Zoning Strategy and Process, August 2017.
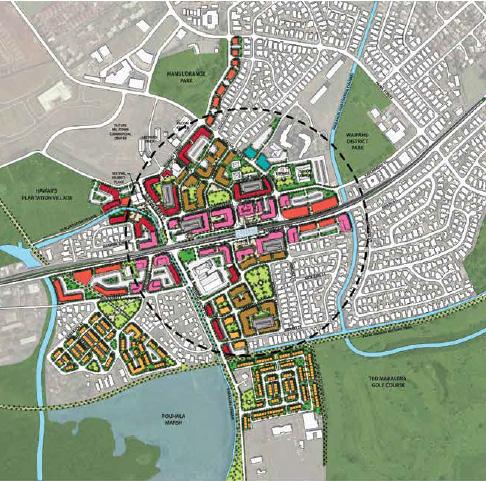
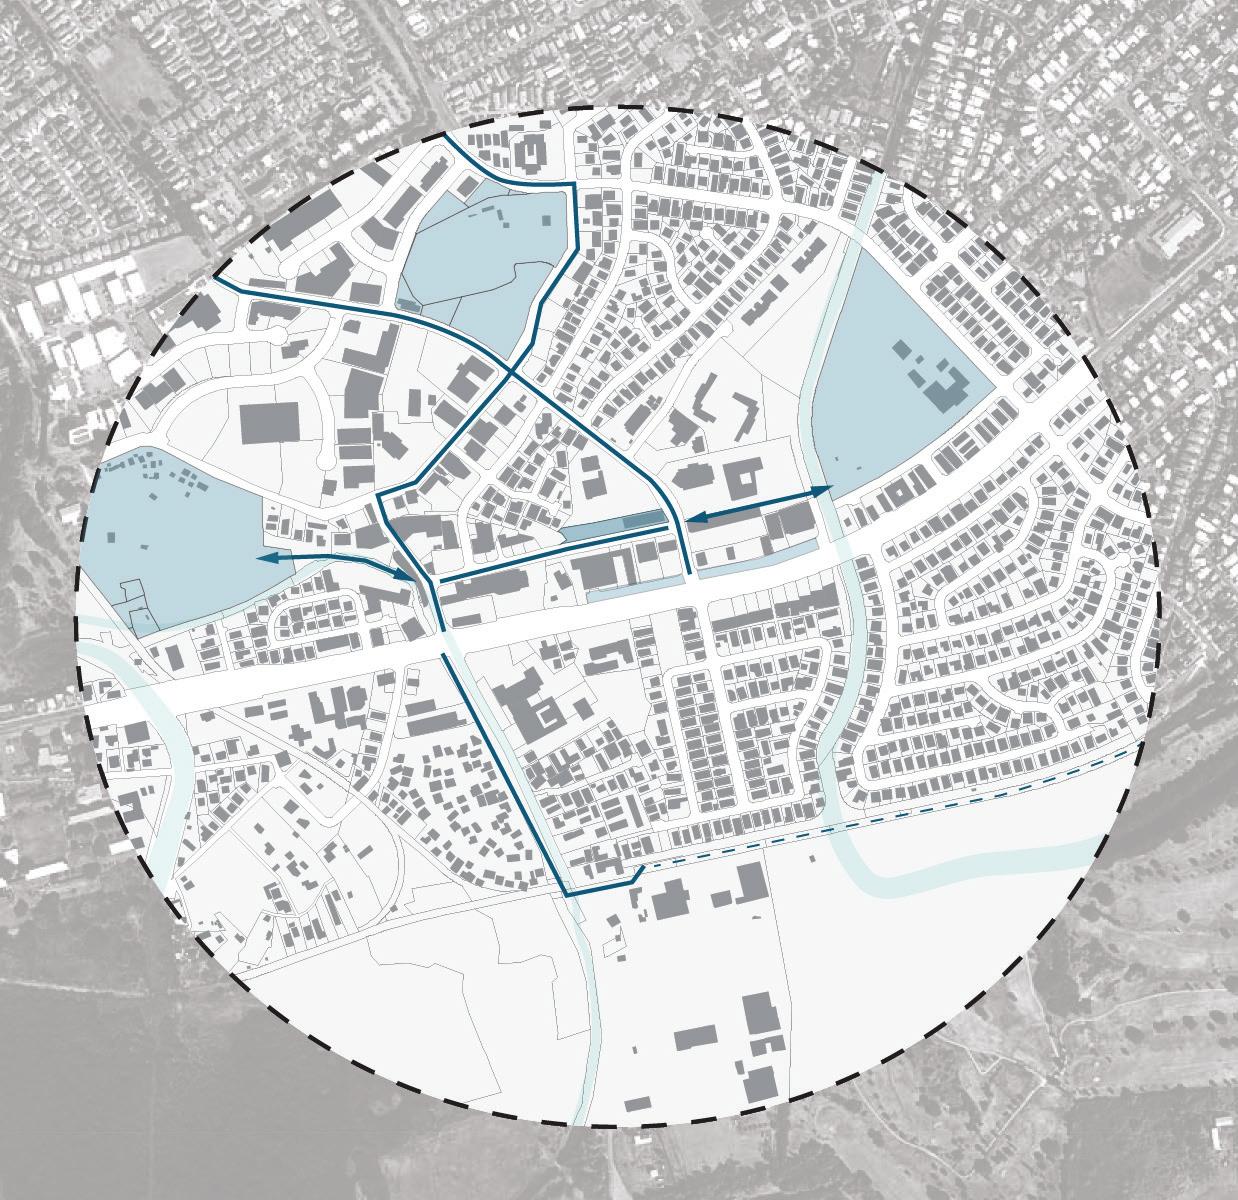
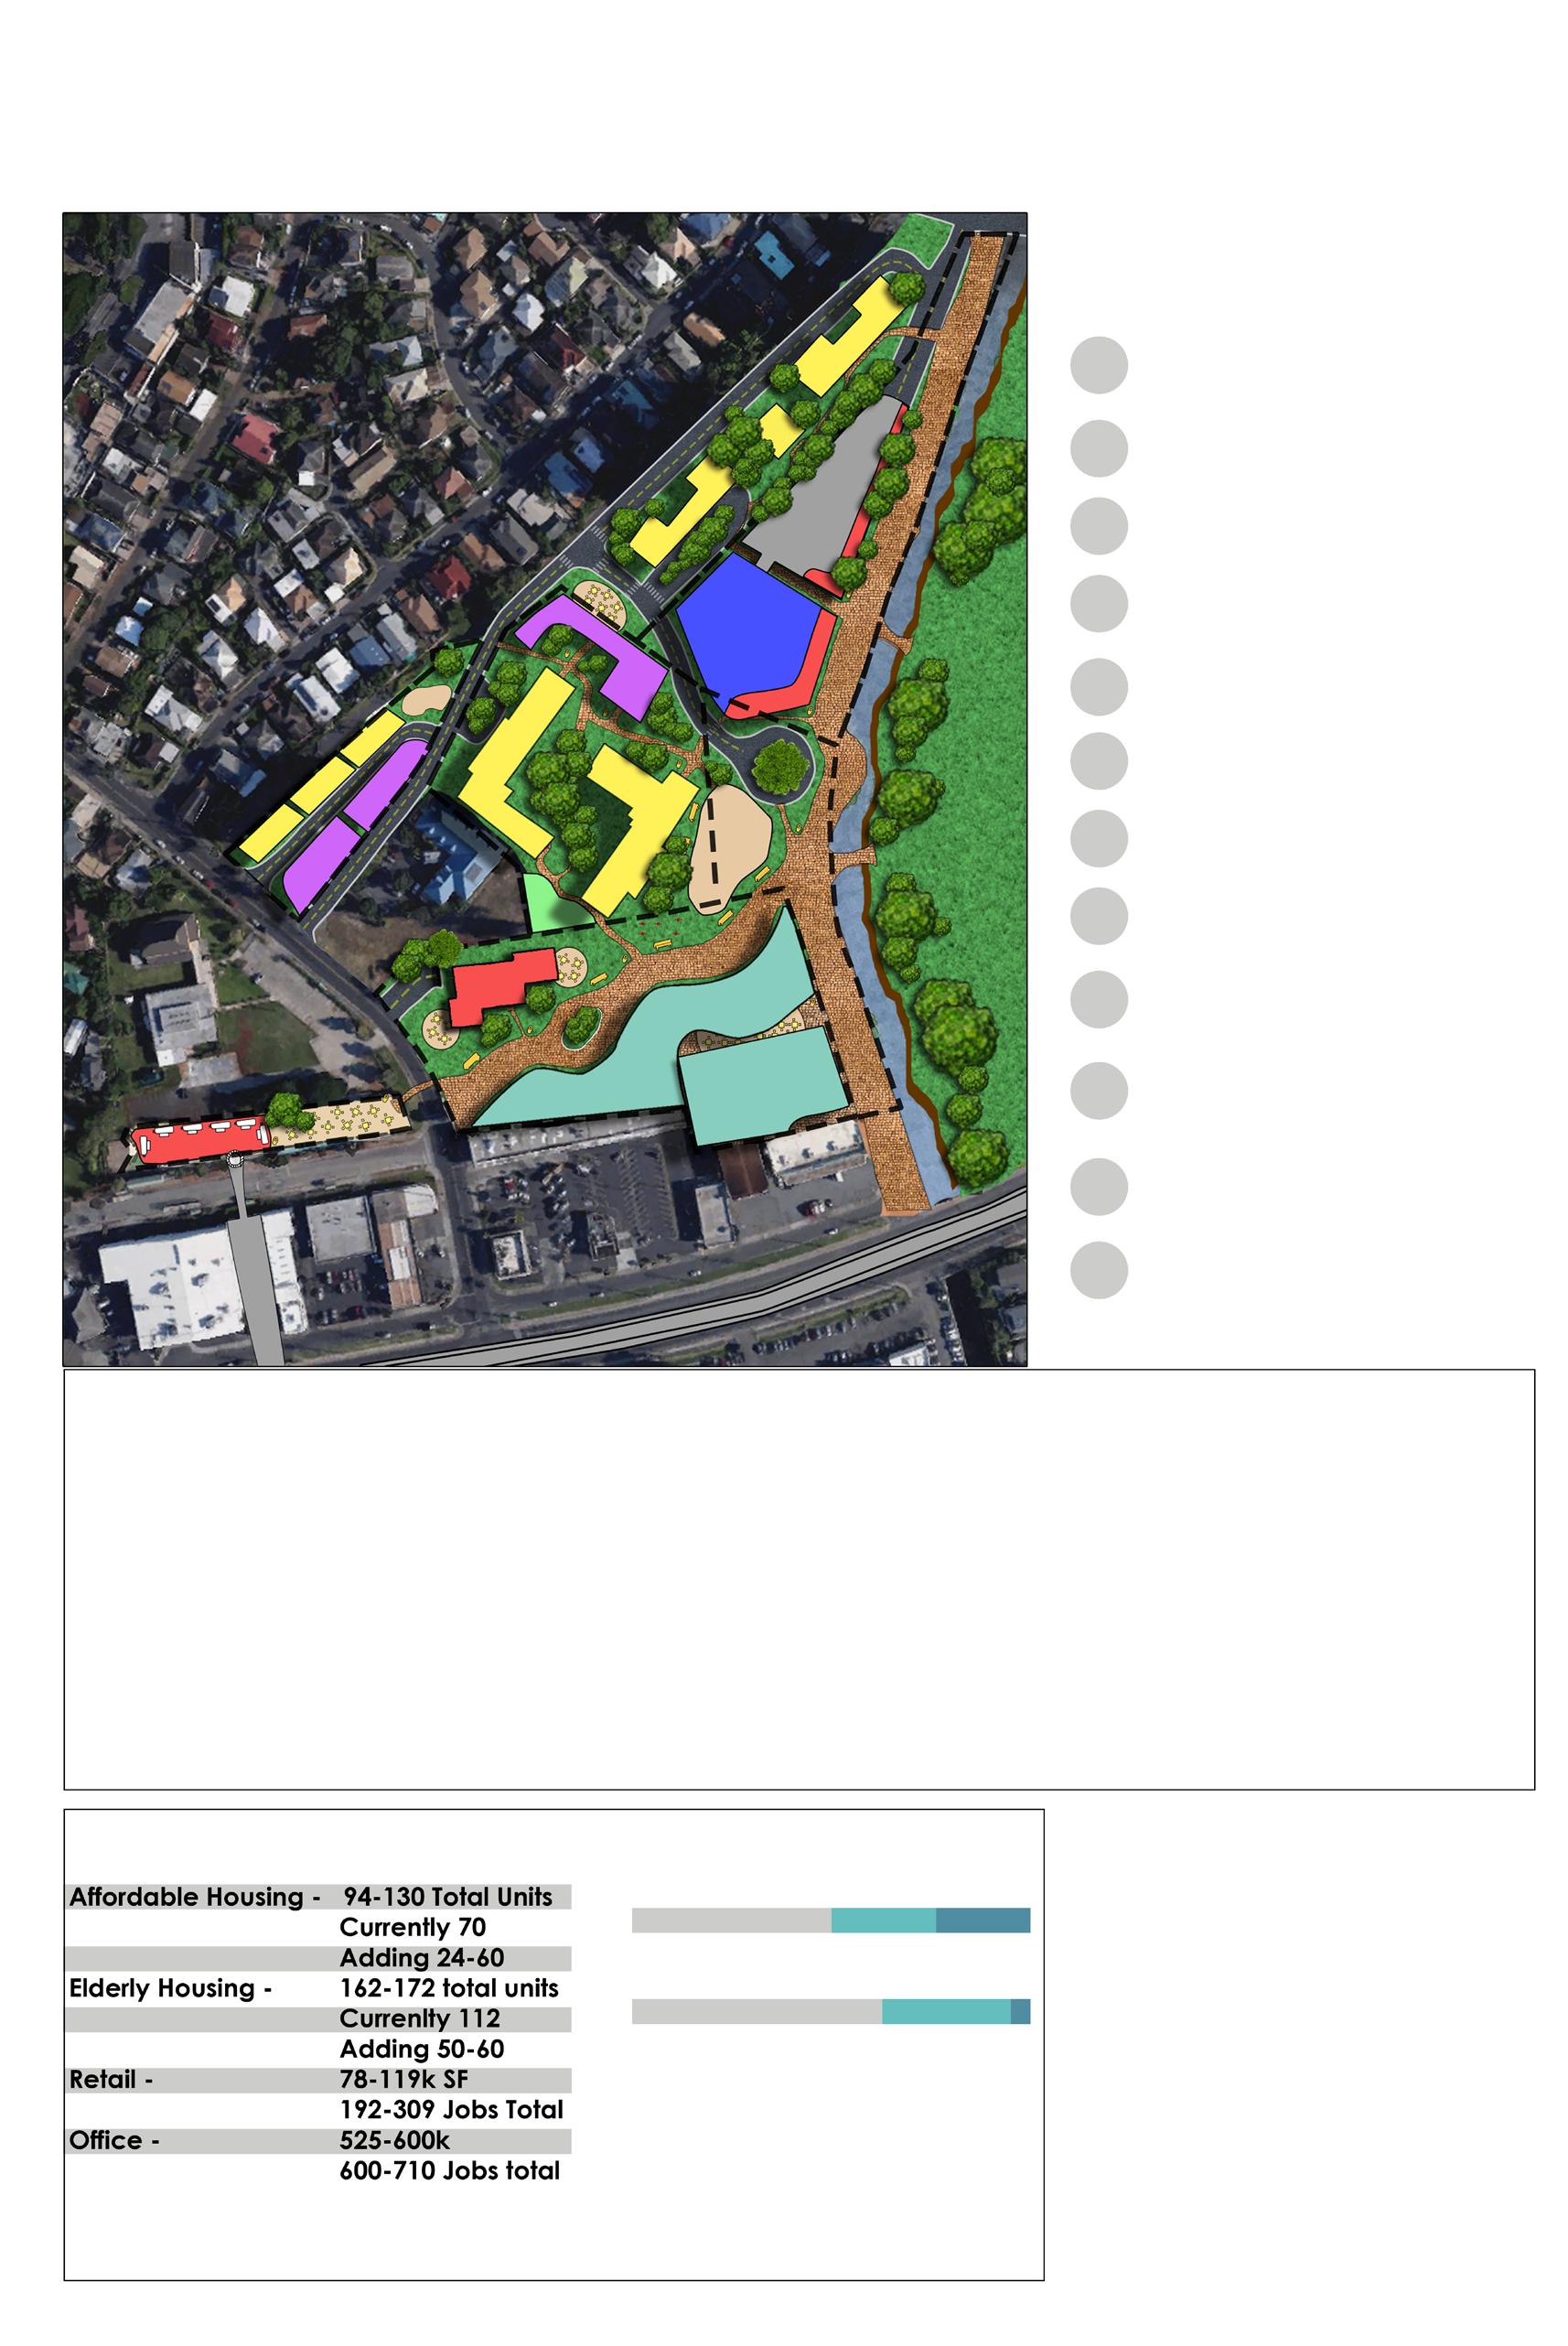
The Waipahu Neighborhood TOD Plan (to the right) depicts multiple program types for development in the TOD special district around Pouhala Station. The dashed circle represents a quarter-mile radius from Pouhala Station. The document states a few goals that are relevant to tree canopy goals:
Restore Kapakahi Stream as a green-walk walkway to connect Hawaiʻi Plantation Village, Pouhala Marsh, Pearl Harbor Historic Trail, and New Festival Marketplace
Encourage more pedestrian-oriented development along Waipahu Depot Street Integrate existing community facilities with the surrounding neighborhood through open spaces and streetscape improvements
The Waipahu Neighborhood TOD Plan (right) calls for “Higher density land uses...concentrated nearest to the station area to encourage and support walking and transit use, and to maximize access between housing and jobs.” When increasing density, outdoor spaces may provide alternative areas for gathering and socializing. A focus on developing pleasant outdoor spaces may also have an effect on improving public safety.
Sources:
Honolulu City & County TOD. Waipahu Neighborhood TOD Plan, 2016
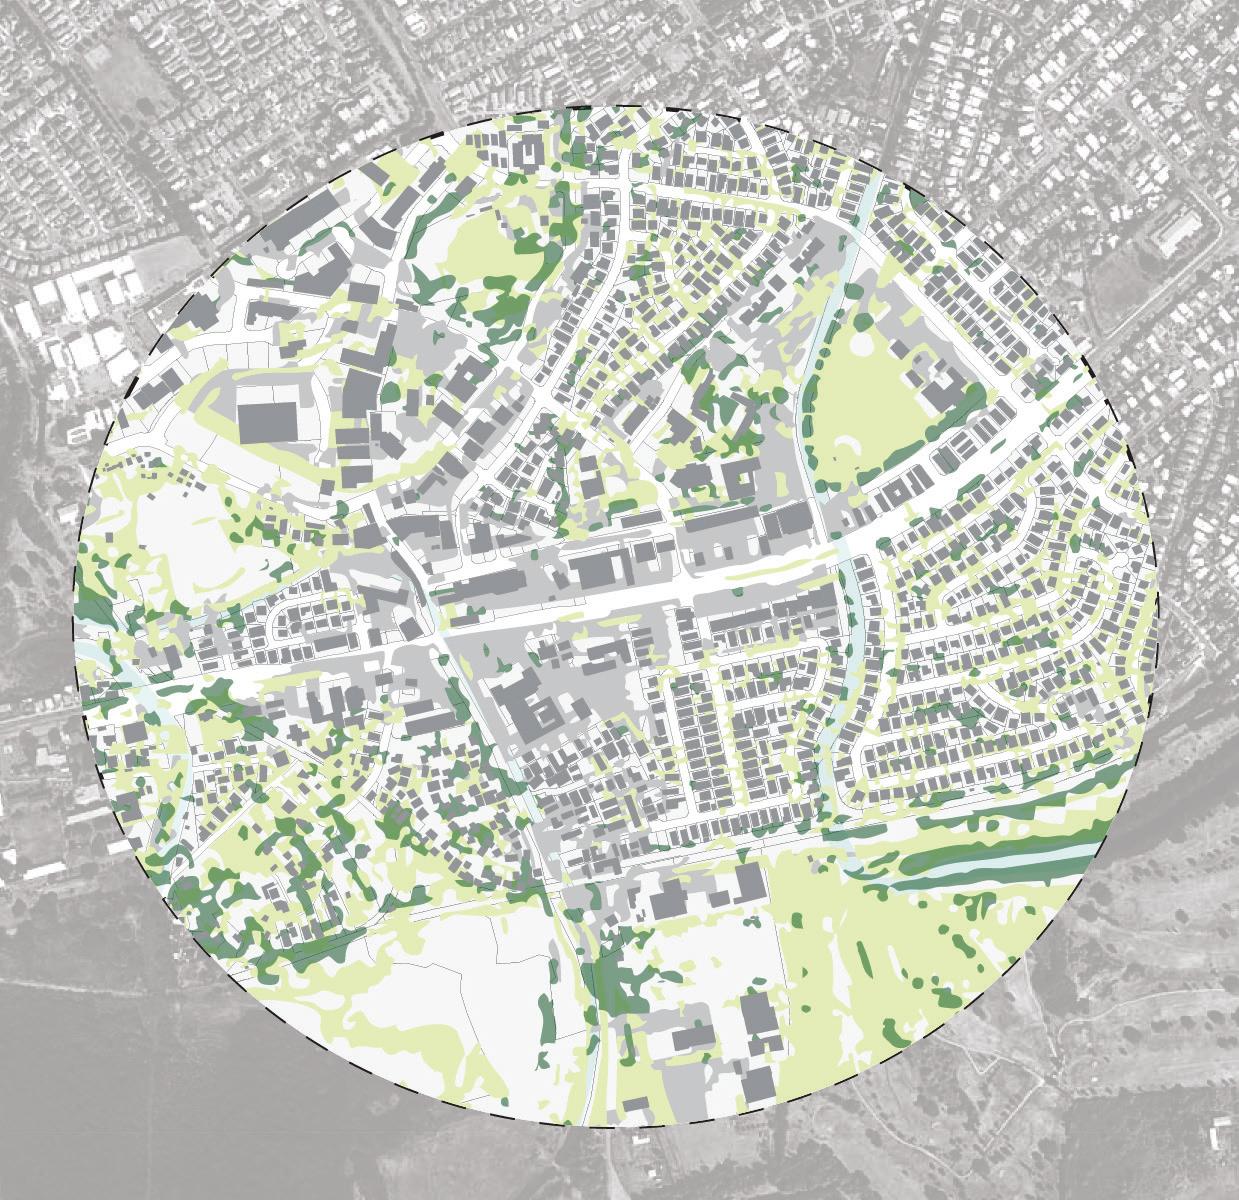
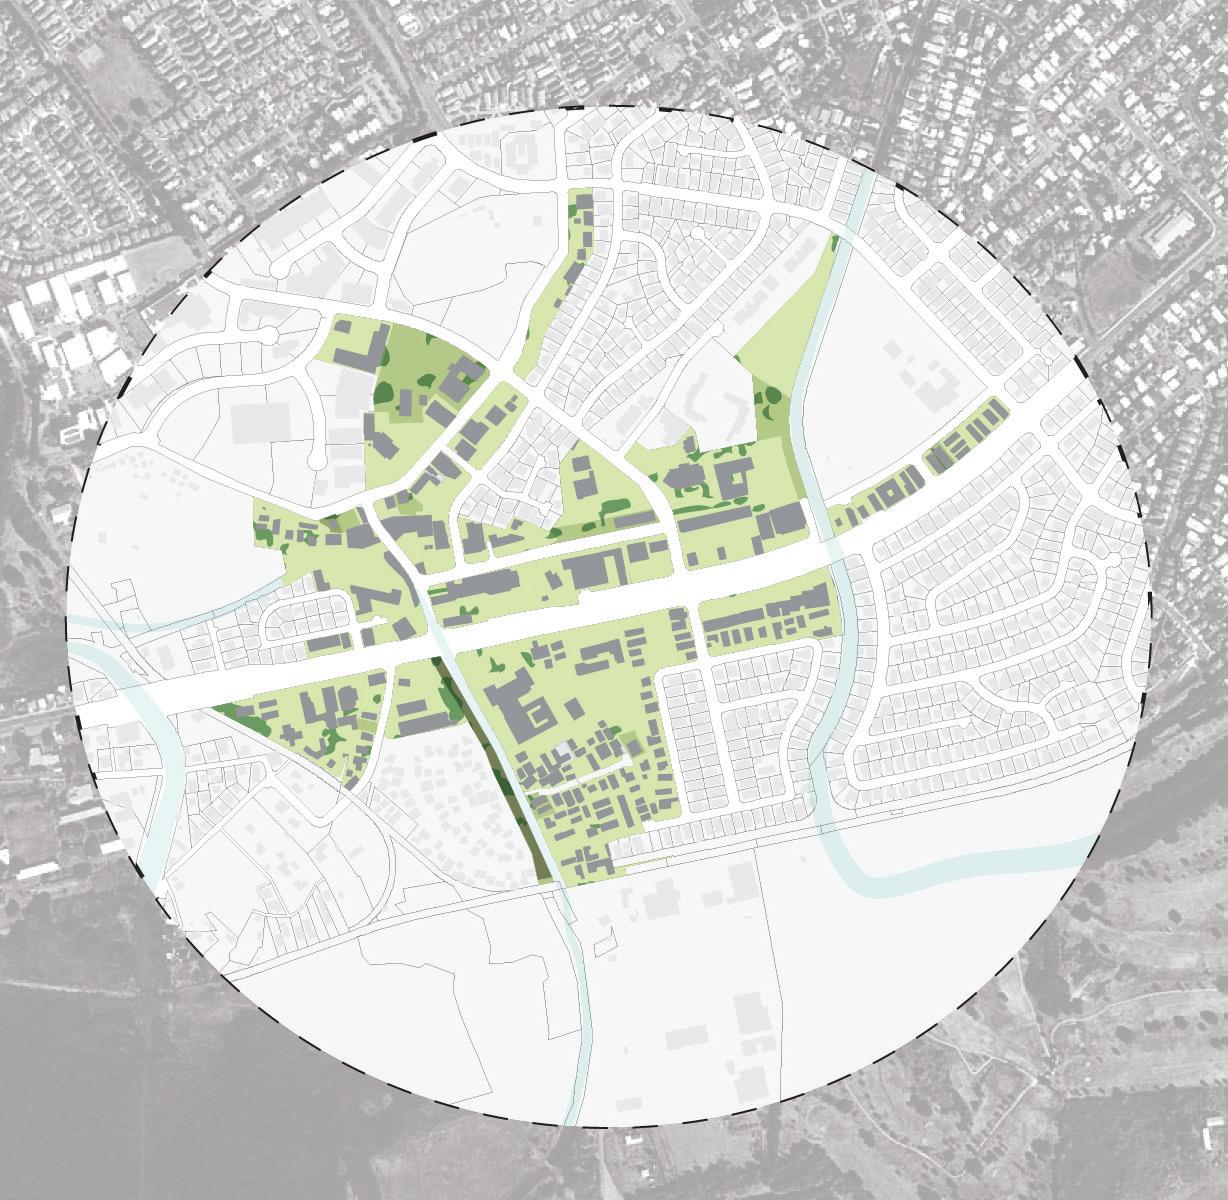
An analysis of Waipahu’s existing tree canopy is based on land cover data derived from high-resolution satellite imagery acquired from 2010, was digitally analyzed through Light Detection and Ranging (LiDAR). The imagery data is then calculated to determine where buildings, impervious surfaces and existing tree canopies exist. Each parcel is then measured for percentage of impermeable surfaces, existing tree canopy, and possible tree canopy. Data used in this report was published by Smart Trees Pacific and is available on their website: https://smarttreespacific.org/.
Based on the imagery data from the Smart Trees Pacific Urban Tree Canopy interactive map, analysis showed that the halfmile radius around Pouhala Station has approximately 9% tree canopy coverage. Coverage percentage was estimated by extracting the existing tree canopy layer (dark green) from the interactive map and dividing the total area of existing tree canopy to the area of the half mile radius.
Sources:
1. 1. Sean MacFaden & Jarlath O’Neil-Dunne University of Vermont Spatial Analysis Laboratory. A Report on Honolulu’s Existing and Possible Tree Canopy, 2010.
2. 2. Division of Forestry & Wildlife and its Kaulunani Program and Smart Trees Pacific. Tree Canopy Interactive Map. http://cchnl.maps.arcgis.com/ apps/OnePane/basicviewer/index.html?appid=9f94d7913115442b9e1e991 c9c392f76. Accessed June 18, 2018.
81%-100%
61%-80%
41%-60%
21%-40%
0%-20%
Within the Tree Canopy Interactive Map, existing tree canopy coverage is averaged individually per parcel both in terms of total area and as a percentage of the land area within each parcel.
Notable areas with high tree canopy coverage includes:
• Hans L’Orange Park (average 35.23%)
• Hawai
i Plantation Village (24.3%)
• Ted Makalena Golf Course (20.8%)
61%-80% 81%-100%
41%-60%
21%-40%
0%-20%
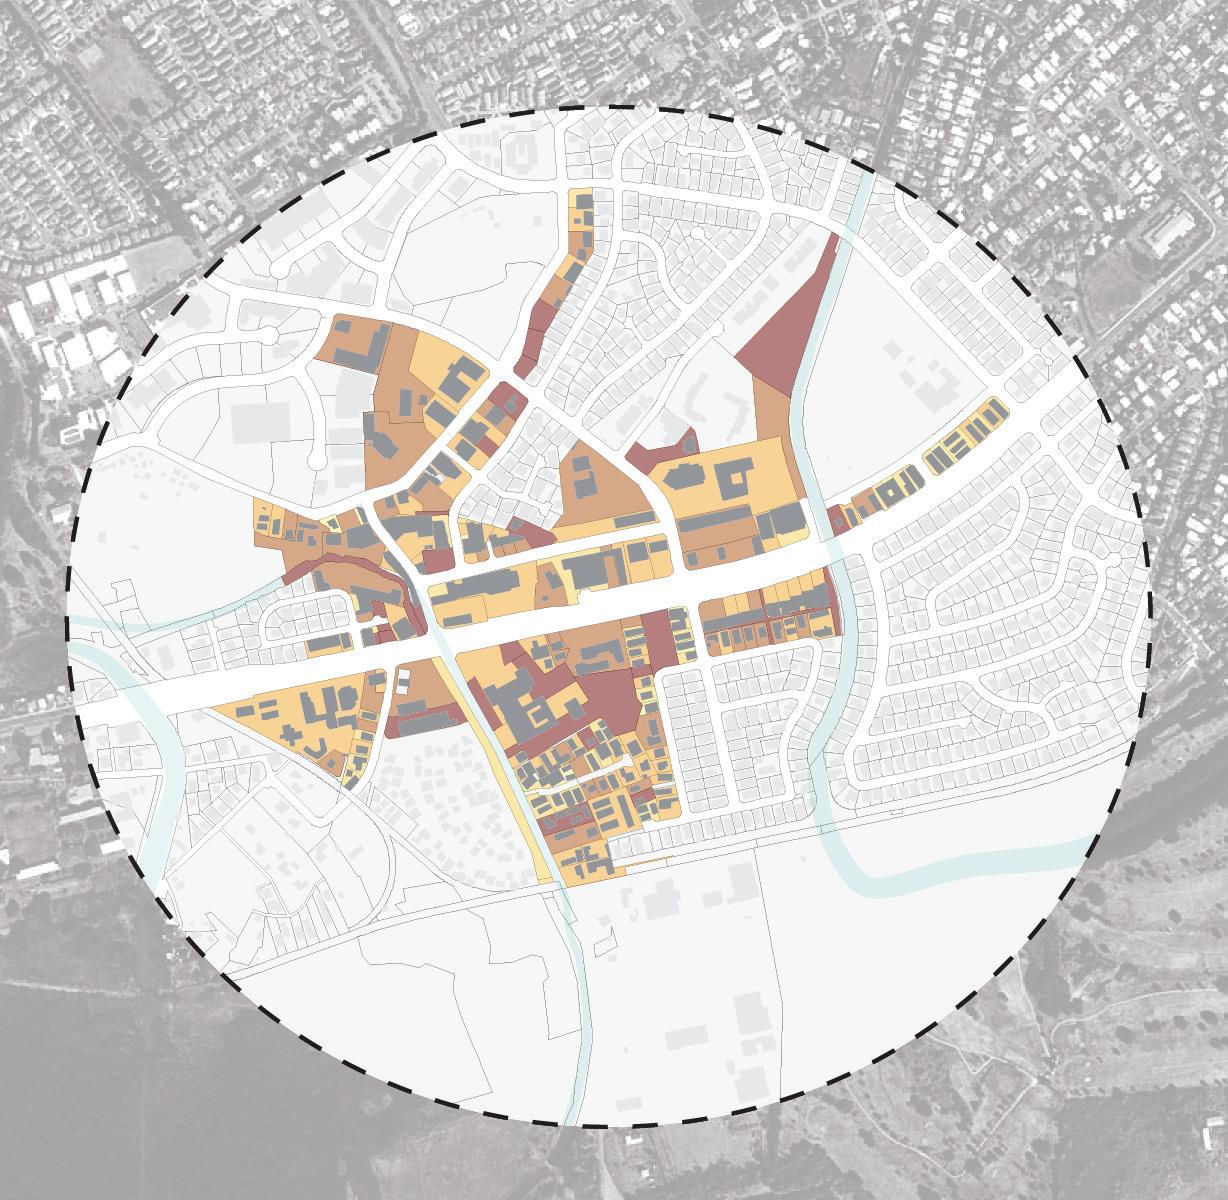
The Urban Tree Canopy interactive map not only finds the percentage of existing tree canopy coverage, but also identifies parcels by percentage of possible surface for tree canopy. (This generally includes vegetated and impervious surfaces and excludes areas with building footprints.)
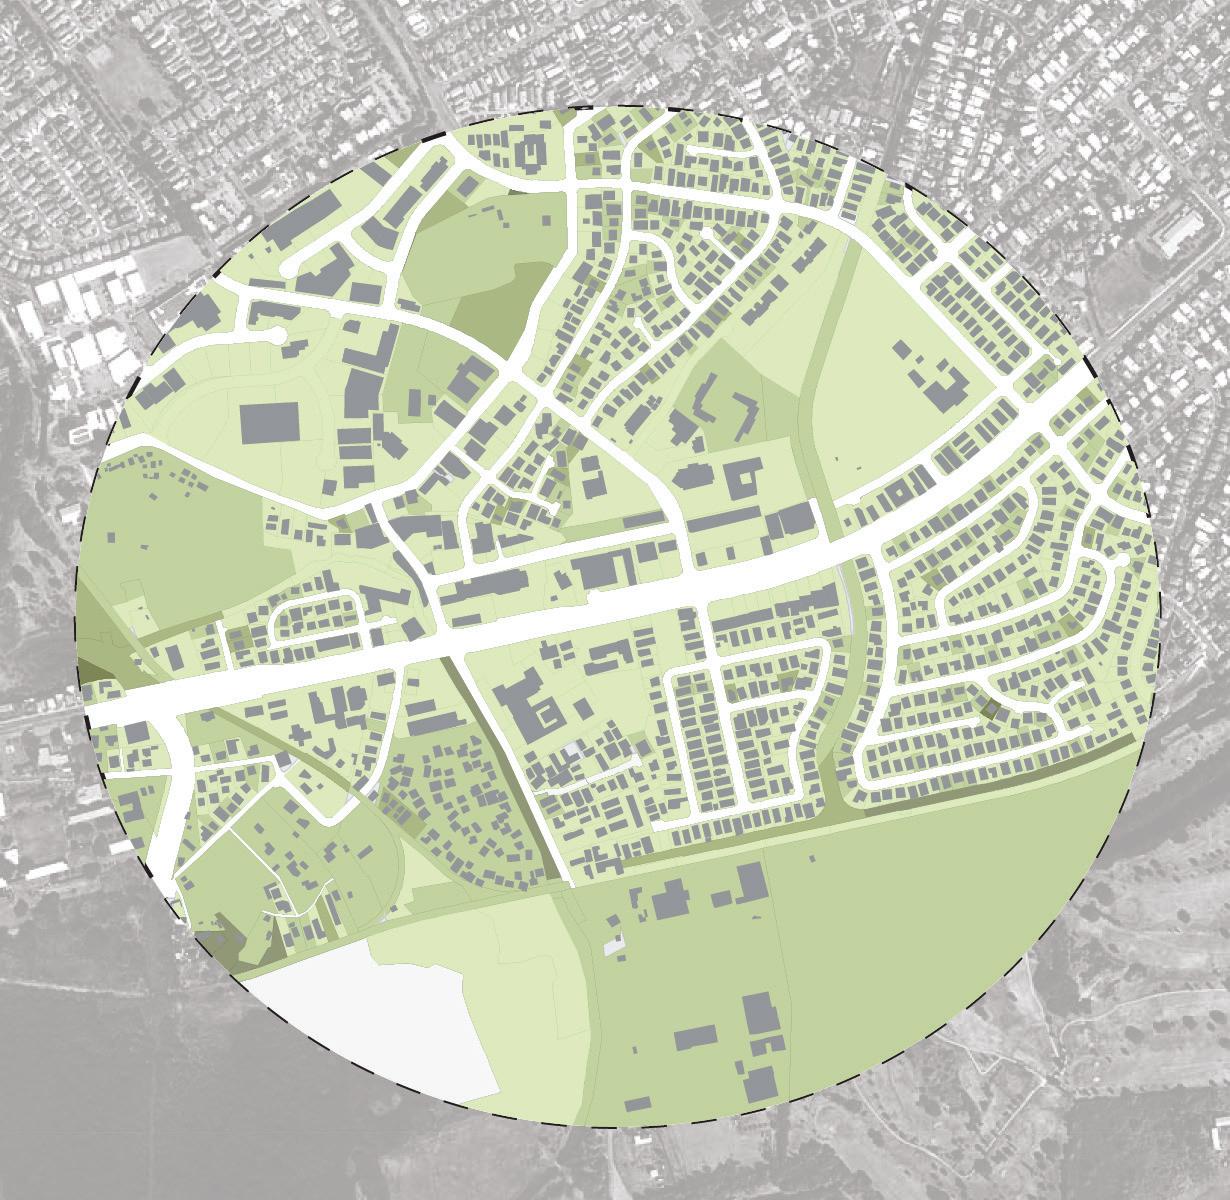
Areas with high tree canopy coverage potential includes:
Industrial lots south of Pouhala Station
Parking lots
Recreational Parks
Sources:
1. 1. Sean MacFaden & Jarlath O’Neil-Dunne University of Vermont Spatial Analysis Laboratory. A Report on Honolulu’s Existing and Possible Tree Canopy, 2010.
2. Division of Forestry & Wildlife and its Kaulunani Program and Smart Trees Pacific. Tree Canopy Interactive Map. http://cchnl.maps.arcgis.com/apps/OnePane/ basicviewer/index.html?appid=9f94d7913115442b9e1e991c9c392f76. Accessed June 18, 2018.
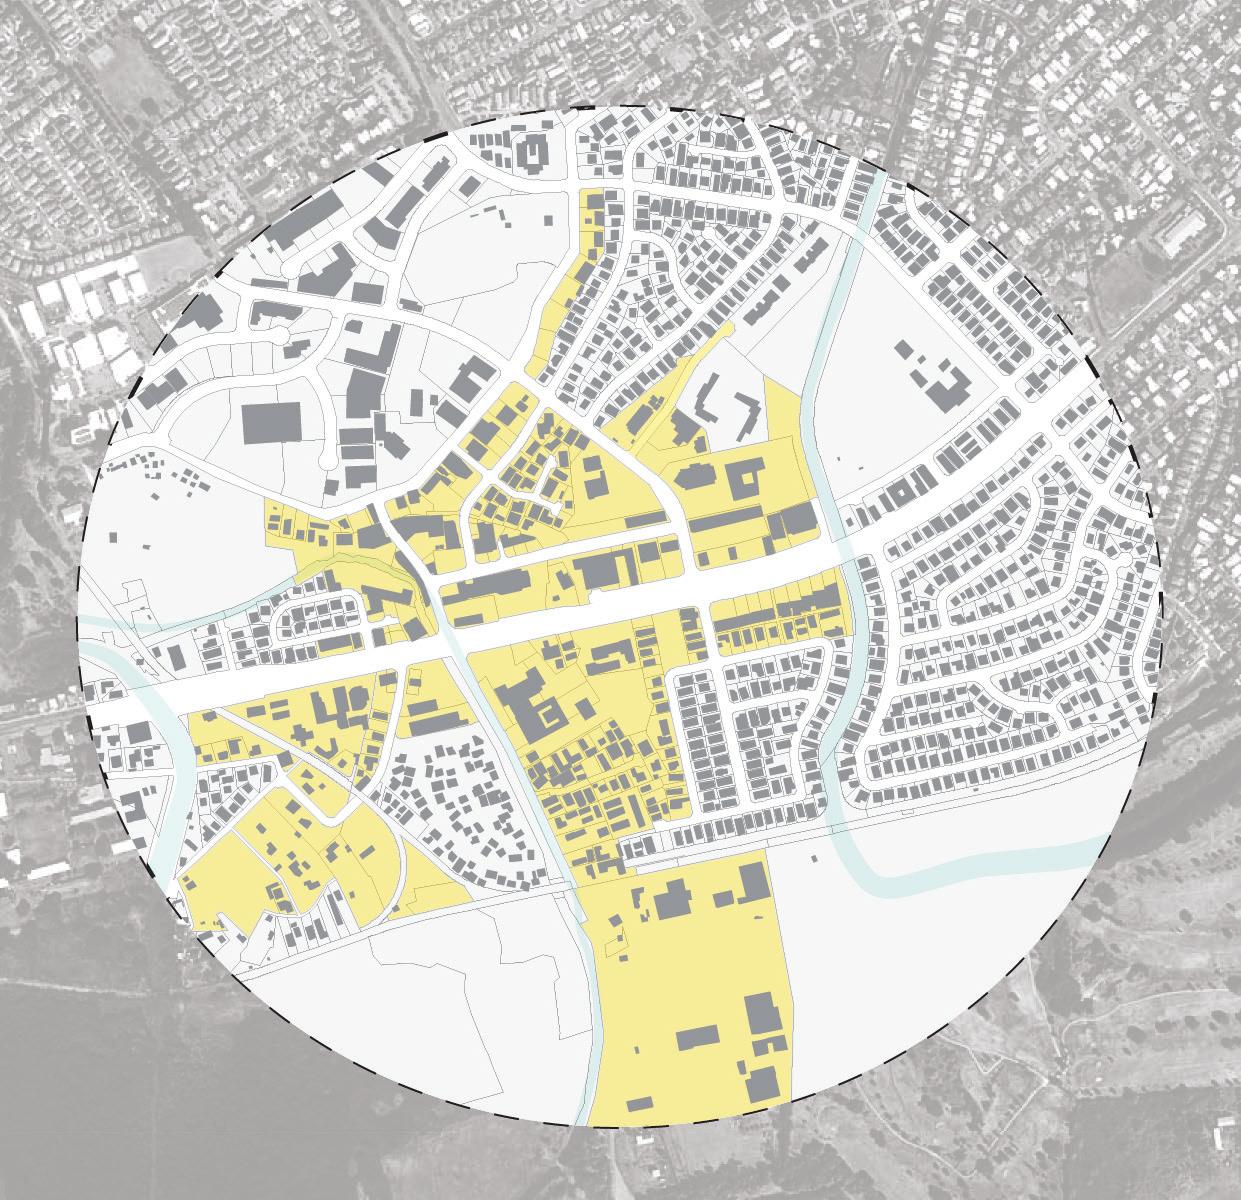
The Waipahu Town Action Plan identifies goals from community discussions on challenges, issues, needs, and opportunities. The goals stated in the report are listed below with items closely related to the tree canopy project in bold. The goals highlighted in bold are also illustrated on the study area map.
1. Implement a Network of Connected Bicycle Facilities
2. Upgrade Waipahu Transit Center
3. Redesign Moloalo Street
4. Upgrade Street Lighting
5. Connect Hawaiʻi’s Plantation Village to Waipahu Town Core
6. Implement Place-making Strategies
7. Connect Waipahu District Park to Waipahu Town Core
8. Develop a Master Plan for Hans L’Orange Park
9. Address Area-wide Flooding
10. Establish Area-wide Way-finding
11. Develop Pouhala Marsh Educational Signage
Sources:
1. City and County of Honolulu. Waipahu Town Action Plan, September 2017.
Graduate students at the University of Hawai
i at Manoa Department of Urban and Regional Planning developed TOD plans within parcels along Wailani Stream near the Waipahu district park and proposed modifications to the environment along Kapakahi and Wailani streams.
PLAN 620, taught by Assistant Professor Dr. Daniele Spirandelli addressed flood adaptation along Kapakahi Stream by implementing green infrastructure strategies. Several teams worked on the resulting projects titled: Flood Impact on Vulnerable Communities, Kapakahi Stream: From Burden to Asset, Mitigating Chronic Inundation and Climate Change Induced Sea Level Rise Through Targeted Ecological Restoration in the Pouhala Marsh System in Waipahu, and Flood Adaptation.
PLAN 678, taught by Associate Professor Priyam Das focused interventions along Wailani Stream, proposing 6 State parcel lands into 3 different concept proposals: Wai, Flow, and Health And Well Being. PLAN678 students worked to remove the stigma around public services by creating positive spaces for all ages and backgrounds to enjoy. Increasing vegetation and landscaping around the Waipahu town center increases intrinsic values to those who live and work in Waipahu.
Page intentionally left blank.
CONNECTIVITY OF THE PROPOSED TOD ZONE
CORRIDOR - LINKING WAIPAHU’S GREEN SPACES
CITIZEN FORESTER SITE INVENTORY
canopy
improved
transport between destinations
the TOD Action Plan
Waipahu.
the TOD boundary
can address the need for more alternative modes of transportation. The redevelopment of the TOD special district can provide opportunities to reconnect mauka and makai sections of Waipahu.
41%-60% Existing Tree Canopy Parcel Coverage
21%-40% Existing Tree Canopy Parcel Coverage
0%-20% Existing Tree Canopy Parcel Coverage
Building Footprints
Existing Tree Canopy
The overlaying of the TOD boundary, existing tree canopy, and existing tree canopy by parcel map (left) creates a map that identifies priority target areas for canopy generation. The lightest green parcels have the lowest existing tree canopy. Alternatively, the overlay of the TOD boundary and possible tree canopy by parcel map (right) highlights target areas of highest potential based on existing surface conditions. For example, the open parking lot located west of Waipahu District Park is highlighted in dark red. This parcel is noted to have a high possible tree canopy parcel coverage potential. Areas with high coverage potential typically do not have buildings within its parcel that may limit vegetation area. They are typically existing
Sean MacFaden & Jarlath O’Neil-Dunne University of Vermont Spatial Analysis Laboratory. A Report on Honolulu’s Existing and Possible Tree Canopy, 2010.
2. Division of Forestry & Wildlife and its Kaulunani Program and Smart Trees Pacific. Tree Canopy Interactive Map. http://cchnl.maps.arcgis.com/ apps/OnePane/basicviewer/index.html?appid=9f94d7913115442b9e1e99
Accessed June 18, 2018.
81%-100% Possible Tree Canopy Parcel Coverage
61%-80% Possible Tree Canopy Parcel Coverage
41%-60% Possible Tree Canopy Parcel Coverage
vegetated surfaces, or are impervious surfaces such as parking lots. Dark red parcels should be considered high priority when implementing the 35 by 2035 plan.
• Existing tree canopy coverage within the quarter-mile radius from Pouhala Station is poor
• Public land parcels average less than 20% tree canopy coverage.
• Public lands provide great opportunities to provide tree canopy coverage
• Large parcels such as Hawaiʻi Plantation Village, Hans L’Orange park, and Waipahu District park are beyond the quarter-mile radius but can become urban-forest destination points.
• Streets within the quarter-mile radius can become desirable and walkable connecting corridors.
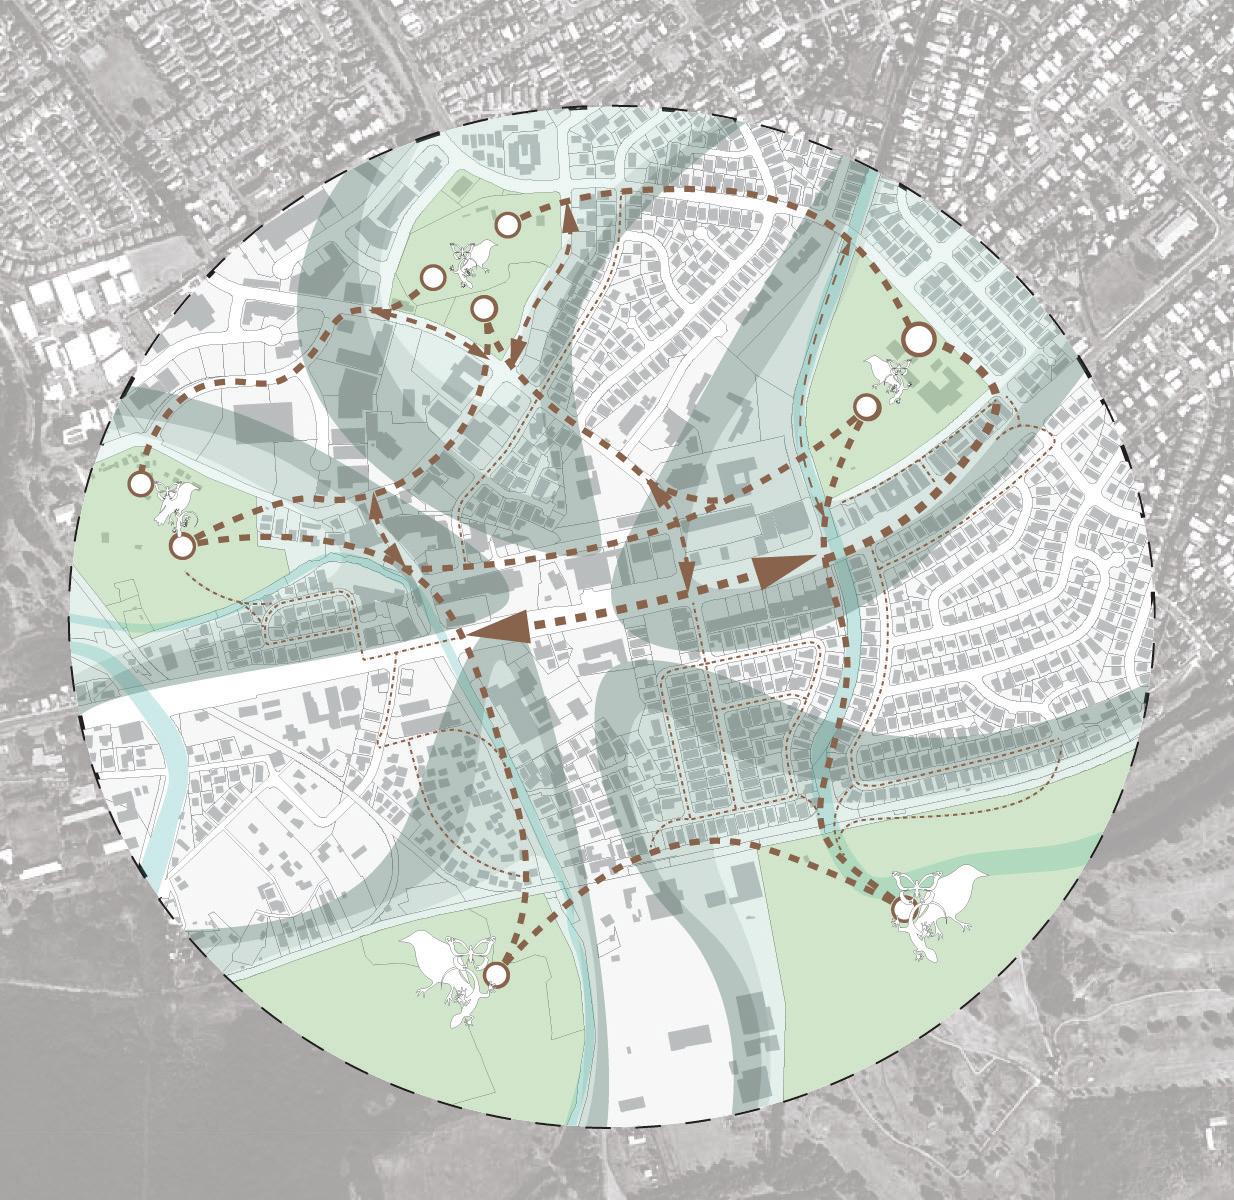
The heavily urbanized habitat of Waipahu town’s center limits the capability of varied flora and fauna to thrive. Encouraging the development of an urban forest encourages biodiversity for greater interactions between species by providing an expanded habitat.
The large and vegetated parcels of Hawai
i Plantation Village, Hans L’Orange park, Waipahu district park, Pouhala marsh, and Ted Makalena Golf Course have high potential to house larger populations of trees and wildlife. Proposing vegetated corridors which would connect these large parcels, would not only encourage movement of people, but also birds, insects, and other fauna. An understory that lies beneath the canopy of trees may also provide unique habitats for other vegetation.
Corridors of street trees can become highways for Waipahu’s wildlife. The street tree canopy typologies help define travel patterns for species to migrate and wayfind to suitable environments.
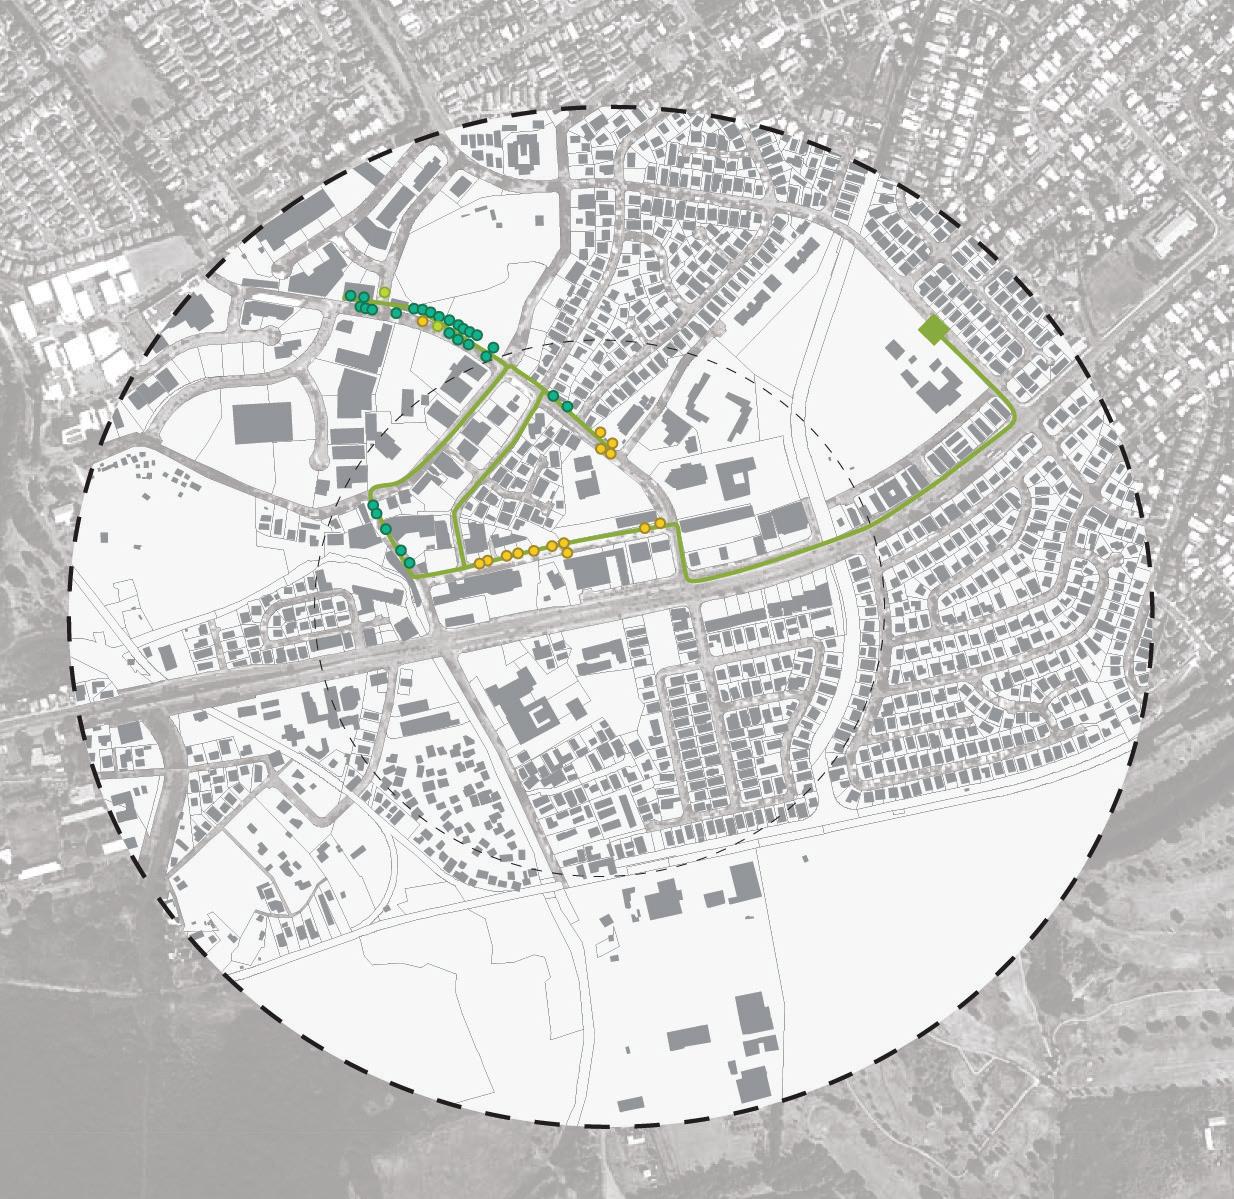
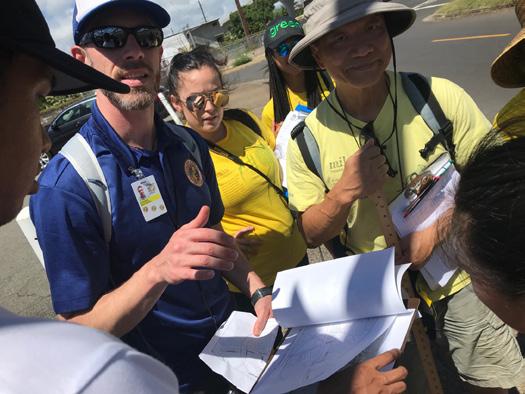
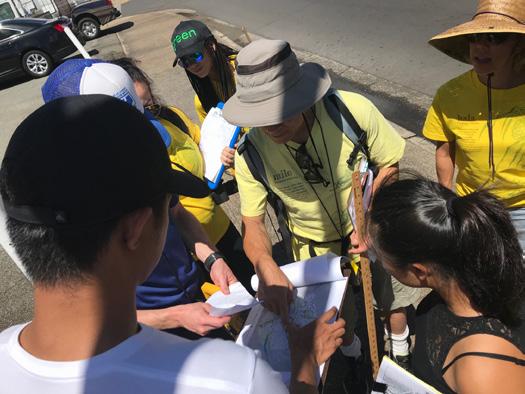
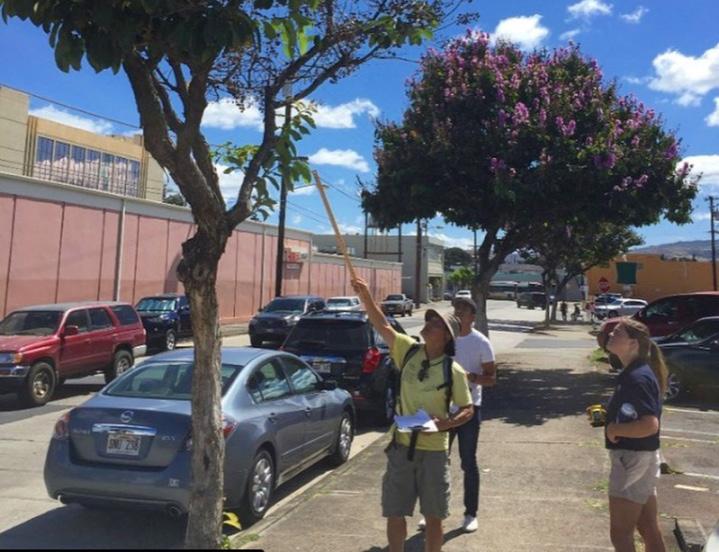
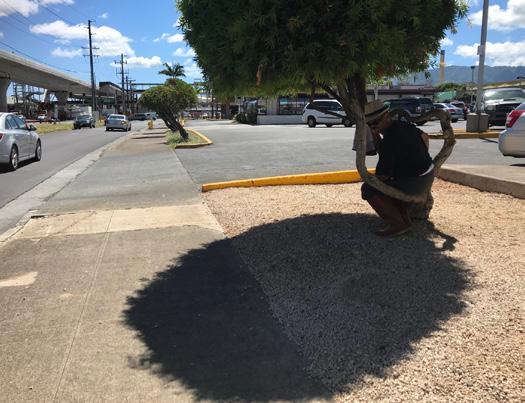
A site visit on July 21, 2018 brought together UHCDC, Kaulunani Citizen Forester Program, Smart Trees Pacific, and the City and County of Honolulu’s Office of Climate Change, Sustainability and Resiliency groups to perform initial documentation on trees in Waipahu. The visit began at Waipahu District park, along Hikimoe street and up toward Hans L’Orange park. The site visit stressed the importance of trees along corridors for human comfort as it was a hot, clear-sky day with only a light breeze. A row of shower trees along Hans L’Orange park made that portion of the walk significantly cooler in comparison to more barren streets along Farrington highway.
Diversity of tree species in Waipahu is statistically limited as only four species were identified during the visit: rainbow shower, golden shower, giant crepe-myrtle, and tulipwood, none of which are native Hawaiian species.
The health of the individual street trees seemed to vary. For example, rainbow shower trees along Mokuola Street, north of the Waipahu Street intersection, were thriving compared to the same species located south of Waipahu street.
The interactive map of identified city-owned trees can be found at https://pg-cloud.com/Oahu/
Source:
1. Smart Trees Pacific. Citizen Forester
https://pg-cloud.com/
Page intentionally left blank.
35% BY 2035 PHASING ENVISIONING WAIPAHU: 35% BY 2035 35% BY 2035 TREE CANOPY INVENTORY - STATE PARCELS TYPOLOGY CHARACTERISTICS
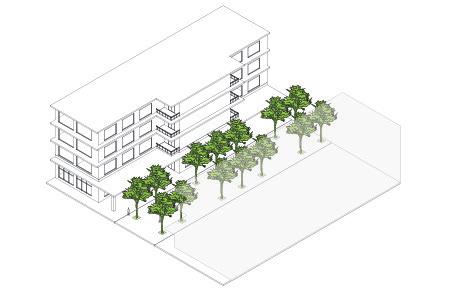
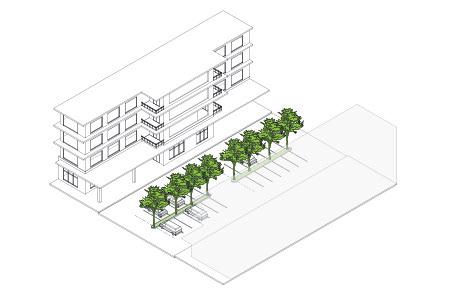
Tree canopy improvements can be achieved in phases. Breaking into several phases allows for target parcels to become experiemental trials to test for elements such as changes in pedestrian traffic, changes in air temperature, and survivability of tree species. Phases in this proposal prioritize pedestrian connectivity and encourage the use of public transportation. The phases are described below:
The state parcels near Waipahu District Park become a initial testing site for tree canopy improvements. Some parcels are currently vegetated while others will incorporate trees over largely paved areas. Connectivity is established through improvements to the street environment through the bus transit area on Hikimoe street, to Pouhala Station via Moloalo Street, and to Waipahu District Park via proposed pedestrian bridge.
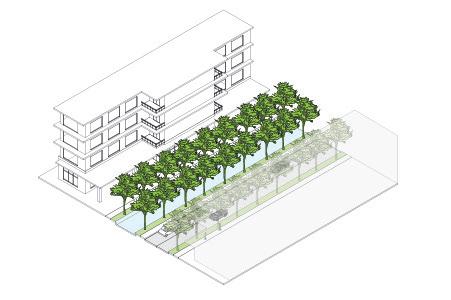
Parks and their connective streets provide further connectivity for the community. Hawaii Plantation Village, Hans L’Orange Park and Waipahu District Park are all within a 10 minute walk from Pouhala Station. Improvements along these streets also begin to serve residential neighborhoods.
From the viewpoint of a passenger on the elevated rail, increased tree canopy density may serve as an indicator of arrival at a main destination. The doubly lined corridor of Farrington Highway and the rail guideway may resemble Kapiolani Boulevard.
Waipahu Depot Road and Awalau Street improvements will establish pedestrian access to makai residents and businesses.
Residential street improvements can help increase tree canopy and pedestrian accessibility. Space will need to be allocated for sidewalks with planters in neighborhoods where they do not currently exist.
The Pearl Harbor Bike Path, Pouhala Marsh, and Ted Makalena Golf Course are large, non-paved areas that hold high potential for increasing tree canopy coverage. Plantings within Pouhala Marsh may also benefit from additional planning which would specify vegetation species and their locations within the wildlife sanctuary.
Pearl Harbor Bike Path is an approximately 5.3 mile long bike
trail that begins at Richardson Field near Aloha Stadium in Aiea and ends at Waipahu Depot Road near Pouhala Marsh. As TOD expands upon Waipahu’s makai community, an improved canopy over the bike path may render the area a valuable community asset.
TOTAL AREA (SF) 9% COVERAGE AREA (SF) 35% COVERAGE AREA (SF)
Simulation Coverage (SF) Simulation Coverage (%)
TOTALS 13,939,200 1,254,528 4,878,720 5,094,278.5 36.55%
Sml Med Lrg TOTAL
TOTALS 3,888.40 1,828.92 195.79 5,913.11
An interactive calculations table was developed to model various tree canopy coverage goals for Waipahu. Using the 1/2 mile constraint, 35% coverage was input as the overall goal resulting in a total of 4,878,720 square feet of tree canopy. Using the interactive calculations table, data was entered for two typologies: 1) linear typologies which include all street types, and 2) area typologies which included TOD special district, state and city parcels (excluding those within TOD special district), and public parks. The simulation data is shown on the following page.
The simulation was able to calculate a total estimated tree count of 5,913 trees of varying sizes. Small, medium, and large trees were given the following values:
Small 8 ft Ohia tree
Medium 15 ft Shower tree
Large 40 ft Monkeypod tree
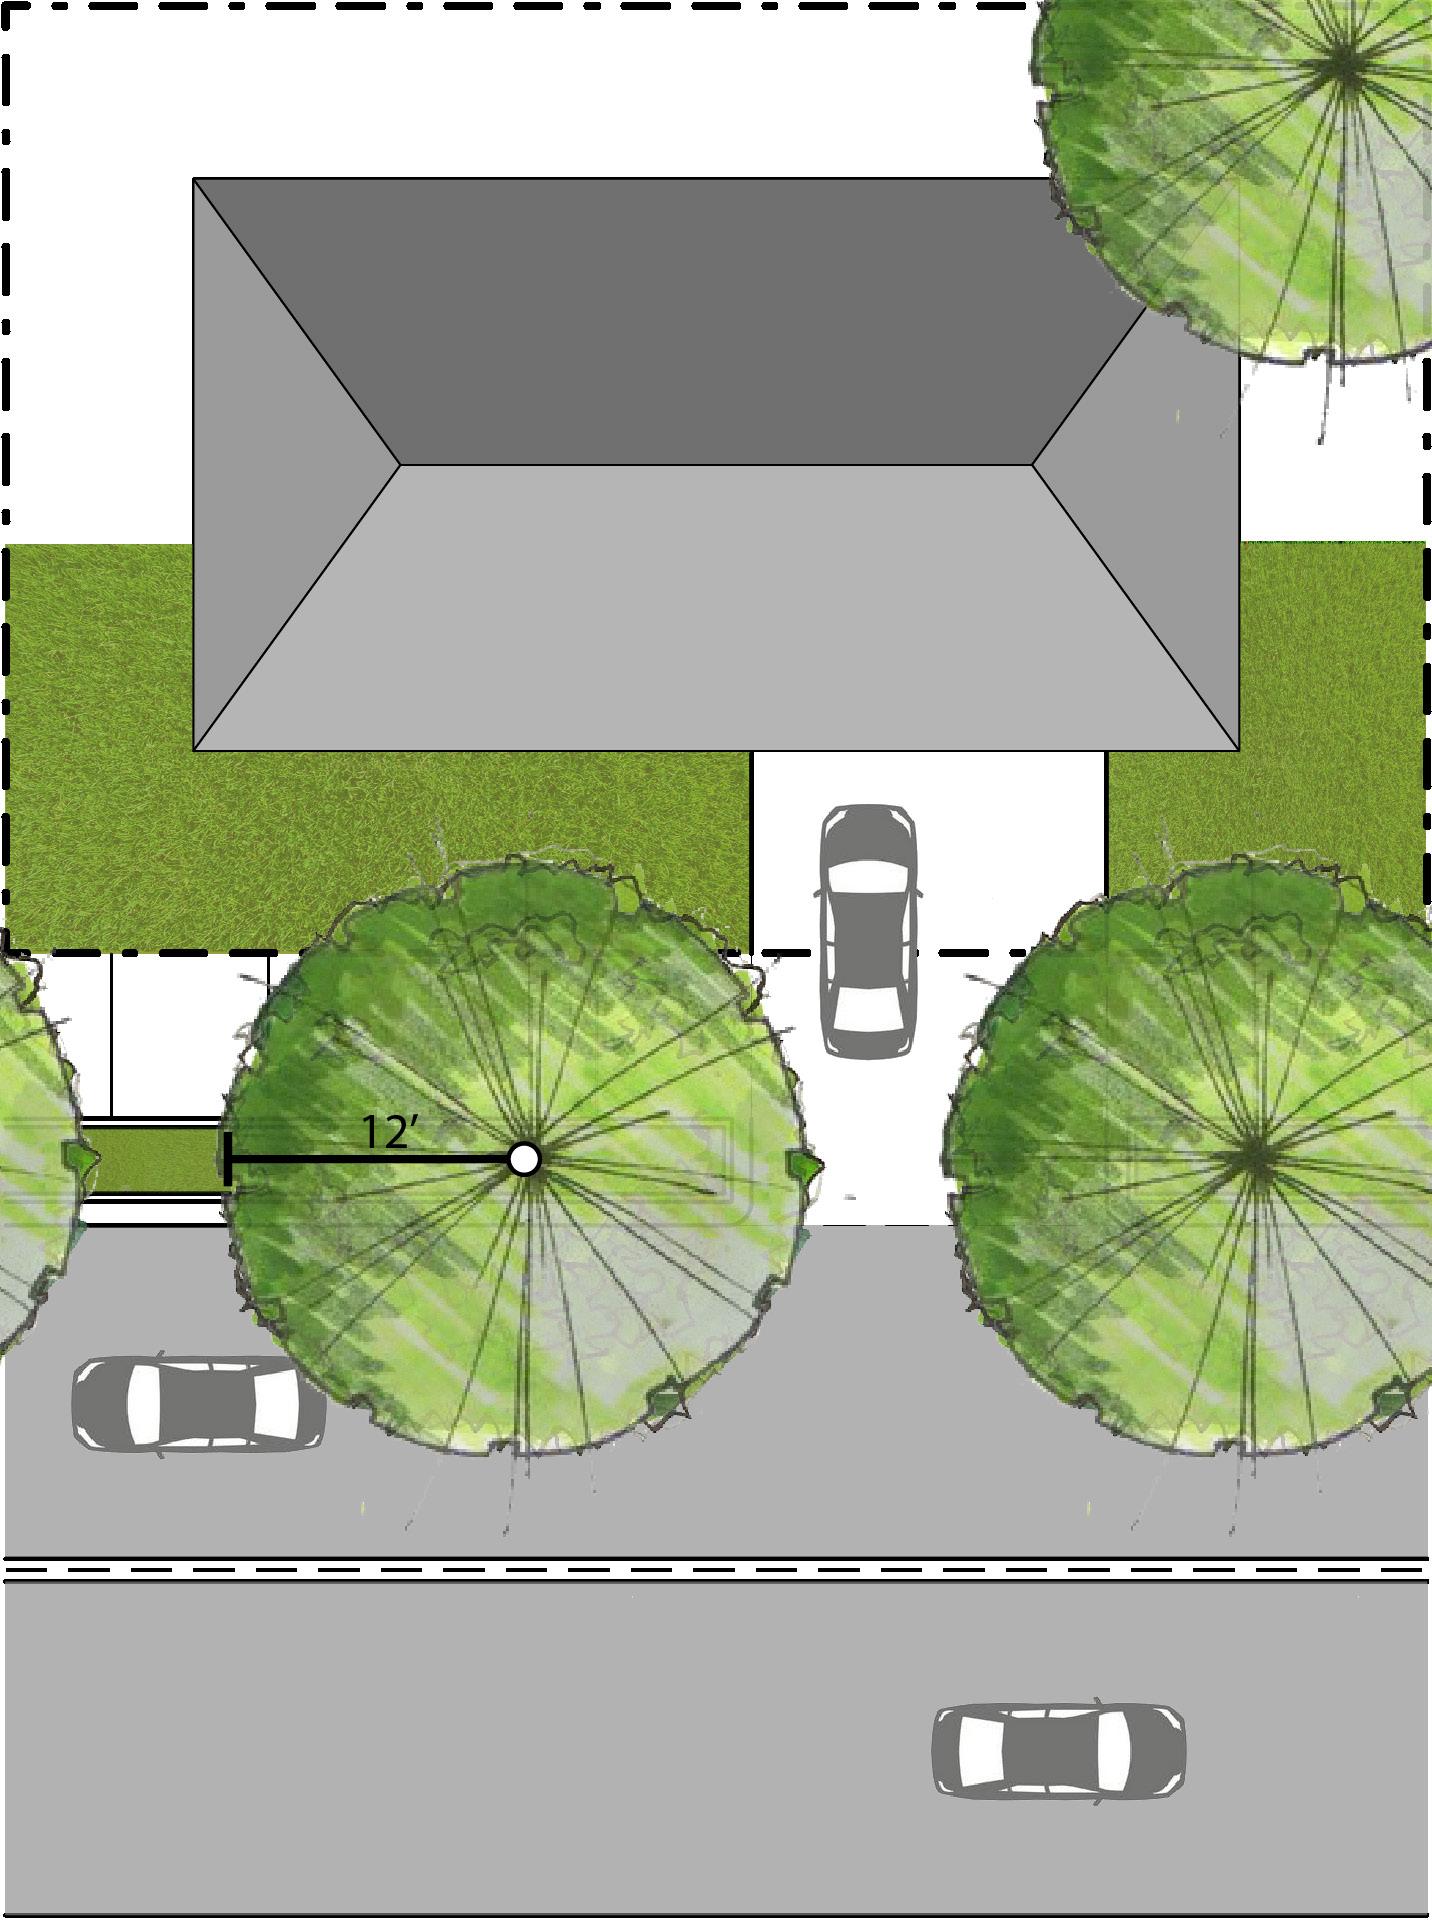
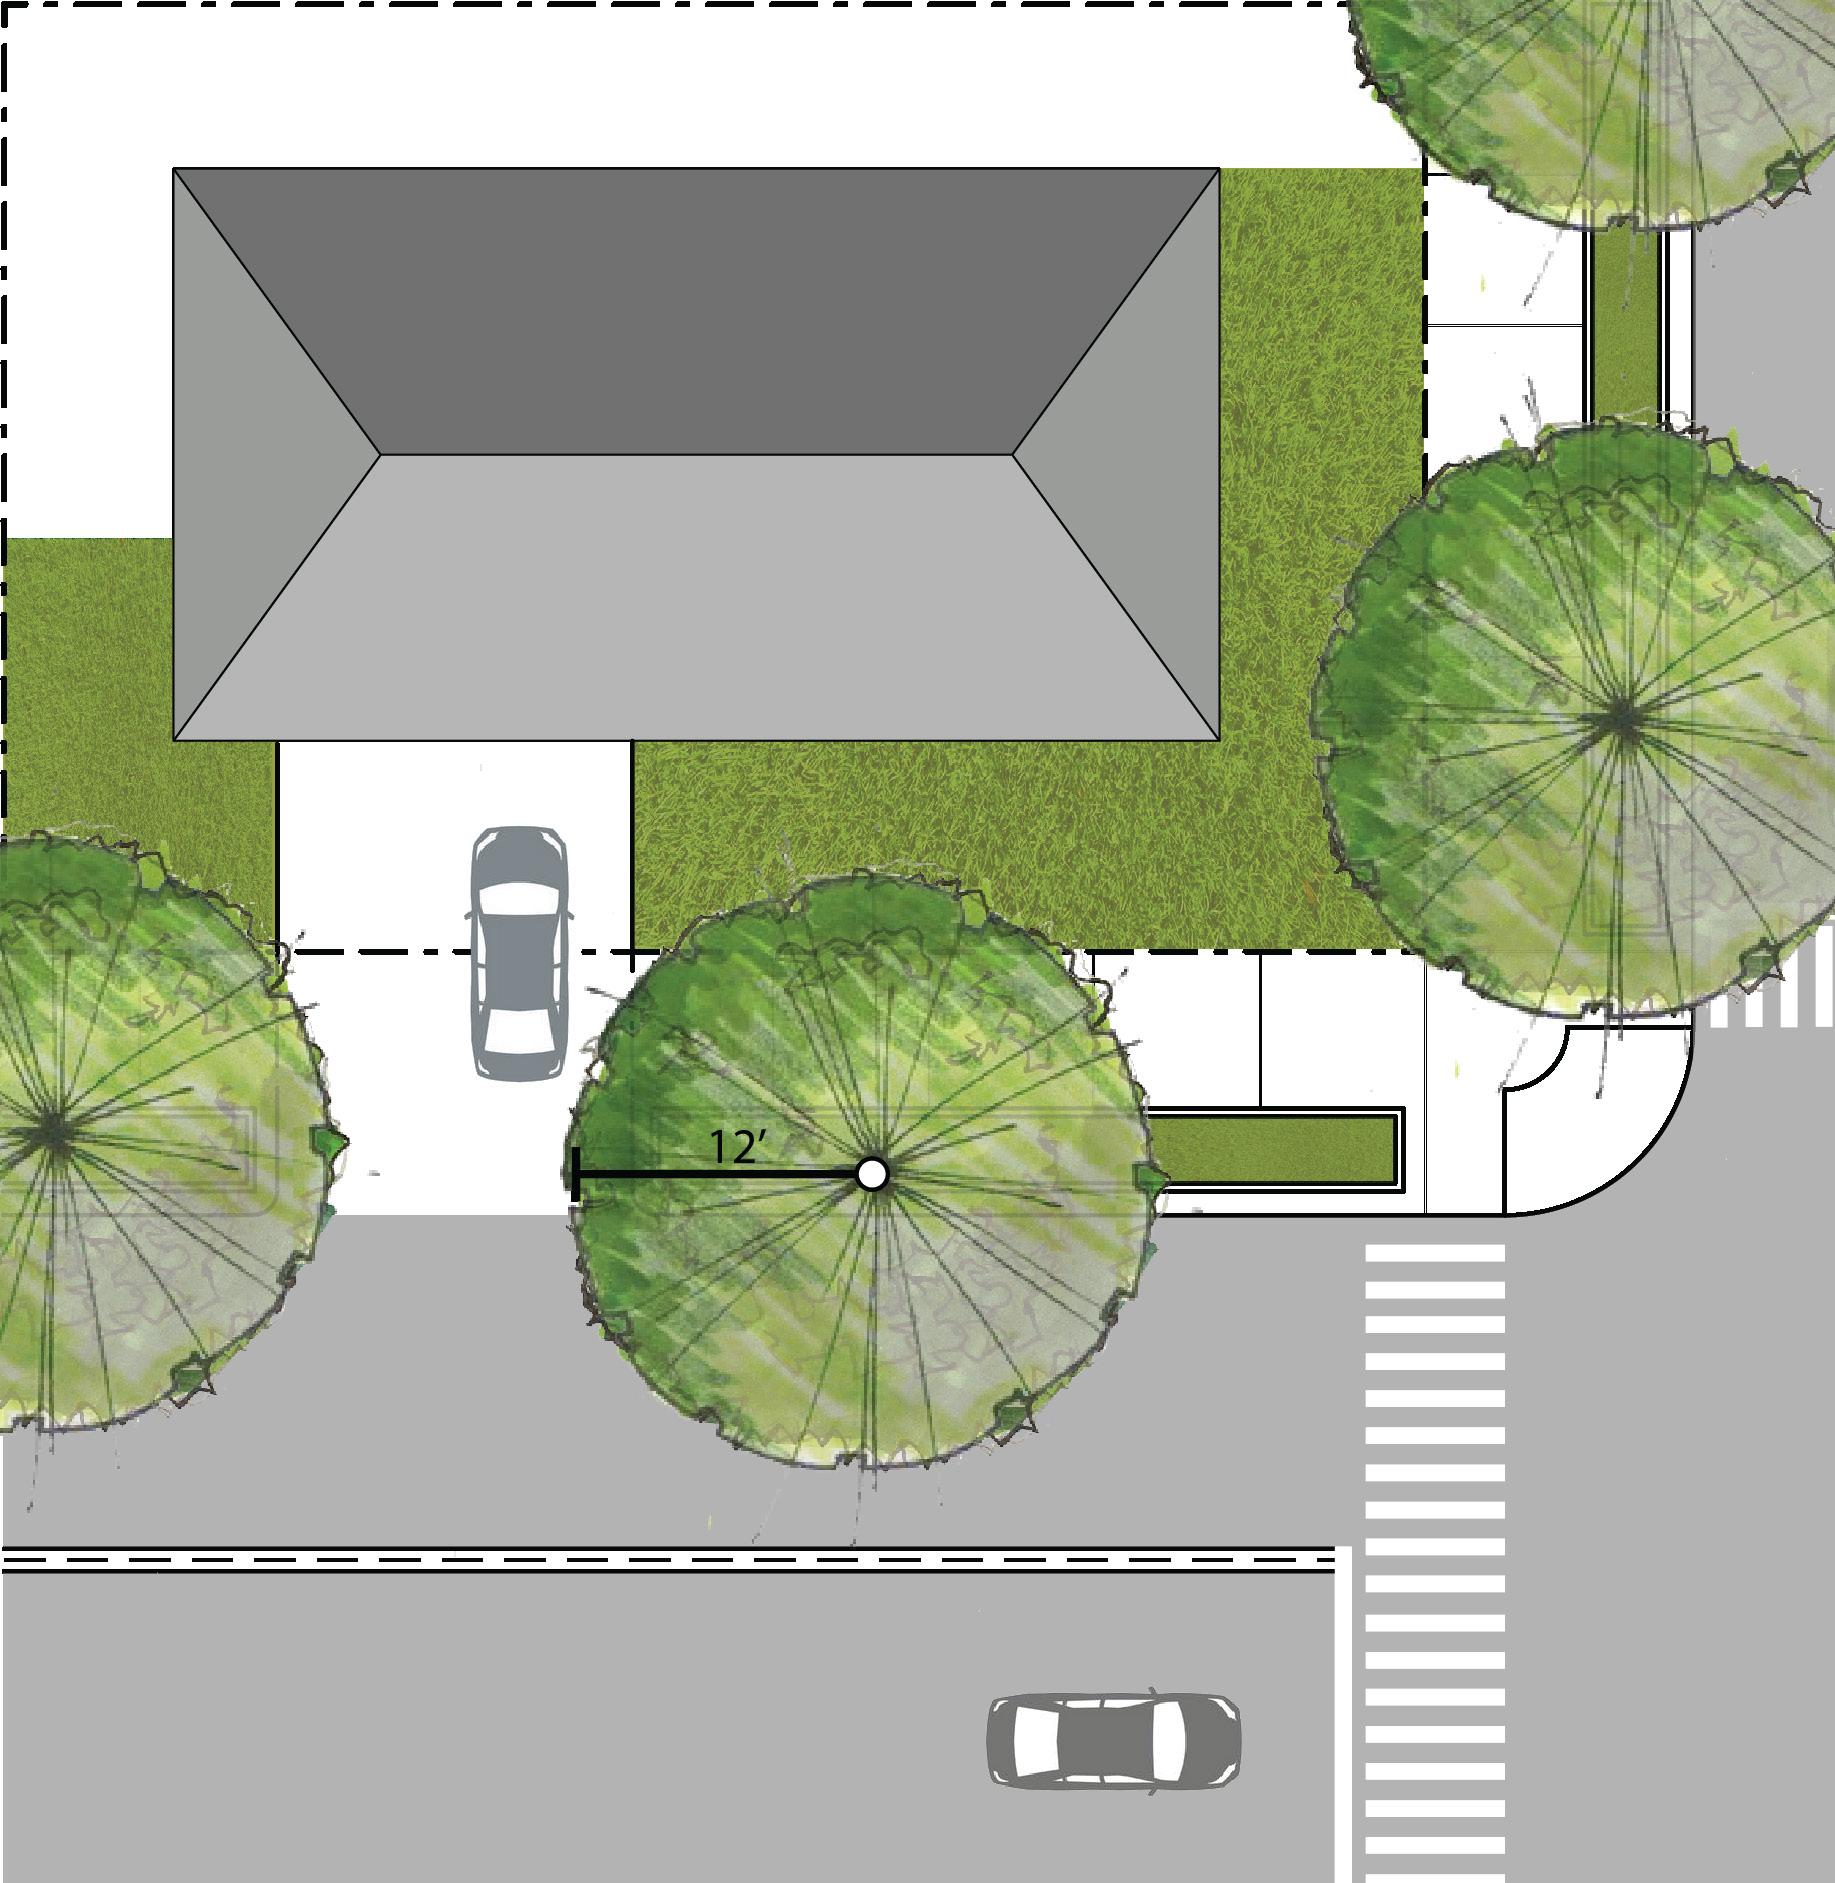
Linear typologies were calculated by assigning total % of coverage desired over a linear distance. The diameter of each tree size was used to determine linear coverage. The diagram below depicts a 100% coverage scenario:
The remaining typologies: TOD Special District, Public Land, and Parks are calculated in a similar fashion. Using the total area of each sub-category, we’ll take state parcels (excluding those within TOD) for example, contains 769,095.36 square feet of area. To achieve 35% coverage, tree canopy must meet a minimum of 35% of total square footage. In the case of state parcels, 35% results in a goal area of 269,183.38 square feet.
Tree counts are estimated by assigning a percentage of each tree size toward the goal area. For example, taking the six state parcels, appropriate breakdowns of each tree size may be 40% small trees, 50% medium and 10% large. (This number may be adjusted as TOD plans are modified.) By dividing the estimate percentage of each tree type by the square footage of each tree size, quantities are calculated. An example using small trees is shown below:
269,183.38 SF * 40% = 107,673.352 SF = 536 trees (π*8ft2)
The total area of the six state owned parcels is multiplied by the estimated 40% requirement of coverage using only small trees. We divide this resulting number by the coverage (area) of a single small tree with a 8ft radius using the formula π*r2. In this scenario, 536 trees are required to achieve 40%.
The interactive calculations table gives a base sense for how many trees will be required for improving Waipahu’s tree canopy coverage. The table above shows the breakdown of each tree type using the simulation scenario on the following page. The total coverage would exceed the 35% goal at 36.55% and would require an estimated 3,888 small trees, 1,829 medium trees, and 196 large trees. As programs and square footages become finalized for TOD plans, the percentages may be updated to reflect a more accurate representation of future TOD.
TYPOLOGY TOTAL LENGTH (mi)
TOTAL LENGTH (ft)
DESIRED CANOPY COVERAGE (%)
LENGTH COVERED AT 35% COVERAGE (ft)
Residential 8.42 44,457.60 10% 4445.76
Secondary Streets 2.00 10,560.00 40% 4,224
Rail/ Highway 1.00 5,280.00 50% 2,640
TYPOLOGY Sml Tree (r=8 ft) Med Tree (r=15 ft) Lrg Tree (r=40 ft) Total Trees Required
Residential 278 0 0 27
Secondary Streets (x2) 80 100 0 180
Rail/Highway (x2) 0 0 33 33
TOTALS 491
TOD SPECIAL DISTRICT TOTAL AREA (acres)
TOTAL AREA (SF) DESIRED CANOPY COVERAGE (%)
AREA COVERED AT DESIRED COVERAGE (SF)
Mauka 64.85 2,824,866.00 35% 988,703.10
Makai 36.96 1,609,977.60 35% 563,492.16
TOTALS 5,280.00 1,552,195.26
Small Tree (r=8 ft) Med Tree (r=15 ft) Lrg Tree (r=40 ft) Total Trees Required
Mauka at 35% 20% 60% 20%
Tree count 344 294 14 652 Makai at 35% 50% 50% 0
Tree count 491 139 0 360
TOTALS 1,282
35% BY 2035 SIMULATION
TOTAL AREA (acres)
TOTAL AREA (SF) DESIRED CANOPY COVERAGE (%)
AREA COVERED AT DESIRED COVERAGE (SF)
17.66 769,095.36 35% 269,183.38 City (Excluding Parks) 90.49 3,941,744.40 35% 1,379,610.54
State (excluding TOD District)
TOTALS 1,648,793.92
Small Tree (r=8 ft) Med Tree (r=15 ft) Lrg Tree (r=40 ft)
State at 35% 40% 50% 10%
Tree count 536 190 5 731
City at 35% 30% 40% 30%
Total Trees Required
Tree count 2059 781 82 2,922 3,653
TOTAL AREA (acres)
TOTAL AREA (SF)
EXISTING CANOPY COVERAGE (%)
DESIRED CANOPY COVERAGE (%)
CANOPY REMAINING (%)
AREA REQUIRED TO MEET DESIRED COVERAGE (SF)
Waipahu District Park 15.96 602,217 14.11% 35% 20.89% 216,903.17
Hans L’Orange Park 9.68 416,544 35.24% 35%
Hawaii Plantation Village 14.00 1,038,311 33.4% 35% 1.6% 9,635.47
TOTALS 226,538.64
Estimated tree counts
Small Tree (r=8 ft) Med Tree (r=15 ft) Lrg Tree (r=40 ft) Total Trees Required
Waipahu District Park at 20.89% 10% 40% 50%
Tree count 108 123 22 253
Hans L’Orange Park Tree count
Hawaii Plantation Village at 1.6% 0% 40% 60% Tree count 6 1 7
TOTALS 260

1 35,343 25.7 9,083 10,603 1,520 0 8 0 4,242
2 60,722 10.7 6,503 18,217 11,713 0 12 10 5,448
3 164,787 37.7 62,059 49,436 0 0 0 0 12,094
4 132,335 9.0 9,285 31,089 21,804 2 12 12 6,2520
5 57,194 26.8 15,322 17,158 1,836 1 12 8 0
6 196,511 18.9 37,160 58,953 21,793 3 12 10 17,718
Total 618,186 21.5 139,413 58,953 46,043 6 56 38 46,754
The state parcels near Waipahu District Park are possible first phase implementation sites for tree canopy improvement projects. The map (left) provides the existing canopy coverage, total parcel area, and an estimated additional tree count that would bring each parcel up to 35% coverage. The table above provides the corresponding calculations and additional information.
Calculations provided for the study area scenario were applied to each parcel. However, at the parcel scale, existing tree canopy coverage percentages are provided through the Smart Trees Pacific Tree Canopy interactive map. If no changes are expected concerning existing tree canopies, additional tree canopy coverage can be calculated to meet the 35% coverage goal for each parcel. It is also possible to exceed the 35% coverage goal for each parcel. A relevant application for exceeding 35% would be if multiple parcels are to be averaged to achieve 35%. For example, if we assume two parcels have the same square footage, one parcel can be planted to 40% and the second to 30%. The average between the two would be 35%.
main
parks
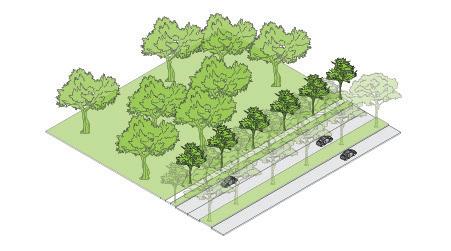
• Principal vehicular artery.
• Automobile transportation at street level and elevated rail
• More than 2 vehicle lanes at the street level for high traffic capacity
• Designed for high vehicle speeds (35-45 mph)
• Serves as the primary transit routes
• Equipped with rail, bus stops, sidewalks, and bike lanes.
Examples include: Farrington Highway
Guideway height may vary depending on location
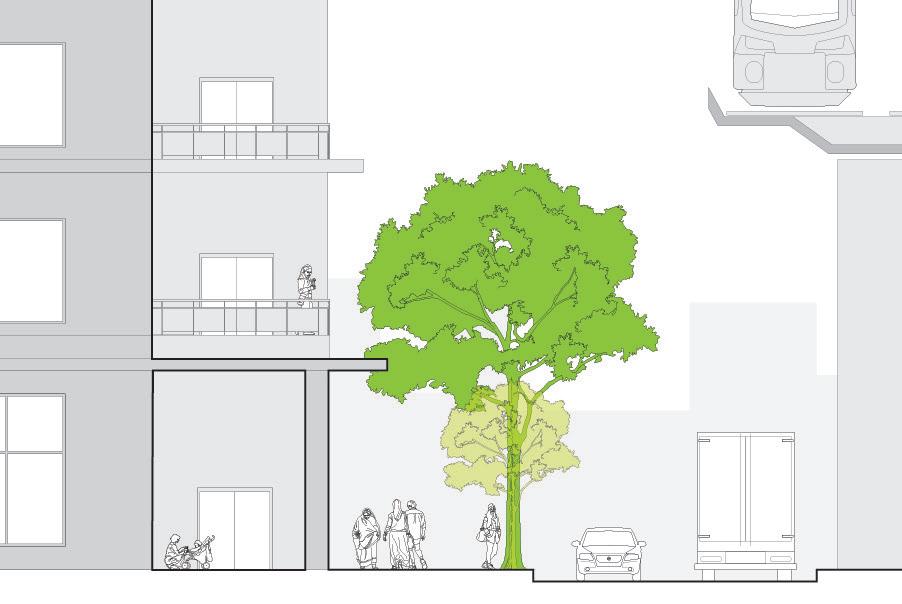
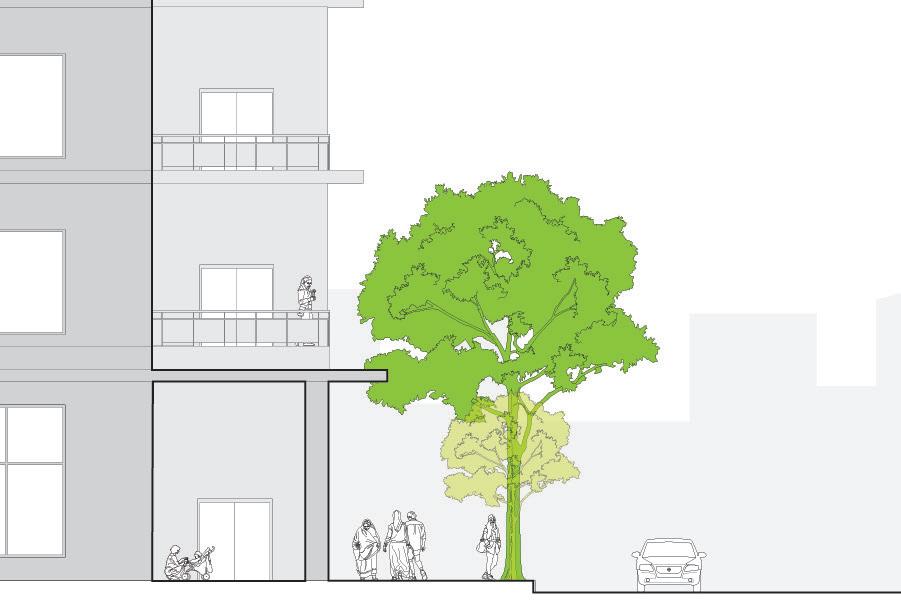
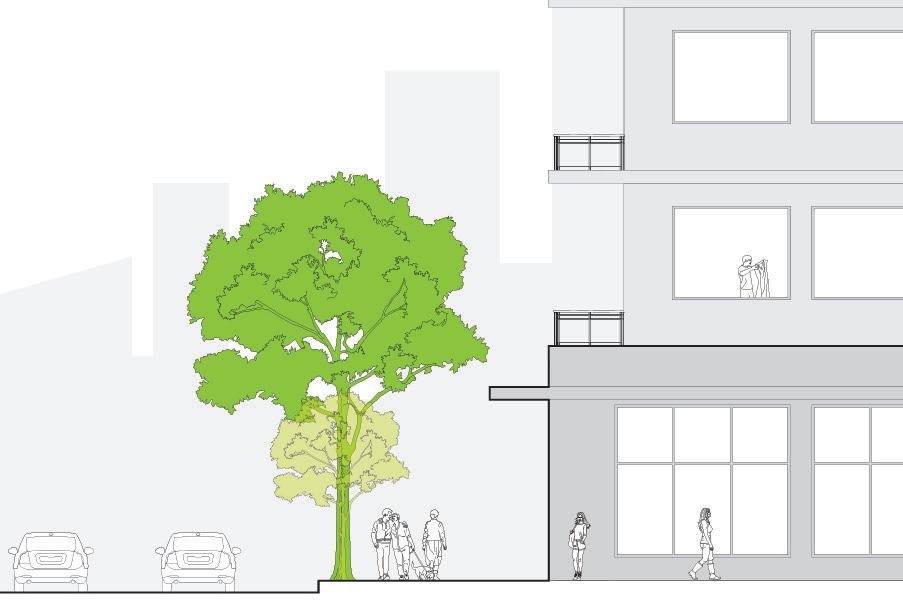
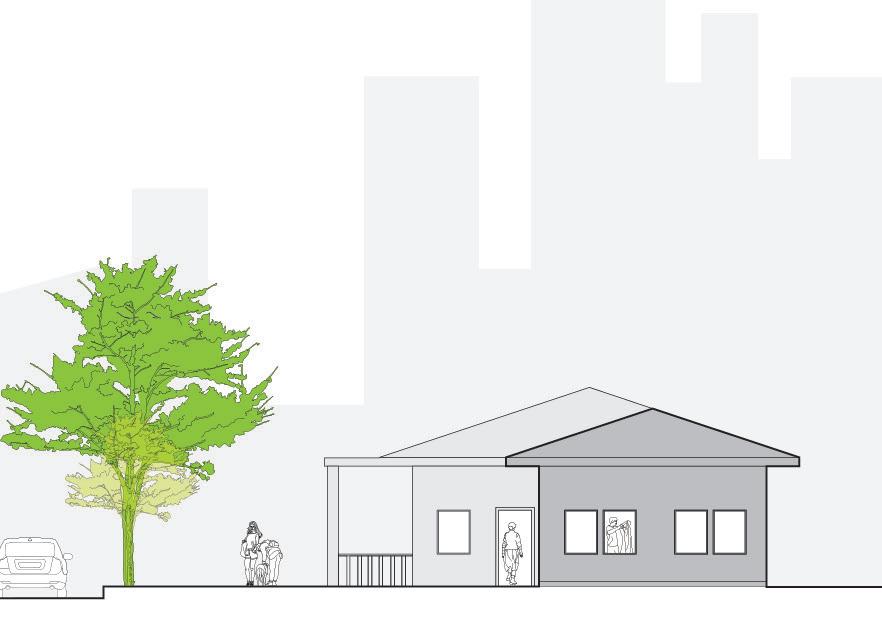
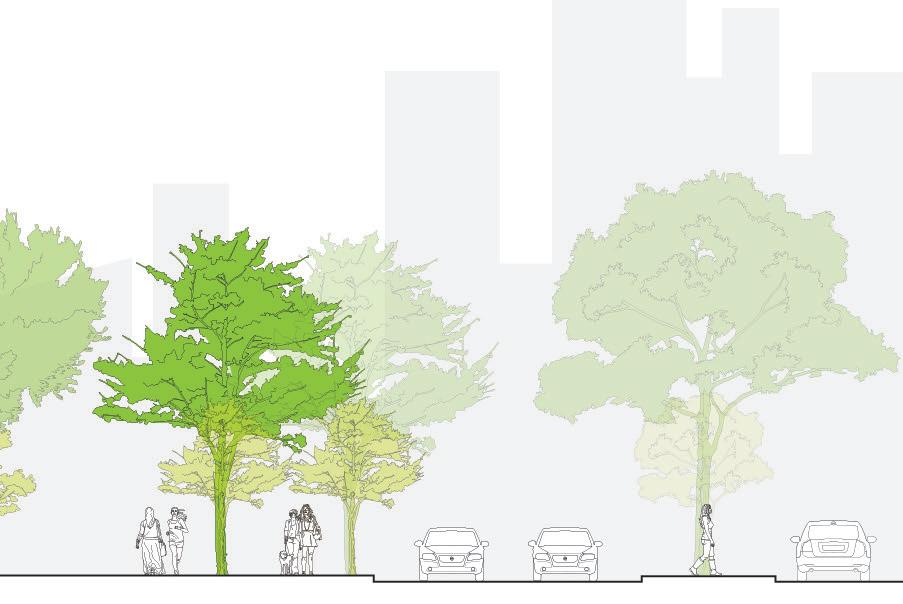
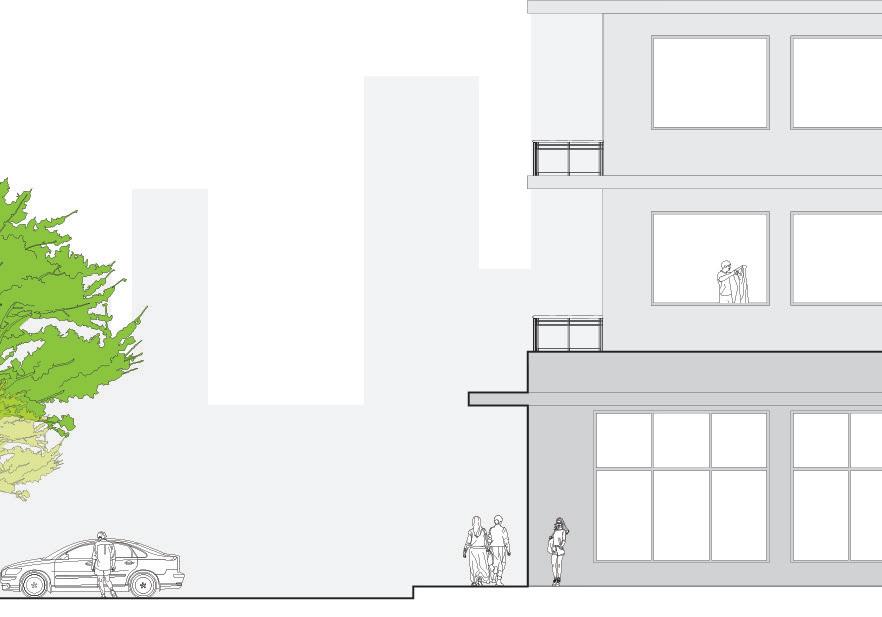
The section shows a possible street condition across Farrington Highway. Large tree species would provide shade for wide pedestrian walkways along multi-lane roadways. Tree trunks may also serve as a safety buffer for pedestrians from traffic. Larger trees would also provide a buffer for pedestrians from the vertical rail line and create an aesthetic view from the rail.
It is important to encourage accessibility along both sides of Farrington Highway. Vehicular traffic poses a safety concern, and the elevated rail currently disconnects mauka and makai.
sidewalk
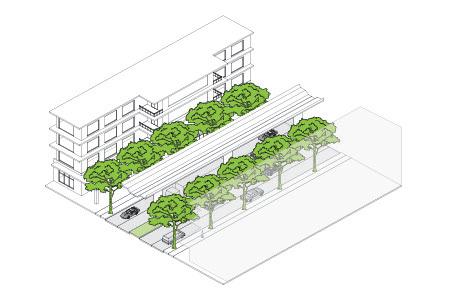
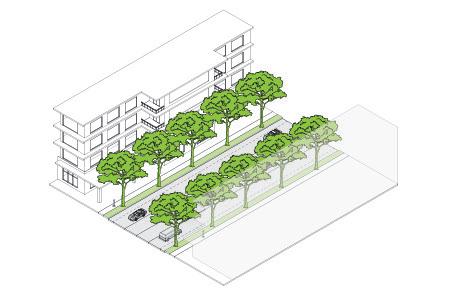
•
• Secondary vehicular artery.
• Typically 2 vehicle lanes with optional parking lanes
• Designed for moderate vehicle speeds (25-35 mph)
• Serves as secondary transit routes from primary arteries to urban centers
• Equipped with bus stops, sidewalks, and bike lanes.
Examples include: Waipahu Street, Waipahu Depot Street, Mokuola Street
travel/parking lane travel lane tree planting
bike lane
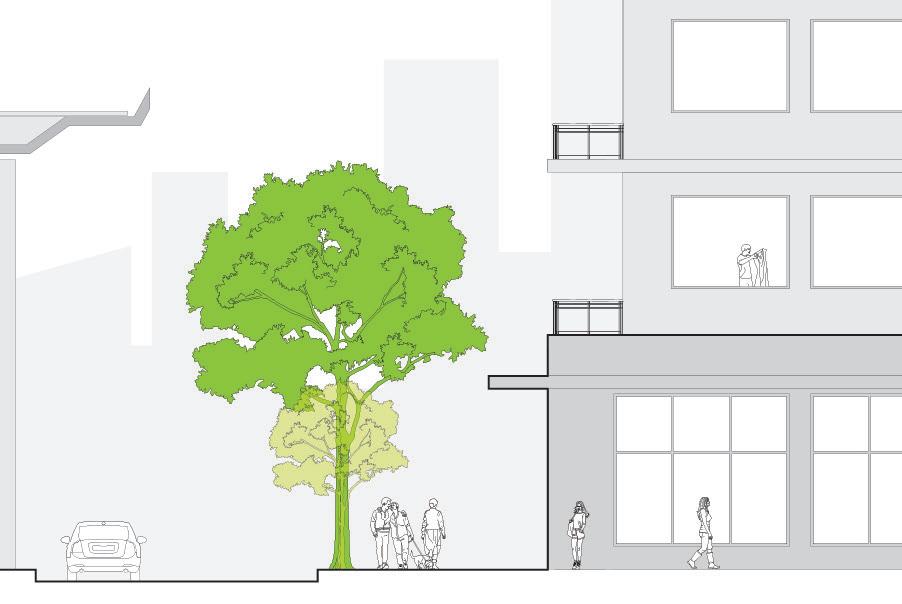
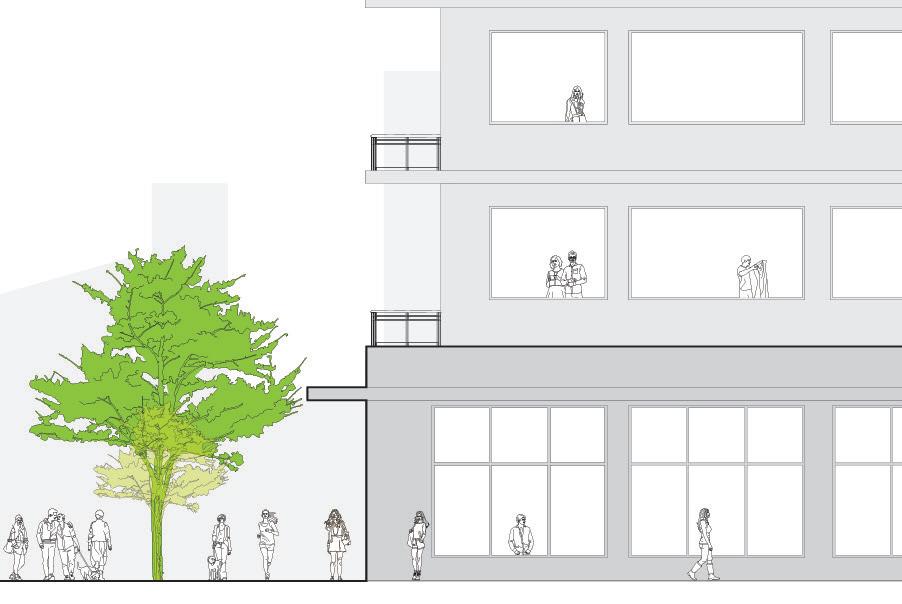
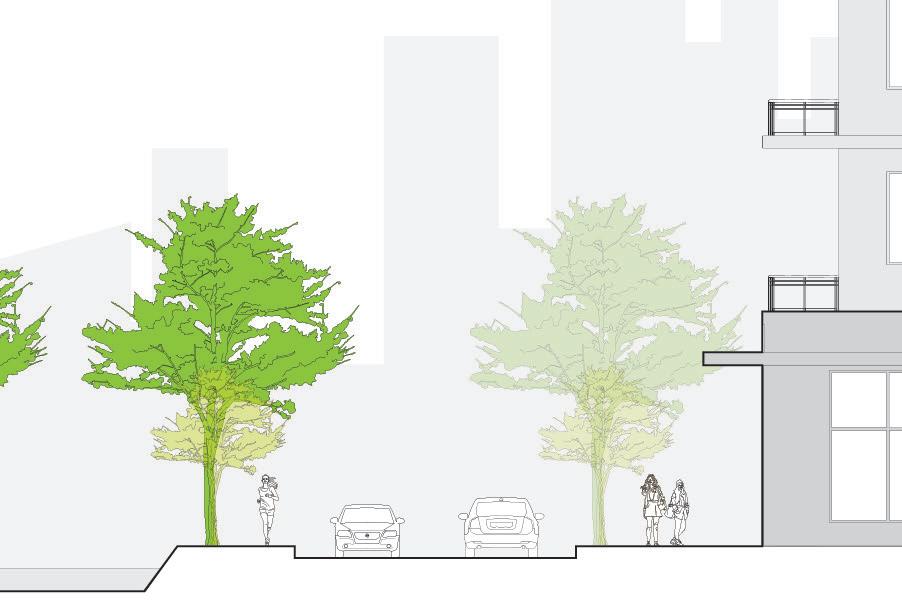
Similar strategies are used in the main street typology as the highway/rail typology. When incorporated with mixed-use street fronts and wide pedestrian sidewalks, trees become buffers from traffic lanes and provide shade.
In areas where bus stops are provided, more trees may be planted to provide cooler temperatures throughout the day.
frontage zone tree well
pedestrian street
• No vehicle transportation lanes
• Extra wide pedestrian walkways with mixed-use retail at street level
Examples include: Moloalo Street, Hikimoe Street, proposed connections between Waipahu District Park and Mokuola Street, etc.
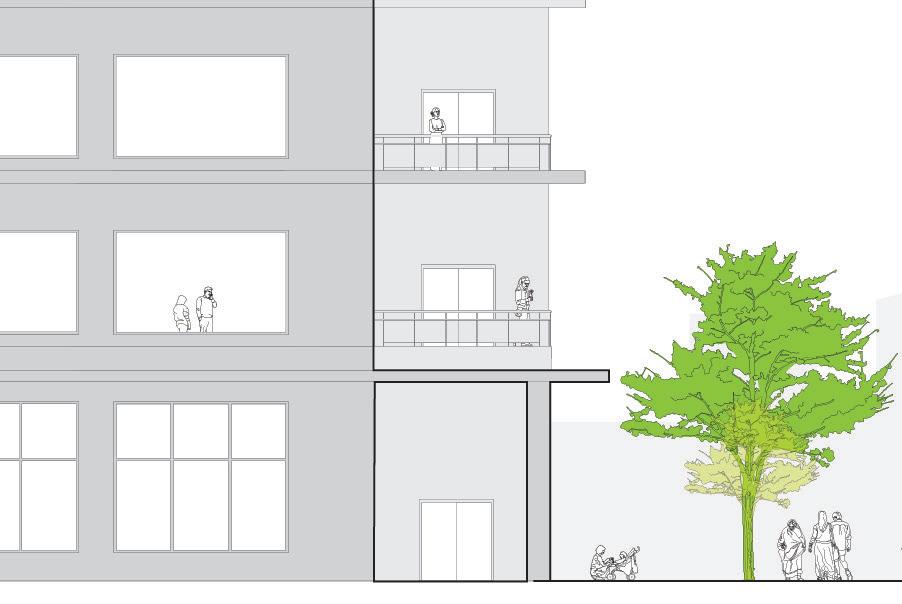
Slower transportation speeds along pedestrian streets allow tree canopy to be maximized. Tree planters may be expanded to accommodate wider canopy species. Additionally, planters do not need to be planted only along the peripheries of pedestrian streets and may be planted at street centers, as they do not need to accommodate vehicle widths.
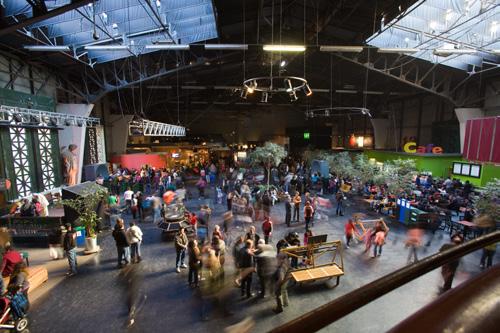
Planters provide social gathering areas with seating incorporated into its design. Trees also signal locations for benches and tables. Mixed-use use pedestrian streets for outdoor dining, street performance, farmers markets, etc. Modified streets may resemble Fort Street Mall.
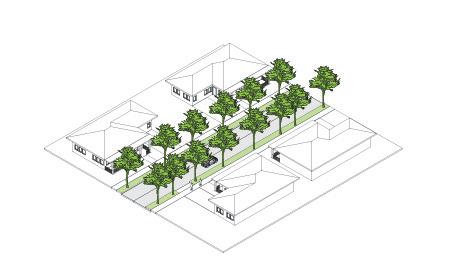
sidewalk residential setback travel lane
tree well
• Tertiary vehicular artery.
• Typically one to two lanes with optional parking lanes
• Designed for slow vehicle speeds (10-20 mph)
• Equipped with sidewalks and optional bike lanes
Examples include: Kahulani Street, Awalau Street
Modification of existing residential streets to remove one lane of existing street parking would allow for sidewalks and planters. Sidewalks and trees would provide safer and cooler conditions for residents to walk from bus stops to their homes.
Select species that require low maintenance and produces less plant matter (for example falling leaves. flowers, or seeds) for residents to clean.
sidewalk tree planting
• Tertiary artery
• Typically one lane of traffic with one optional parking lane. Some conditions may not require vehicular streets.
• Potentially raised stream banks may be equipped with walkways or bike lanes
• Designed for slow vehicle speeds (10-20 mph)
Examples include: Kapakahi and Wailani Streams, Waipahu Depot Road
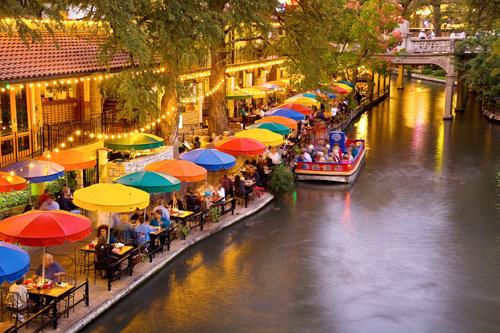
Waterways become natural pedestrian magnets especially when they become accessible and pleasant pedestrian corridors. Many varieties of vegetation may be planted along stream beds. Trees provide shade for pedestrians and stream ecology, and also provide soil stability along de-channelized stream banks.
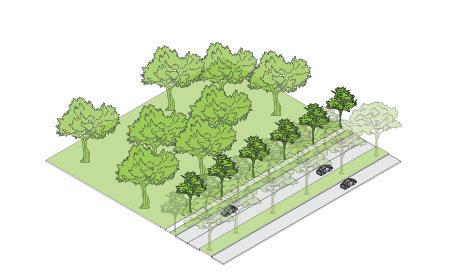
green space/nursery
• Open space with potential to plant large canopy trees
• Potential to develop a nursery-model to produce future street trees
Examples include: Hans L’Orange Park, Waipahu District Park, Hawaii Plantation Village
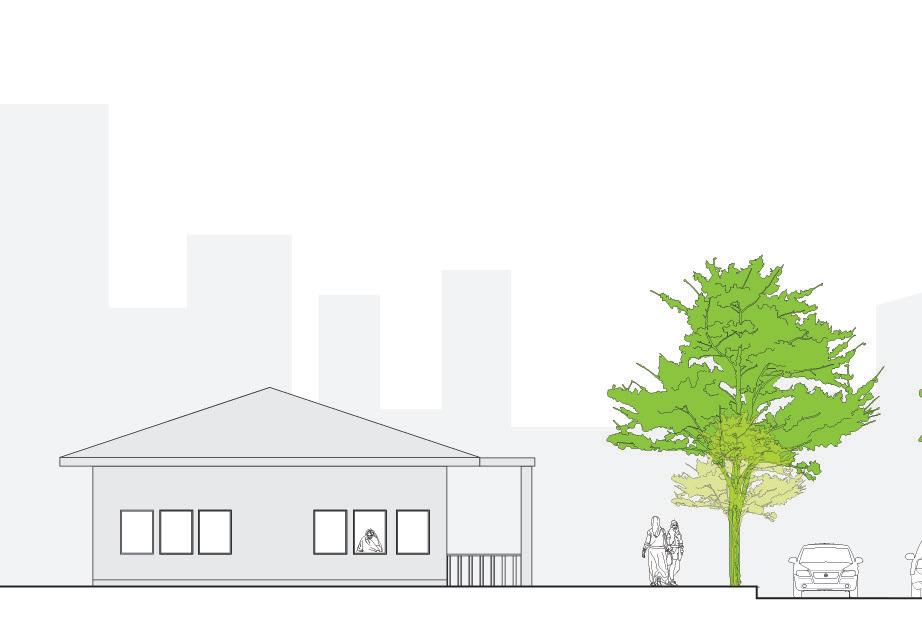
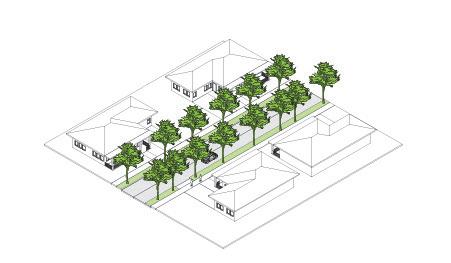
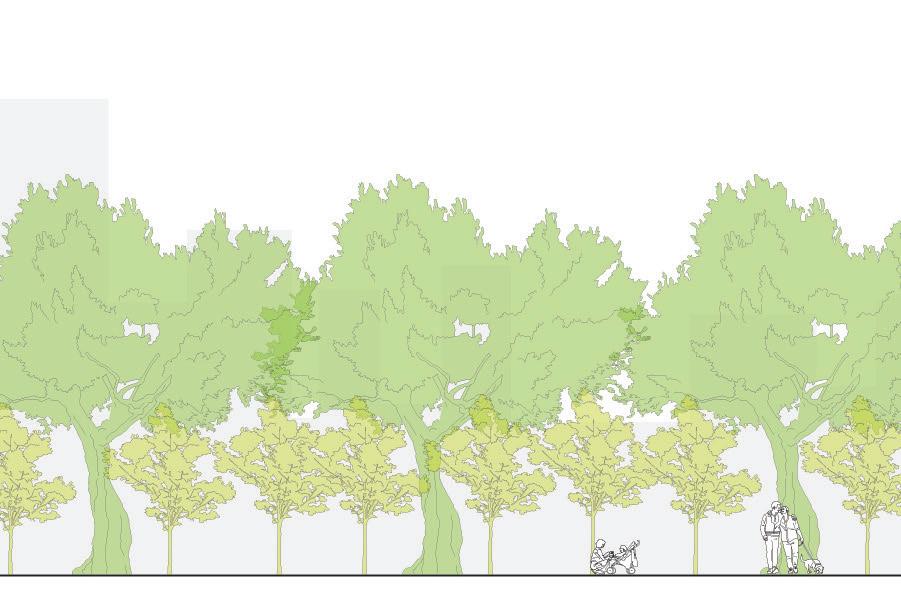
In order to acheive the 35% tree canopy coverage goal, some trees may be produced on site. Large, open spaces are ideal for propagating trees that may be permanently planted along streets or lots. The section (left) shows how trees are spaced so that as young trees grow and are removed for transplantation in other public works, trees allowed to grow to maturity produce a connected canopy.
Utilizing different tree species can help identify different boundaries, streets, and locations. Tree size and color can become a visual way-finding strategy.
parking stall
• Low vehicular traffic
• Designed for very slow vehicle speeds (5-10 mph)
• A vast surface typically made of asphalt or concrete radiates a lot of heat
Examples include: Surface parking lots along Farrington Highway
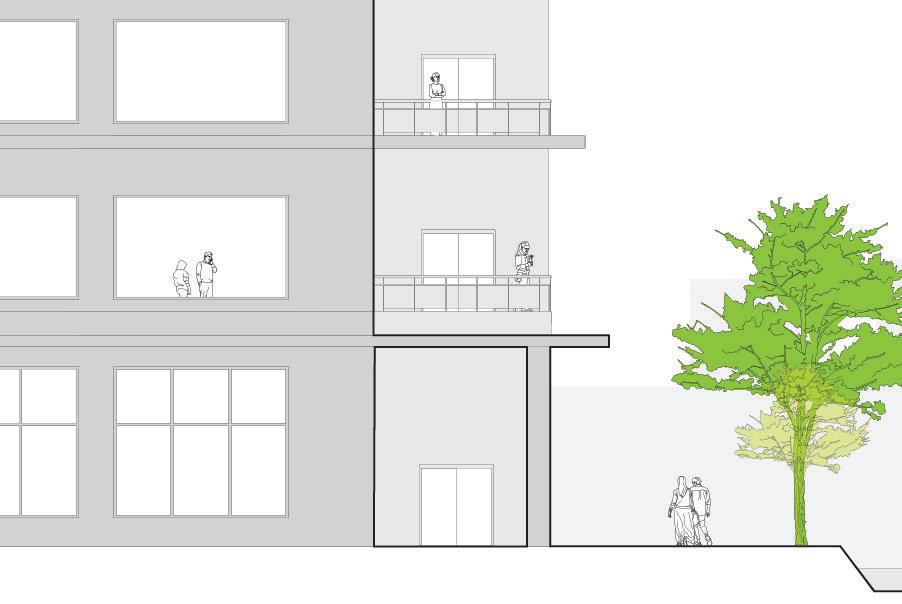
Surface parking lots may experience cooler temperatures through evapotranspiration from plants. Planters may also serve as bioswales that filters rainwater. If planted close to buildings, trees may also serve as shade to building interiors, therefore reducing cooling costs.
Hot, unshaded parking lots typically serve vehicles only. Add ing trees would help by providing shade, sequestering carbon dioxide and providing habitat for local fauna. The parking lot would then become a place that serves people, plants, animals, and vehicles.
Page intentionally left blank.

Tree canopies can be calculated for a variety of benefits including cooling-related energy savings, CO2 and air pollutant sequestration, stormwater infrastructure, and increased property value. According to the Municipal Forest Resource Analysis1:
• Electricity saved annually in Honolulu from both shading and climate effects of inventoried trees totals 1,943 MWh ($343,356) or $8 per tree.
• Net CO2 reduction is 3,340 tons, valued at $22,314 or $0.51 per tree.
• Net annual air pollutants removed, released, and avoided average 0.41 lb per tree and are valued at $47,365 or $1.08 per tree.
This section will analyze the six state parcels individually with a 35% tree canopy coverage scenario. The purpose of this analysis is to show home owners and government entities the value of planting and maintaining trees. In order to estimate benefits, the online simulator tool, iTree, was used. The simulator allows for savings and benefits calculation by utilizing parcel size, building and tree placement, and tree characteristics. Optimization using solar orientation was not conducted for this analysis.
Trees selected in this study was limited to the inventory of tree species list provided by the iTree simulation. Hawaiʻi-specific species not included in the iTree simulation may require additional research to provide accurate savings and benefits calculation information. For the purpose of this study, five trees were used in the analysis: the shower tree, monkeypod tree, palm tree, pink tecoma tree, and fern tree. These trees should be considered placeholders for suggested species for use in Waipahu (please see the appendix for the suggested species list).
For more information about the iTree simulator, please visit design.itreetools.org.
TREE PROPERTY VALUE CAPTURED C02 AIR QUALITY
ENERGY REDUCTION STORM WATER REDUCTION TOTAL ANNUAL PER TREE
1. SHOWER TREE 174.52 1.80 5.40 26.34 29.65 237.71
2. MONKEYPOD TREE 54.74 0.53 0.86 5.84 6.24 68.22
3. PALM TREE 69.34 0.28 0.84 6.27 7.99 83.79
4. PINK TECOMA TREE 54.74 0.53 0.86 5.84 6.24 68.22
5. FERN TREE 87.05 0.52 0.11 6.83 7.70 102.21
Source:
1. 1. Center for Urban Forest Research. City of Honolulu, Hawaiʻi, Municipal Forest Resource Analysis. November 2017.

TREE SIZE DBH (IN) LOCATION TO STRUCTURE
CURRENT YEAR (2019) PROJECTED TOTAL (2019-2035)
1. PINK AND WHITE SHOWER M 18 NORTHEAST $71.53 $1,145
2. PINK AND WHITE SHOWER M 18 EAST $148.65 $2,378
3. PINK AND WHITE SHOWER M 18 EAST $148.65 $2,378
4. PINK AND WHITE SHOWER M 18 SOUTHEAST $86.73 $1,388
5. PINK AND WHITE SHOWER M 18 SOUTH $110.20 $1,763
6. PINK AND WHITE SHOWER M 18 SOUTHWEST $125.02 $2,000
7. PINK AND WHITE SHOWER M 18 SOUTHWEST $92.91 $1,487
8. PINK AND WHITE SHOWER M 18 WEST $25.10 $402
TOTAL $808.79 $12,941
lot trees.
for 20 trees.


TREE SIZE DBH (IN) LOCATION TO STRUCTURE
CURRENT YEAR (2019) PROJECTED TOTAL (2019-2035)
1. PINK AND WHITE SHOWER M 22 EAST $152.98 $2,448
2. PINK AND WHITE SHOWER M 22 SOUTHEAST $128.35 $2,054
3. PINK AND WHITE SHOWER M 22 SOUTH $116.64 $1,866
4. PINK AND WHITE SHOWER M 22 SOUTH $111.82 $1,789
5. PINK AND WHITE SHOWER M 22 EAST $172.72 $2,764
6. PINK AND WHITE SHOWER M 22 NORTHEAST $66.89 $1,070
7. PINK AND WHITE SHOWER M 22 SOUTH $110.74 $1,772
8. PINK AND WHITE SHOWER M 22 SOUTH $91.63 $1,466
9. PINK AND WHITE SHOWER M 22 SOUTWEST $131.46 $2,103
10. PINK AND WHITE SHOWER M 22 NORTH $130.01 $2,080
11. SILVER BUTTONWOOD S 12 NORTH $34.64 $554
12. SILVER BUTTONWOOD S 12 NORTH $28.37 $454
13. SILVER BUTTONWOOD S 12 NORTH $34.64 $554
14. SILVER BUTTONWOOD S 12 NORTH $28.37 $454
15. SILVER BUTTONWOOD S 12 NORTH $34.64 $554
16. SILVER BUTTONWOOD S 12 NORTHWEST $38.77 $625
17. SILVER BUTTONWOOD S 12 NORTHWEST $75.04 $1,220
18. SILVER BUTTONWOOD S 12 NORTHWEST $38.77 $625
19. SILVER BUTTONWOOD S 12 WEST $162.88 $2,638
20. SILVER BUTTONWOOD S 12 WEST $111.08 $1,806
TOTAL $1,800.48 $28,897


Page intentionally left blank.


TREE SIZE DBH (IN) LOCATION TO STRUCTURE
CURRENT YEAR (2019) PROJECTED TOTAL (2019-2035)
1. MONKEYPOD L 40 E / SE $208.97 $3,346
2. MONKEYPOD L 40 SE / S $93.88 $1,504
3. PINK AND WHITE SHOWER M 25 SE / SE $36.42 $583
4. PINK AND WHITE SHOWER M 25 SE / SE $36.42 $583
5. PINK AND WHITE SHOWER M 25 E / SE $36.42 $583
6. PINK AND WHITE SHOWER M 25 SE / S $36.42 $583
7. PINK AND WHITE SHOWER M 25 SE / SE $36.42 $583
8. PINK AND WHITE SHOWER M 25 SE / S $36.42 $583
9. PINK AND WHITE SHOWER M 25 SE / S $36.42 $583
10. PINK AND WHITE SHOWER M 25 SE / S $36.42 $583
11. PINK AND WHITE SHOWER M 25 SE / S $36.42 $583
12. PINK AND WHITE SHOWER M 25 E / SE $36.42 $583
13. PINK AND WHITE SHOWER M 25 NE / N $36.42 $583
14. PINK AND WHITE SHOWER M 25 NE / NE $36.42 $583
15. PLUMERIA S 8 NE / NE $14.56 $234
16. PLUMERIA S 8 NE / NE $17.19 $277
17. PLUMERIA S 8 NE / NE $14.07 $226
18. PLUMERIA S 8 E / SE $14.16 $228
19. PLUMERIA S 8 E / S $7.65 $124
20. PLUMERIA S 8 E / S $7.65 $124
21. PLUMERIA S 8 E / S $7.65 $124
22. PLUMERIA S 8 NE / S $25.00 $403
23. PLUMERIA S 8 SE / S $7.65 $124
24. PLUMERIA S 8 E / SE $7.65 $124
TOTAL $863.12 $13,828


TREE SIZE DBH (IN) LOCATION TO STRUCTURE
CURRENT YEAR (2019) PROJECTED TOTAL (2019-2035)
1. PINK AND WHITE SHOWER M 25 N/A $36.42 $583
2. PINK AND WHITE SHOWER M 25 N/A $36.42 $583
3. PINK AND WHITE SHOWER M 25 N/A $36.42 $583
4. PINK AND WHITE SHOWER M 25 N/A $36.42 $583
5. PINK AND WHITE SHOWER M 25 N/A $36.42 $583
6. PINK AND WHITE SHOWER M 25 N/A $36.42 $583
7. PINK AND WHITE SHOWER M 25 N/A $36.42 $583
8. PINK AND WHITE SHOWER M 25 N/A $36.42 $583
9. PINK AND WHITE SHOWER M 25 N/A $36.42 $583
10. PINK AND WHITE SHOWER M 25 N/A $36.42 $583
11. PINK AND WHITE SHOWER M 25 N/A $36.42 $583
12. PINK AND WHITE SHOWER M 25 N/A $36.42 $583
13. PLUMERIA S 8 N/A $7.65 $124
14. PLUMERIA S 8 N/A $7.65 $124
15. PLUMERIA S 8 N/A $7.65 $124
16. PLUMERIA S 8 N/A $7.65 $124
17. PLUMERIA S 8 N/A $7.65 $124
18. PLUMERIA S 8 N/A $7.65 $124
19. PLUMERIA S 8 N/A $7.65 $124
20. PLUMERIA S 8 N/A $7.65 $124
21. MONKEYPOD L 40 N/A $93.88 $1,504
TOTAL $592.12 $9,485
the most variety of
added along
become street trees. Medium trees will also be planted on the south part of the parcel for a walking
Street
that connects from a pedestrian bridge over the canal through Mokuola Street towards the transit station.
large trees
shade
recreational green spaces.
TREE SIZE DBH (IN) LOCATION TO STRUCTURE
CURRENT YEAR (2019) PROJECTED TOTAL (2019-2035)
1. MONKEYPOD L 40 E / SE $93.88 $1,504
2. MONKEYPOD L 40 SE / SW $93.88 $1,504
3. MONKEYPOD L 40 S / W $155.51 $2,490
4. PLUMERIA S 8 E / NE $7.65 $124
5. PLUMERIA S 8 E / NE $7.65 $124
6. PLUMERIA S 8 E / NE $7.65 $124
7. PLUMERIA S 8 E / NE $7.65 $124
8. PLUMERIA S 8 E / E $7.65 $124
9. PLUMERIA S 8 E / E $7.65 $124
10. PLUMERIA S 8 E / E $7.65 $124
11. PLUMERIA S 8 E / E $7.65 $124
12. PLUMERIA S 8 E / E $7.65 $124
13. PLUMERIA S 8 E / E $7.65 $124
14. PINK AND WHITE SHOWER M 25 E / E $36.42 $583
15. PINK AND WHITE SHOWER M 25 E / E $36.42 $583
16. PINK AND WHITE SHOWER M 25 E / E $36.42 $583
17. PINK AND WHITE SHOWER M 25 E / SE $36.42 $583
18. PINK AND WHITE SHOWER M 25 E / SE $36.42 $583
19. PINK AND WHITE SHOWER M 25 E / SE $98.05 $1,569
20. PINK AND WHITE SHOWER M 25 SE / SE $98.05 $1,569
21. PINK AND WHITE SHOWER M 25 SE / S $121.52 $1,944
22. PINK AND WHITE SHOWER M 25 E / SE $80.49 $1,288
23. PINK AND WHITE SHOWER M 25 E / E $159.97 $2,560
24. PINK AND WHITE SHOWER M 25 E / NE $82.85 $1,326
25. PINK AND WHITE SHOWER M 25 SW / W $104.23 $1,668
26. PINK AND WHITE SHOWER M 25 SW / W $88.12 $1,410
TOTAL $1,435.16 $22,981
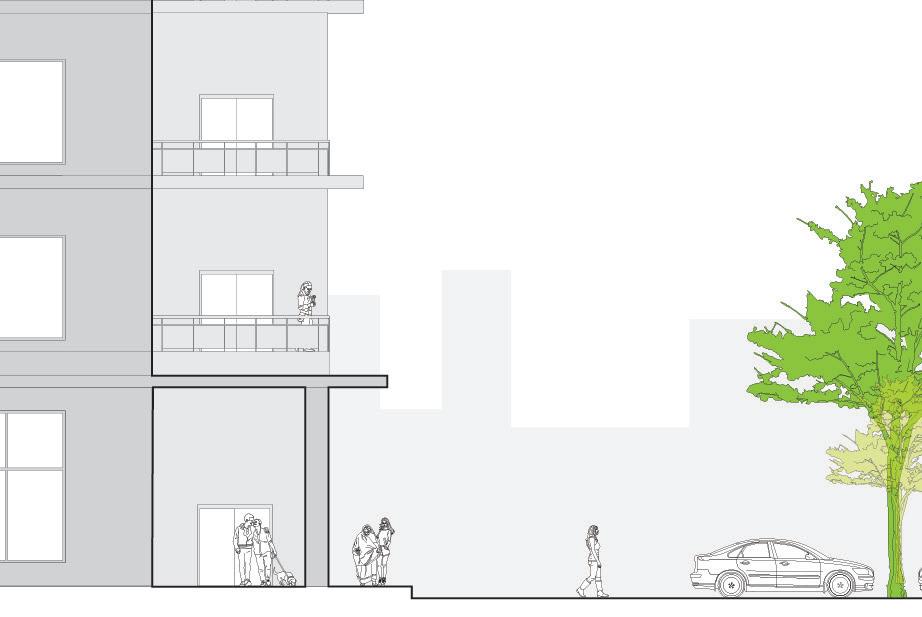
SHOWER
residential incentives will greatly increase tree canopy
but is also the most difficult to implement. The illustration
provides a scenario if a resident were to plant trees on their property,their savings in one year, or over 16 years at 2035. This scenario plants two medium size trees on along the sidewalk and one more tree in the resident’s property.
Page intentionally left blank.
Month
Average Low (°F)1
Average High (°F) 1
Average Temperature (°F) 1 Average Predicted 35% Scenario (°F)
January 62 80 70.5 64.78
February 61 80 71 64.28
March 63 80 71.5 65.28
April 65 82 73.5 67.28
May 65 84 74.5 68.28
June 68 85 76.5 70.28
July 69 86 77.5 71.28
August 70 87 78.5 72.28
September 69 87 78 71.78
October 68 86 77 70.78
November 66 83 74.5 68.28
December 63 81 72 65.78
Average 65.75 83.42 74.58 65.78
Utilizing the USDA Forest Services’ online tool library, itreetools.org, numerous tree-related benefits can be calculated such as CO2 sequestration, energy savings, and cooling calculations.
The cooling calculations above estimate resulting temperature changes in relation to a 35% tree canopy cover using average temperature data collected in 2018. Typical characteristic of the three tree types (S, M, L) are input into the I-tools calculator. A value is given that reflects the average temperature change under a tree’s canopy. In this scenario, small trees are given a value of -5, a medium tree is -7, and a large tree is -9. Using the tree count provided in the 35% by 2035 simulations tables, each typology’s cooling factor is calculated and averaged to find the average temperature factor of the study area. Using the 2035 simulation data, the average temperature drop is 6.22 °F.
It is important to note that future climate change trends indicate an increase in climate temperature. The data represented may not accurately reflect future climate values.
Sources
1. NOAA. https://www.ncdc.noaa.gov/
2. USDA Forest Service. Itreetools.org. Accessed June 26, 2018. https:// www.itreetools.org/.
Page intentionally left blank.
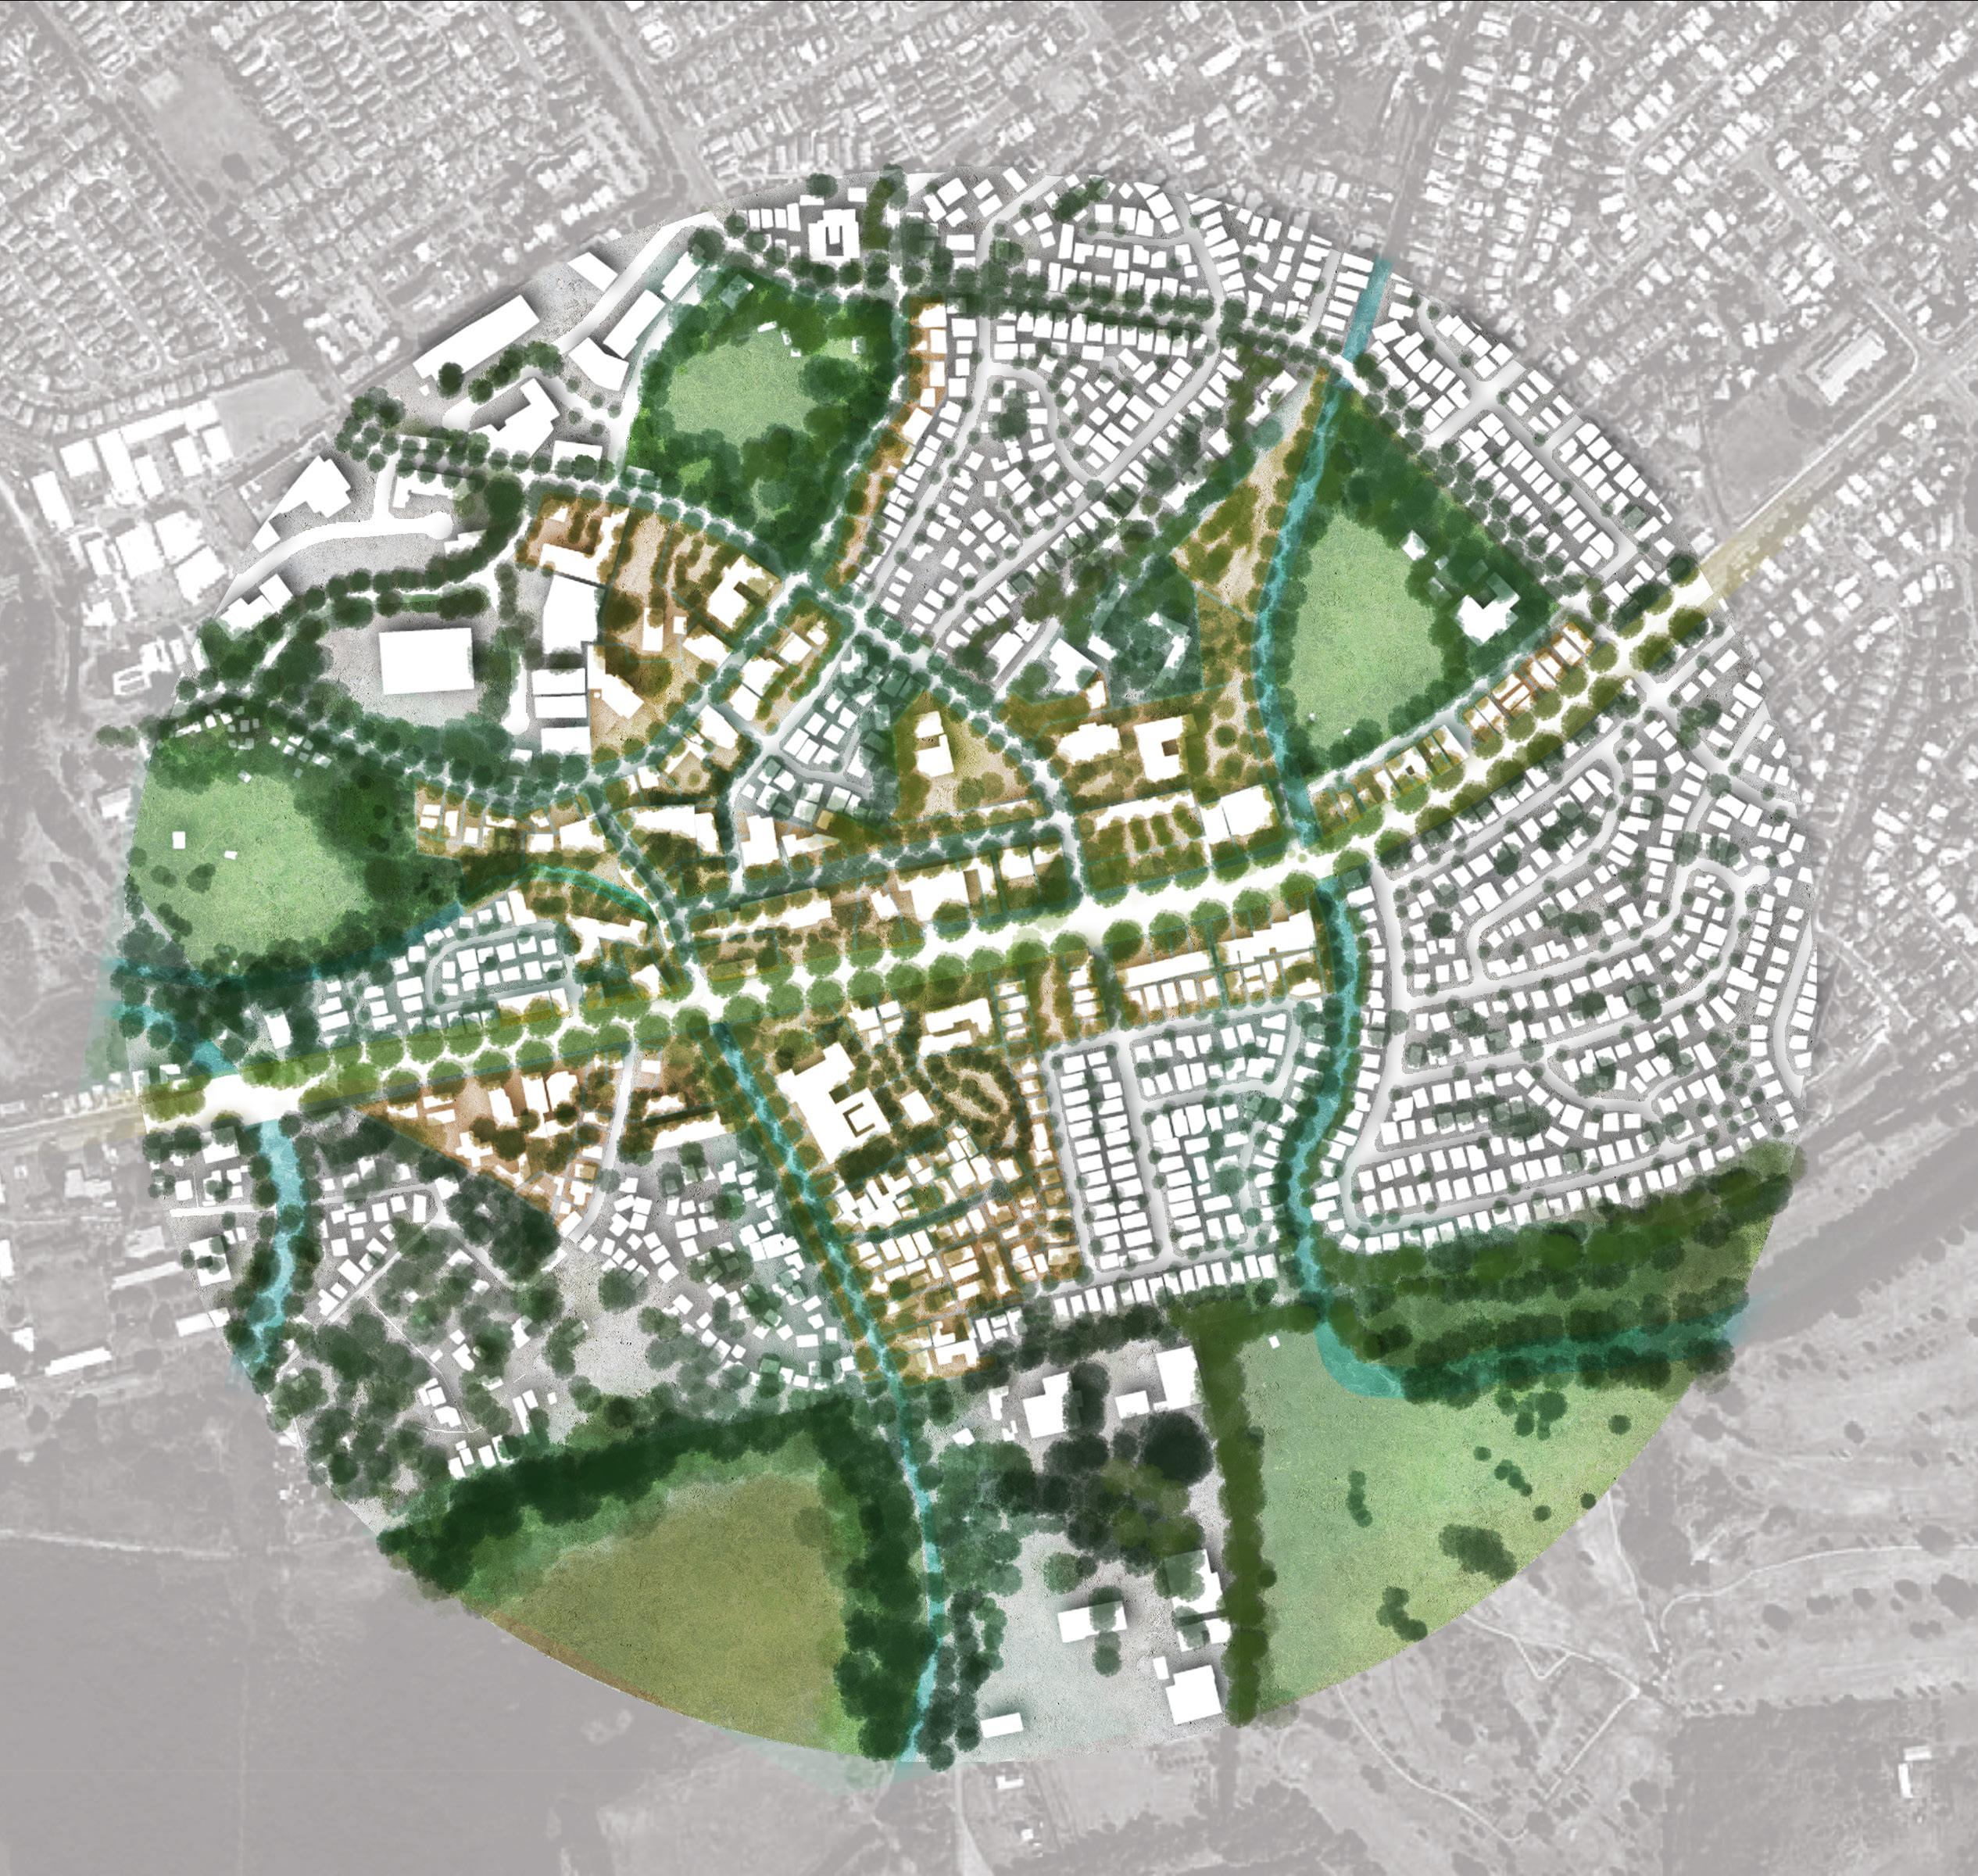
The organizational approach of a future canopy in Waipahu should be considered extensive yet incremental if it is to reach the 35% by 2035 goal. Two scales of approach are required: 1) Small-scale interventions, including front-yard planting and maintenance incentivizing programs, and 2) A more broad and optimal ecological spatial model to encompass a greenway or green-belt strategy to connect to regional preservation areas. Future study and design of the improved canopy system should blend analytical and descriptive methods of planting to explore inter-relational programs that provide a framework for new situations and human interfaces with natural systems. These could include programs like the Citizen Forester training program, or Arbor Day planting and maintenance activities, and also potentially urban agriculture efforts to stimulate a more comprehensive approach to an active public realm and a truly healthy tree canopy. New social and cultural programming within the study site would connect the Waipahu community to its canopy in a direct way, and would ensure a more likely scenario of true sustainability. Without an educational and social component to the tree canopy, the system may risk failure over time. Instead, and in order to build a rich and lasting connection between Waipahu’s community and its tree canopy, a strategic layering of existing and future programmed elements is required to promote a heterogeneous end result. The design of the TOD zone landscape should more suitably provide a flexible field that absorbs a variety of programs and should put people, materials, uses into juxtaposition in new and exciting ways. Existing landscape elements such as canopy trees should be cared for and celebrated, and new tree plantings should promote a community engagement and emphasis on socialization, culture and education through key annual scheduled events. It is recommended that the State Office of Planning work closely with the City and County to generate a Request For Proposal (RFP) for an Urban Ecological Design Framework and Tree Canopy Masterplan that aids the community of Waipahu as they work to improve the relationships between ecological processes within the existing urban footprint in the years ahead.
Page intentionally left blank.
Page intentionally left blank.
Page intentionally left blank.
The Suggested Tree Species Master List is organized in order of lowest to highest invasive risk as assessed through the Hawaii Pacific Weed Risk Assessment using the WRA designation: low (L), high (H), further evaluation required (E) and a numeric WRA score, for example, the rainbow shower tree is given a rating of L-8, a low risk designation and numeric score of -8.
Plants selected in this master list consist of plants with tolerance to drier conditions, with the half-mile viscinity of the Pouhala Rail Station in Waipahu, Oahu. Application of this list is not recommended for other areas.
This list was compiled from documents from the City and County of Honolulu’s Department of Planning and Permitting’s 1999 Standards and Procedures for the Planting of Street Trees, City of Honolulu’s Center for Urban Forest Research’s 2007 Municipal Forest Resource Analysis, and Maui County’s Maui County Arborist Committee’s 2016 Maui County Planting Plan (third edition).
Native species
Low Invasive Risk
Further Invasive Risk Evaluation Needed
High Invasive Risk
Sources:
1. Hawaii-Pacific Weed Risk Assessment. [All species listed]. www.hpwra. org. Accessed June 14, 2018.
2. Ernest H. Rezents. Maui County Planting Plan. Maui County Arborist Committee, Third Edition. March 9, 2016.
3. City and County of Honolulu Department of Planning and Permitting. Standards and Procedures for the Planting of Street Trees. July 1999.
tolerant sensitive yellow SpWn low, low maint dry-med
moderate sensitive white mod, med maint (dry) med-wet fruits tolerant tolerant white SpSuFaWn mod, med maint dry-med-wet leaves, nuts
moderate tolerant orange SpSuFaWn low (fruit), med maint (Dry) med-wet flowers, fruits can handle light sea spray
tolerant sensitive inconspic. none, low maint dry-med tolerant tolerant n/a none, low maint dry-med
tolerant moderate red, orange, white, green, yellow SpSu
mod, med maint dry-med pods
tolerant sensitive white SpSuWn none, low maint dry-med
tolerant sensitive yellow SpWn mod, low maint flowers tolerant sensitive red, orange, yellow SpSuWn none, low maint (Dry) med-wet Evergreen, does well in urban settings. Canopy may take years to become full tolerant sensitive inconspic. none, low maint dry fruits tolerant tolerant white SpSuFaWn high, high maint (dry) med-wet fruits
tolerant sensitive white SpWn none, low maint dry-med fruits tolerant sensitive inconspic. none, low maint dry-med tolerant sensitive inconspic. low, low maint dry tolerant tolerant White SpSuFa mod, med maint (dry) med-wet nuts
tolerant moderate White Fa none, low maint dry-med fruits
tolerant tolerant yellow SpSuFa mod, med maint (dry) med-wet fruits
tolerant moderate orange SuFa low, low maint dry-med-wet flowers, pods
moderate sensitive purple SpSuFa mod, med maint (dry) med-wet flowers, pods
Invasive
Low (-6)
Low (-5)
Low (-5)
Low (-5)
officinale
shower
elastica
Low (-5) Plumeria
Low (-4)
vitifolium
Low (-4) Harpullia pendula Tulipwood
Low (-4) Lagerstroemia speciosa
Low (-4) Tabebuia berteroi
rosy
of India
Low (-4) Tabebuia donnell-smithii Gold tree
Low (-4) Thespesia grandiflora
Low (-3) Conocarpus erectus
Low (-3) Gliricidia sepium Madre de cacao
Low (-3)
Tabebuia ochracea
Low (-3) Tamarindus indica
Low (-2)
Low (-2)
Low (-2)
Low (-2)
Low (-1)
habit, crown
trumpet
variegata
littoralis2
glass
coral
officinarum
sebestena
round, med
upright round, open
upright round, open
round, dense
round, dense
upright round, med
upright round, med
upright round, med
upright round, med
upright, med
upright round, dense
round, dense
round, open
upright round, med
upright round, dense
upright, dense
spreading, med
upright round, med
dense
round, dense
Plant debris type, other notes
moderate moderate lavender blue Sp none, low maint dry-med-wet flowers, fruits
moderate sensitive pink SpSu mod, med maint dry-med-wet flowers, pods
tolerant tolerant yellow Wn none, low maint dry-med succulent
none, low maint (Dry) med-wet flowers
tolerant tolerant inconspic. high, high maint dry-med-wet buttressing roots tolerant tolerant red, white, yellow, etc. SpSuFa
moderate moderate yellow Wn none, low maint dry-med-wet flowers, fruits
moderate sensitive inconspic. none, low maint (Dry) med-wet flowers, seeds moderate sensitive lavender SpSu none, low maint (Dry) med-wet flowers, pods
moderate sensitive light pink SpSuFa mod (flowers), med maint dry-med-wet flowers, pods sensitive moderate yellow SpSu mod, med maint dry-med-wet Landmark tree (decorative) flowers, pods moderate sensitive red SuFa none, low maint dry-med-wet invasive roots
tolerant tolerant inconspic. none, low maint dry-med fruits tolerant tolerant violet SpWn mod, med maint dry-med flowers, pods
moderate sensitive yellow SpSu mod, low maint dry-med-wet flowers, pods tolerant moderate yellow/green SpSuFaWn none, low maint dry-med-wet flowers, edible pods
tolerant sensitive orange Wn mod, low maint (Dry) med saltwater tolerant drought tolerant in the winter flowers, pods
moderate tolerant inconspic. none, low maint (Dry) med-wet buttressing roots fruiting can tolerate occasional inundation by salt water so long as the salt is then flushed out by fresh water
moderate moderate pink, white SpWn mod, med maint dry-med flowers, fruits
tolerant moderate white SpWn mod, med maint (dry) med Historically significant crop. Can be used as a barrier tolerant moderate red/orange SpSuFa low (fruit), med maint low-med flowers, fruits
tolerant sensitive red, orange SpSu mod (fruit), med maint dry-med-wet “invasive roots flowers, pods”
tolerant moderate pink/yellow, pink/ white Fa
none, low maint dry-med flowers
tolerant moderate inconspic. low, low maint dry-med-wet pods
tolerant moderate red SpSuFaWn none, low maint dry-med flowers tolerant sensitive golden/yellow Sp none, low maint dry-med-wet pods
tolerant tolerant yellow SpSu none, low maint dry-med flowers, pods moderate sensitive pink SpSu mod, med maint (Dry) med-wet flowers, pods
moderate moderate pink SpSuFa none, low maint dry-med-wet flowers, pods
tolerant moderate white SpSu none, low maint (dry) med Tolerant to unfavorable conditions, but slow growing flowers, pods tolerant moderate white low, med maint dry-med “Wide canopy, but tall roots may cause infrastructure damage pods”
tolerant tolerant red Fa mod, med maint dry-med-wet buttressing roots
moderate moderate yellow SpSu none, low maint dry-med “Does well in many conditions Drought, innundation, poor soil tolerant flowers, pods” tolerant tolerant inconspic low, low maint dry-med-wet
tolerant tolerant white Fa high, high maint dry-med-wet salt tolerant, coastal plant buttressing roots fruits contain tannins and may stain sidewalks
tolerant tolerant red Sp low, low maint dry-med flowers, pods
tolerant tolerant inconspic mod, high maint dry-med-wet buttressing roots fruits
tolerant tolerant inconspic mod, med maint dry-med-wet fruits
tolerant moderate yellow SpSuFaWn none, low maint dry-med flowers, pods
Listed on the 1999 Official Street Tree List. Consider removing from future official tree lists.
Listed on the 1999 Official Street Tree List. Consider removing from future official tree lists.
Listed on the 1999 Official Street Tree List. Consider removing from future official tree lists.
Commonly planted tree. White to purple orchid flowers aesthetically similar to the Hong Kong orchid tree
No. SIZE SCIENTIFIC NAME COMMON NAME
M Tabebuia ochracea yellow trumpet tree
L Cassia grandis pink shower tree L Catalpa longissima Yokewood
L Cocos nucifera Niu
L Enterolobium cyclocarpum Earpod tree
L Samanea saman Monkeypod
L Tabebuia aurea Silver trumpet tree
L Tabebuia donnellsmithii Gold tree
L Terminalia catappa Tropical almond
No. SIZE SCIENTIFIC NAME COMMON NAME
S Diospyros sandicensis Lama
S Metrosideros polymorpha
Ōhiʻa lehua
S Cordia sebestena Kou haole
S Conocarpus erectus Buttonwood
S Gliricidia sepium Madre de cacao
S Plumeria rubra Plumeria
S Guaiacum officinale Lignum vitae
S Callistemon citrinus Red bottlebrush
S Ceratonia siliqua Carob
M Reynoldsia sandwicensis
Ohe makai
M Thespesia populnea Milo
M Eucalyptus torquata Coral gum
M Tabebuia ochracea Yellow trumpet tree
M Cochlospermum vitifolium Buttercup tree
M Harpullia pendula Tulipwood
M Lagerstroemia speciosa Pride of India
M Tabebuia berteroi Hispaniolan rosy trumpet
M Bauhinia × blakeana Hong kong orchid tree
M Colvillea racemosa Colville’s-glory
M Tipuana tipu Rosewood
M Tabebuia heterophylla Pink trumpet tree
M Aleurites moluccana Kukui
L Heritiera littoralis Looking glass tree
L Catalpa longissima Jamaican oak
L Tabebuia aurea Silver trumpet tree
L Cocos nucifera Niu
No. SIZE SCIENTIFIC NAME COMMON NAME
S Psydrax odorata Alahe
e
S Conocarpus erectus buttonwood
S Dracaena draco dragon tree
S Plumeria rubra plumeria
S Guaiacum officinale lignum vitae
S Ceratonia siliqua Carob
M Cordia subcordata Kou
M Sapindus saponaria Manele
M Thespesia populnea Milo
M Delonix regia royal poinciana
M Tabebuia ochracea yellow trumpet tree
M Lagerstroemia speciosa Pride of India
M Tabebuia berteroi Hispaniolan rosy trumpet
M Bauhinia × blakeana Hong kong orchid tree
M Colvillea racemosa Colville’s-glory
M Tipuana tipu Rosewood
M Tabebuia heterophylla Pink trumpet tree
M Aleurites moluccana Kukui
L Erythrina variegata Indian coral tree
L Cassia grandis pink shower tree
L Samanea saman Monkeypod
L Tabebuia aurea Silver trumpet tree
L Terminalia catappa Tropical almond
L Salophyllum inophyllum Kamani
S Plumeria rubra Plumeria
S Metrosideros polymorpha
Ōhi
a lehua
S Conocarpus erectus Buttonwood
S Psydrax odorata Alahe
e
M Tabebuia ochracea Yellow trumpet tree
M Harpullia pendula Tulipwood
M Lagerstroemia speciosa Pride of India
M Tabebuia heterophylla Pink trumpet tree
M Thespesia populnea Milo
M Sapindus saponaria Manele
M Aleurites moluccana Kukui
M Cordia subcordata Kou
M Bauhinia × blakeana Hong kong orchid tree
M Tabebuia berteroi Hispaniolan rosy trumpet
M Cochlospermum vitifolium Buttercup tree
L Terminalia catappa Tropical almond
L Tabebuia aurea Silver trumpet tree
L Cassia grandis pink shower tree
L Erythrina variegata Indian coral tree
S Cordia sebestena kou haole
S Conocarpus erectus buttonwood
S Gliricidia sepium madre de cacao
S Dracaena draco dragon tree
S Plumeria rubra plumeria
S Guaiacum officinale lignum vitae
S Callistemon citrinus red bottlebrush
S Ceratonia siliqua Carob
S Pterocarpus rohrii bloodwood
S Erythrina crista-galli coral tree
M Erythrina sandwicensis wiliwili
M Reynoldsia sandwicensis ʻOhe makai
M Cordia subcordata Kou
M Pandanus tectorius Hala
M Sapindus saponaria Manele
M Thespesia populnea Milo
M Delonix regia royal poinciana
M Eucalyptus torquata Coral gum
M Tabebuia ochracea yellow trumpet tree
M Cochlospermum vitifolium Buttercup tree
M Harpullia pendula Tulipwood
M Lagerstroemia speciosa Pride of India
M Tabebuia berteroi Hispaniolan rosy trumpet
M Thespesia grandiflora maga
M Bauhinia × blakeana Hong kong orchid tree
M Colvillea racemosa Colville’s-glory
M Tipuana tipu Rosewood
M Tabebuia heterophylla Yellow trumpet tree
M Aleurites moluccana Kukui
L Heritiera littoralis Looking glass tree
L Erythrina variegata Indian coral tree
L Pseudobombax ellipticum shaving brush tree
L Tamarindus indica Tamarind
L Tabebuia donnellsmithii Gold tree
Cassia grandis pink shower tree
Ficus elastica Rubber tree
Samanea saman Monkeypod
Catalpa longissima Jamica oak
L Enterolobium cyclocarpum
Ficus benghalensis
tree
SIZE SCIENTIFIC NAME COMMON NAME
S Hibiscus brackenridgei Ma
S Metrosideros polymorpha
Ōhi
S Rauvolfia sandwicensis Hao
o hau hele
a lehua
tree
Tabebuia aurea Silver trumpet tree
Ficus benjamina
banyan
L Terminalia catappa Tropical almond
L Salophyllum inophyllum
SIZE SCIENTIFIC NAME COMMON NAME
M Tabebuia ochracea Yellow trumpet tree
L Cassia grandis pink shower tree
L Catalpa longissima Jamaica oak
L Cocos nucifera Niu
L Enterolobium cyclocarpum Ear tree
L Samanea saman Monkeypod
L Tabebuia aurea Silver trumpet tree
L Tabebuia donnellsmithii Gold tree
L Terminalia catappa Tropical almond
S Cordia sebestena Kou haole
S Conocarpus erectus Buttonwood
S Ceratonia siliqua Carob
S Pterocarpus rohrii Bloodwood
M Reynoldsia sandwicensis
Ohe makai
M Thespesia populnea Milo
M Eucalyptus torquata Coral gum
M Tabebuia ochracea Yellow trumpet tree
M Cochlospermum vitifolium Buttercup tree
M Harpullia pendula Tulipwood
M Lagerstroemia speciosa Pride of India
M Tabebuia berteroi Hispaniolan rosy trumpet
M Thespesia grandiflora Maga
M Bauhinia × blakeana Hong kong orchid tree
M Colvillea racemosa Colville’s-glory
M Tipuana tipu Rosewood
M Tabebuia heterophylla Pink trumpet tree
M Aleurites moluccana Kukui
L Heritiera littoralis Looking glass tree
L Pseudobombax ellipticum Shaving brush tree
L Tabebuia donnellsmithii Gold tree
Catalpa longissima Jamaican oak
L Tabebuia aurea Silver trumpet tree
Page intentionally left blank.