T.L.L. TEMPLE FOUNDATION
OCCUPATIONAL STRUCTURE & DEMAND
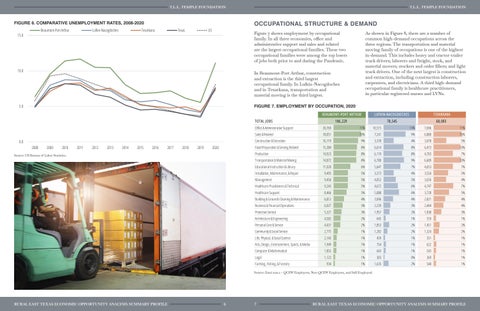
Figure 6. COMPARATIVE UNEMPLOYMENT RATES, 2008-2020 Beaumont-Port Arthur
15.0
Lufkin-Nacogdoches
Texarkana
Texas
T.L.L. TEMPLE FOUNDATION
US
Figure 7 shows employment by occupational family. In all three economies, office and administrative support and sales and related are the largest occupational families. These two occupational families were among the top losers of jobs both prior to and during the Pandemic.
10.0
As shown in Figure 8, there are a number of common high-demand occupations across the three regions. The transportation and material moving family of occupations is one of the highest in-demand. This includes heavy and tractor-trailer truck drivers; laborers and freight, stock, and material movers; stockers and order fillers; and light truck drivers. One of the next largest is construction and extraction, including construction laborers, carpenters, and electricians. A third high-demand occupational family is healthcare practitioners, in particular registered nurses and LVNs.
In Beaumont-Port Arthur, construction and extraction is the third largest occupational family. In Lufkin-Nacogdoches and in Texarkana, transportation and material moving is the third largest. Figure 7. EMPLOYMENT BY OCCUPATION, 2020
5.0
BEAUMONT -POR T AR T H UR
L UF KI N-NACOGDOCH ES
T EX AR KANA
186, 229
78, 545
68, 083
T OT AL J OBS
0.0 2008
2009
2010
2011
2012
2013
2014
2015
2016
2017
2018
2019
2020
Source: US Bureau of Labor Statistics.
Office & Administrative Support
20,769
11%
10,515
13%
7,696
11%
Sales & Related
18,051
10%
7,241
9%
6,800
10%
Construction & Extraction
16,119
9%
3,378
4%
3,078
5%
Food Preparation & Serving Related
15,384
8%
6,614
8%
6,473
10%
Production
14,923
8%
6,174
8%
4,703
7%
Transportation & Material Moving
14,872
8%
6,780
9%
6,609
10%
Educational Instruction & Library
11,020
6%
5,647
7%
4,653
7%
Installation, Maintenance, & Repair
9,495
5%
3,373
4%
3,550
5%
Management
9,450
5%
4,052
5%
3,026
4%
Healthcare Practitioners & Technical
9,243
5%
4,672
6%
4,747
7%
Healthcare Support
8,466
5%
5,088
6%
3,728
5%
Building & Grounds Cleaning & Maintenance
6,812
4%
3,096
4%
2,821
4%
Business & Financial Operations
6,027
3%
2,239
3%
2,404
4%
Protective Service
5,321
3%
1,957
2%
1,838
3%
Architecture & Engineering
4,582
2%
645
1%
559
1%
Personal Care & Service
4,431
2%
1,853
2%
1,451
2%
Community & Social Service
2,775
1%
1,282
2%
1,324
2%
Life, Physical, & Social Science
2,143
1%
459
1%
351
1%
Arts, Design, Entertainment, Sports, & Media
1,949
1%
754
1%
622
1%
Computer & Mathematical
1,855
1%
643
1%
543
1%
Legal
1,123
1%
303
0%
369
1%
934
1%
1,635
2%
540
1%
Farming, Fishing, & Forestry
Source: Emsi 2021.2 – QCEW Employees, Non-QCEW Employees, and Self-Employed.
RURAL EAST TEXAS ECONOMIC OPPORTUNITY ANALYSIS SUMMARY PROFILE
6
7
RURAL EAST TEXAS ECONOMIC OPPORTUNITY ANALYSIS SUMMARY PROFILE

